The almost certain bull case for US growth
The private sector continues to de-leverage. Are fiscal deficits big enough to overcome that and drive 5%+ growth?
My last newsletter drew out the linkages between domestic debt accumulation and GDP growth. It’s time to put those conclusions to the test.
This newsletter uses those linkages and tries to forecast each segment of domestic debt growth to predict what GDP growth will look like in the US over the next 5 years.
Forecasting over a long period of time is fraught with error and is interrupted with large events that change the path of the economy relatively frequently. Moderate sized drawdown events occur roughly once every 10 years, with more extreme events occurring once every 30 years.
We can’t hope to predict these economy changing events, and I suggest ignoring anyone that claims that they can.
Therefore, the aim for this model is to form a view on whether nominal GDP growth is going to look more like the post-GFC lull in growth of ~4% (2% real growth and 2% inflation), or more like what we are seeing now, with nominal growth well above 5%, a level that was persistent in the 90s.
Growth consistently above 5% will keep Fed interest rates high, or maybe cause them to move even higher.
Alternatively, persistent nominal growth below 4% will see the interest rate regime move back to ZIRP and QE. It may also resurrect the 60/40 portfolio.
The growth regime doesn’t guarantee or negate the chance of recession. The chance of recession is not entertained here. However, it can follow that higher average growth makes recession less likely, however more debt breeds instability.
Calling the regime for nominal GDP growth, for these reasons, is very important.
The forecasting framework
The forecasting model will use the public, private, or external sector balances, as exhibited by the net borrowing or net saving of each sector. An external deficit (or inbound capital surplus) can manifest itself as either public or private borrowing (or neither if it ends up in equity investments).
All three sectors in a net deficit1 should be the most beneficial to growth, allowing the economy to grow at a rate faster than would otherwise be possible through the “organic” contributors which include working population growth and total factor productivity (TFP).
The nominal growth boom of the last few years since the pandemic has been a public sector deficit story, with the US Federal government borrowing an enormous amount to sponsor an economy which had all but entirely shut down.
The model will combine all three sectoral balances to try and predict nominal growth in the past and in the future.
Since the most recent cycle has been driven by public spending, this is the right place to start.
Fiscal isn’t going away
This fiscal cycle, which reduced in 2022 but is growing again in 2023, drove both real GDP growth and inflation, adding to give nominal GDP growth well above that of the previous 10 years.
The initial view might be that the public deficit should contract back to what it was before the pandemic. This would essentially halve the deficit, with current deficits being roughly twice the size of what they were back then.
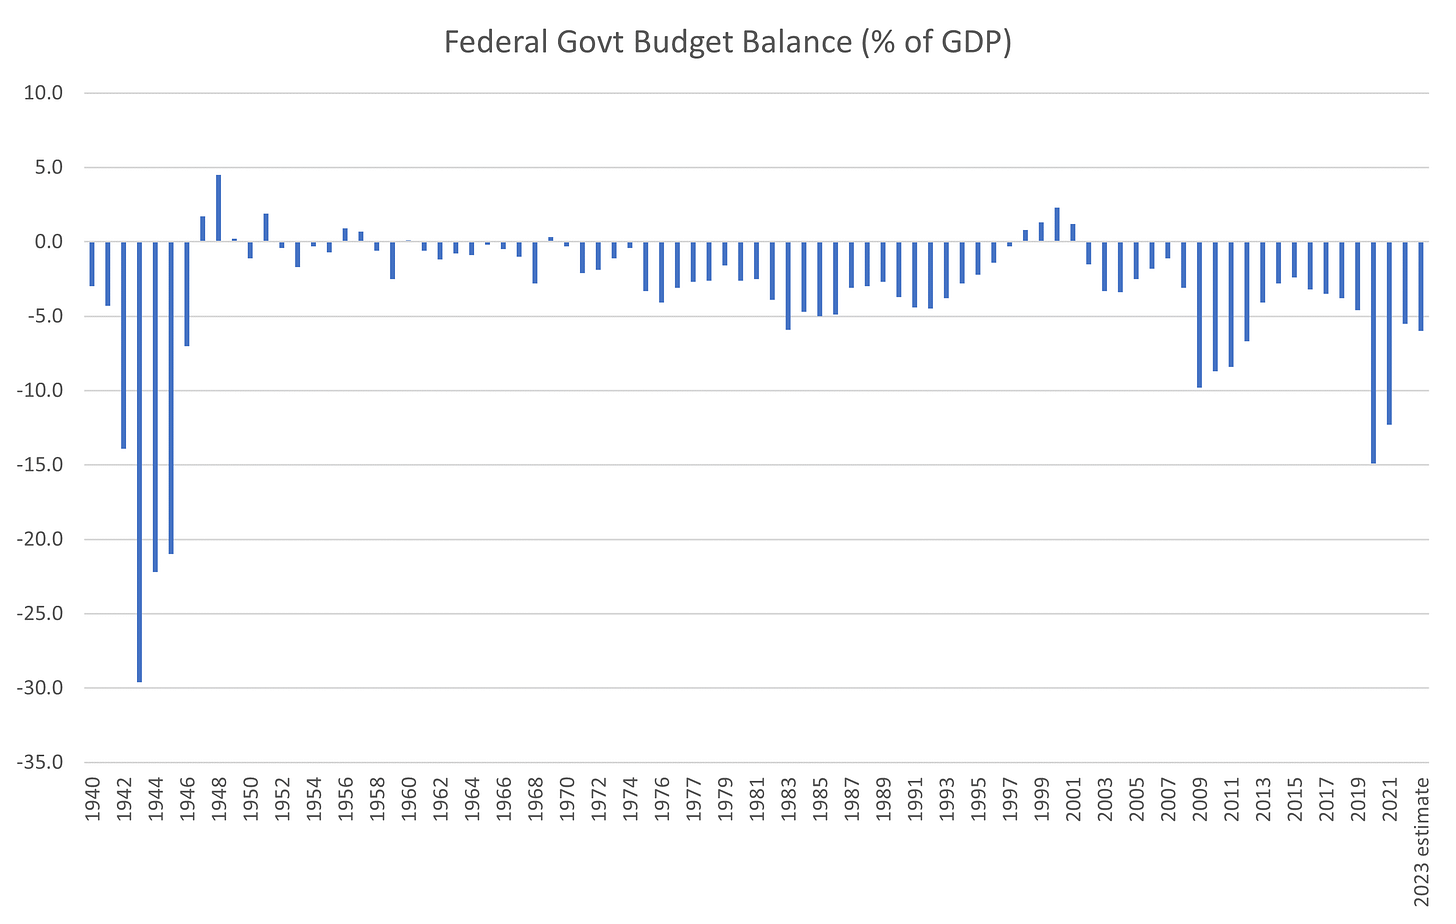
One key aspect has permanently changed over this time, however. The size of interest payments within the deficit has skyrocketed.
The payment of interest on outstanding debt is a non-negotiable expense for the Federal government. These interest costs have provided a secondary boost as the excess savings of transfer payments during the pandemic dwindled.
The effect of an expansion in interest payments is overlooked as a bullish factor on economic growth, probably because:
It hasn’t happened since the bond bull market started in the 80s; and
A huge stock of debt is needed for it to make any difference at modern (relatively low) interest rates.
Interest payments as stimulus
When compared to history, the current quantum of interest payments has reached the peak as a percentage of GDP that occurred during the late 70s and early 80s.
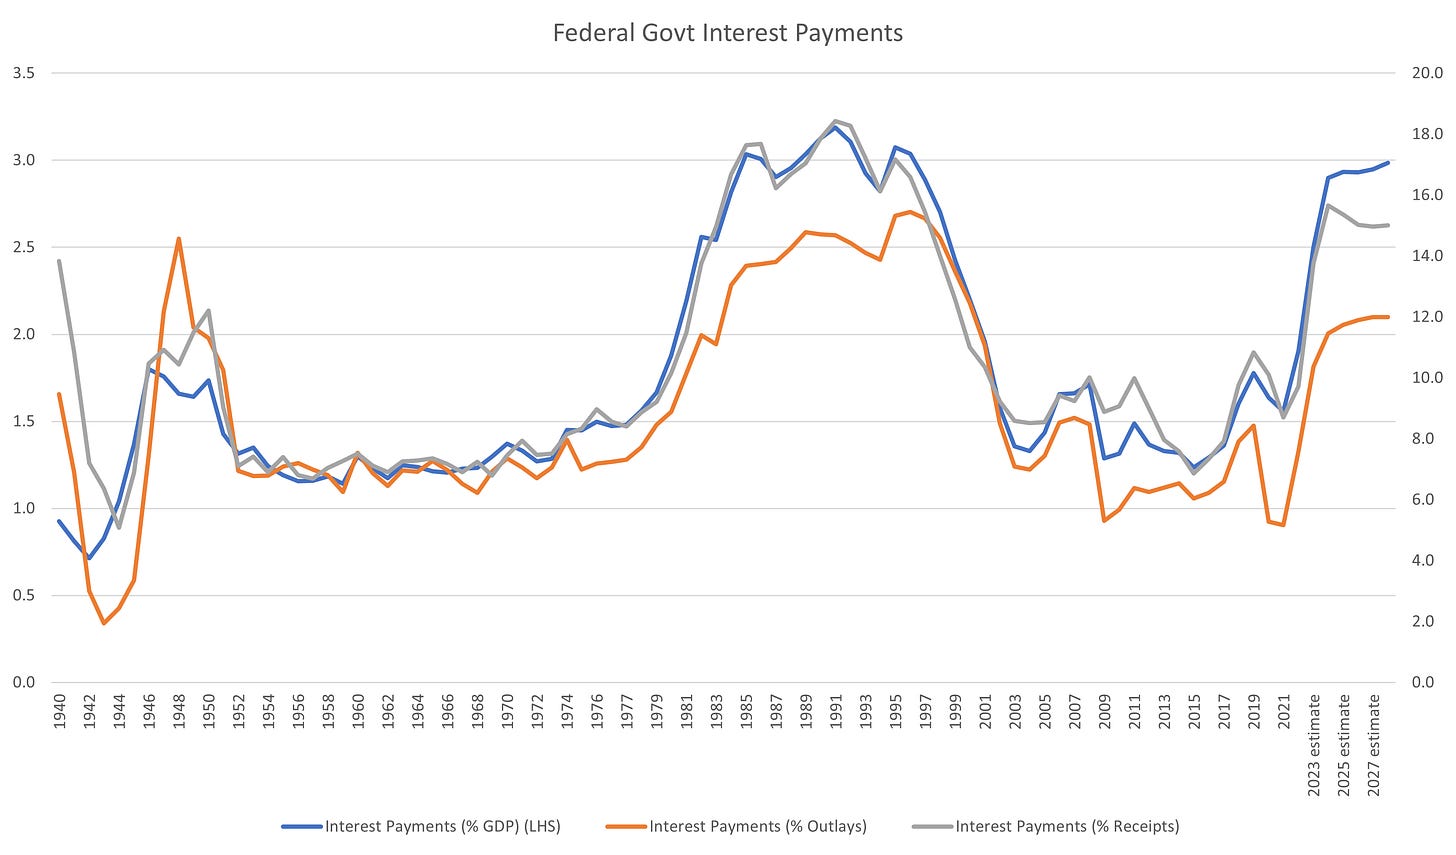
However, does anyone realistically need to sacrifice anything to support those interest costs?
In traditional economic models that nearly all central banks use, rising interest rates have a contractionary effect on the economy. They stipulate that there is a net cost for the economy to bear when interest rates are higher, which was the explanation for years of ZIRP. This assumption arises from the focus on the business cycle and the private sector.
The private sector only owes interest to itself, so the mechanical effect of rising interest rates has a net zero effect. The contractionary effect comes from the unbalanced effect on consumption and investment from those that are paying interest; the effect on those parties is far greater than the effect on those receiving higher interest payments.
The problem is that this effect doesn’t apply to government at all. In fact, the opposite occurs, leading to a stimulative effect from the point of view of the private sector.
For an issuer like the US government where demand for their debt is self-sustaining and unaffected by short-term deficits, there is no need for primary (ex-interest payments) deficits to decrease because of an increase in the size of interest payments.
It follows that since there is no external pressure to reduce the primary deficit, why would it ever happen? The reality of politics is that any attempt to try and reduce the primary deficit would result in a swift loss of power for that party, despite what voters say they want.
For argument’s sake, if we consider interest payments to be as stimulative as discretionary spending, then discretionary spending could feasibly be reduced without any ill effects on the economy. In this case the same rules as for the private sector apply, and higher interest rates would be contractionary if this were to happen.
However, the feasibility of reducing discretionary spend (even with political support) is low, as it would result in real services being shut down and put real people out of jobs. Governments don’t generally do this.
If we accept that interest payments are equivalent to other types of government spending but with slightly less efficacy than those directed at parties with a higher propensity to spend, then the recent increase in interest payments should have caused nominal growth to persist above the “organic” rate of growth.
Fiscal forecasting
The forecasts and charts below use estimates from the Office of Management and Budget (OMB), so the usual caveats on their estimates apply. These estimates will not only be prone to errors from forecasts of underlying spending, but also from where yields end up over the years into the future.
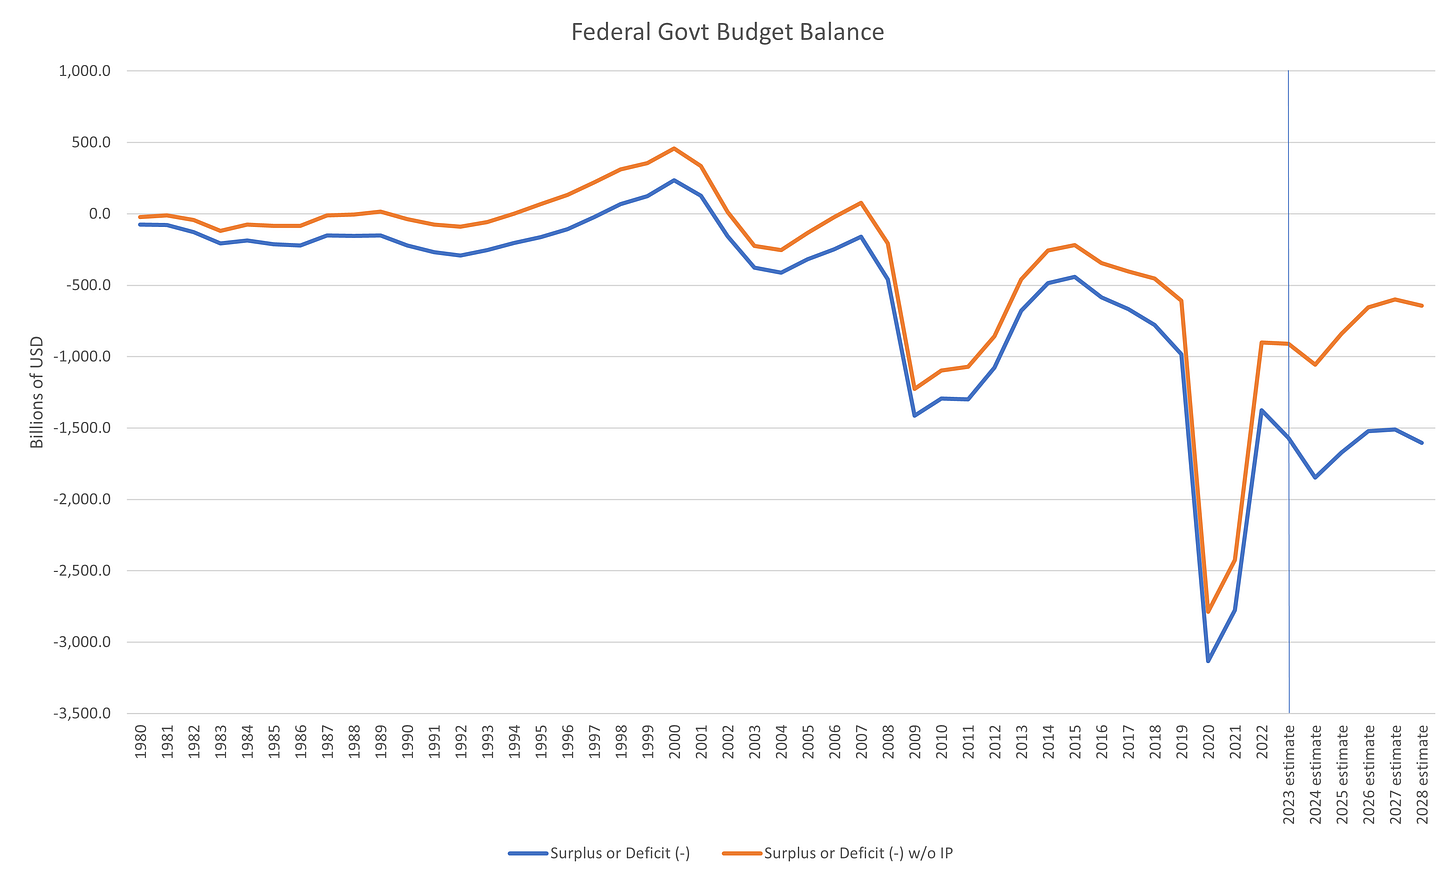
According to these forecasts, interest costs on Federal government debt will rise to just shy of $1 trillion by 2028.
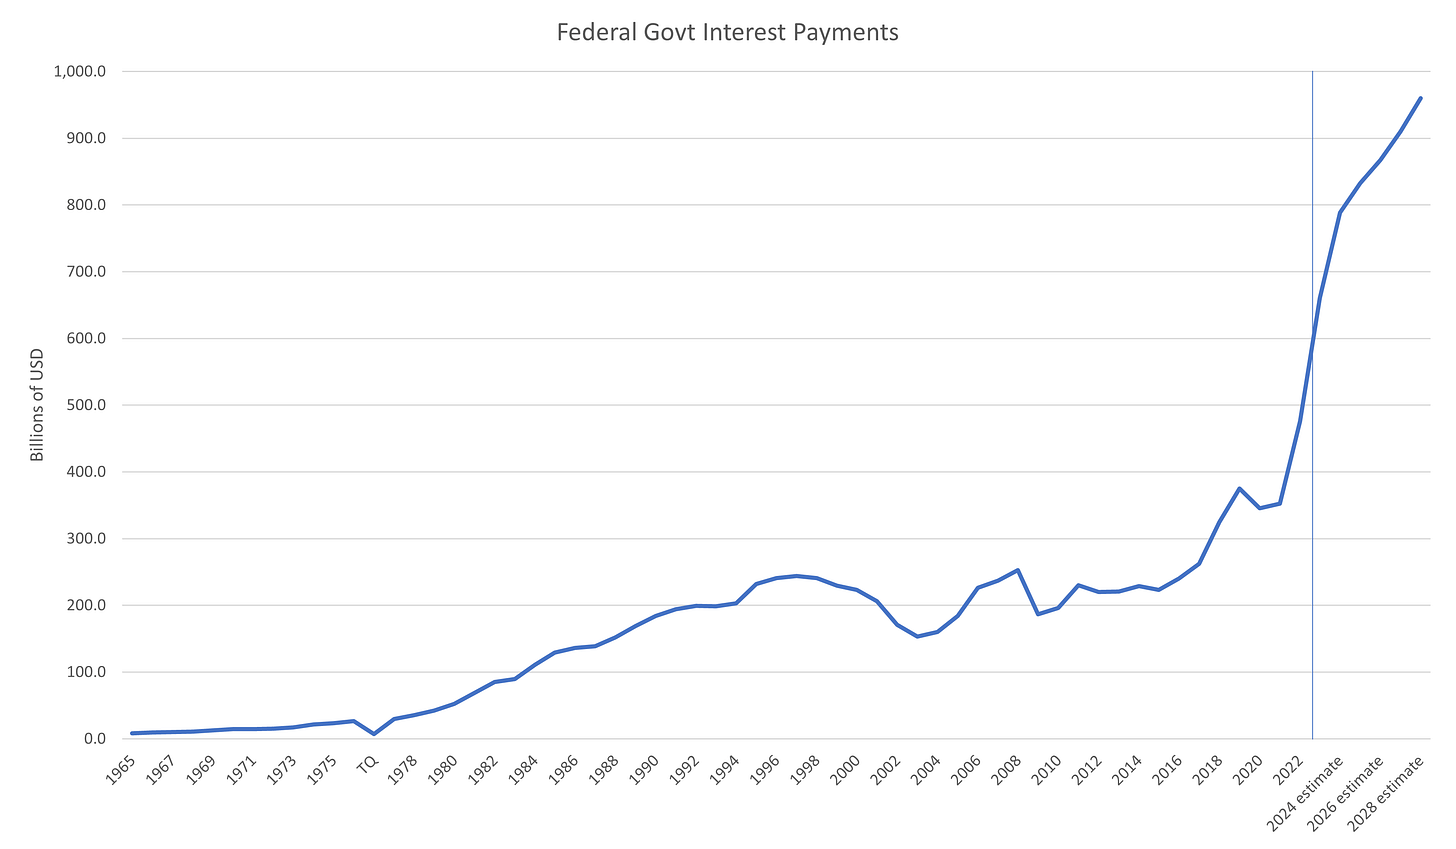
Despite this, the OMB estimates that the deficit will worsen only slightly from the 2023 estimate, despite another $400bn of interest costs yet to hit the budget. The widening gap between the deficit including and excluding interest payments can be seen in the chart below.
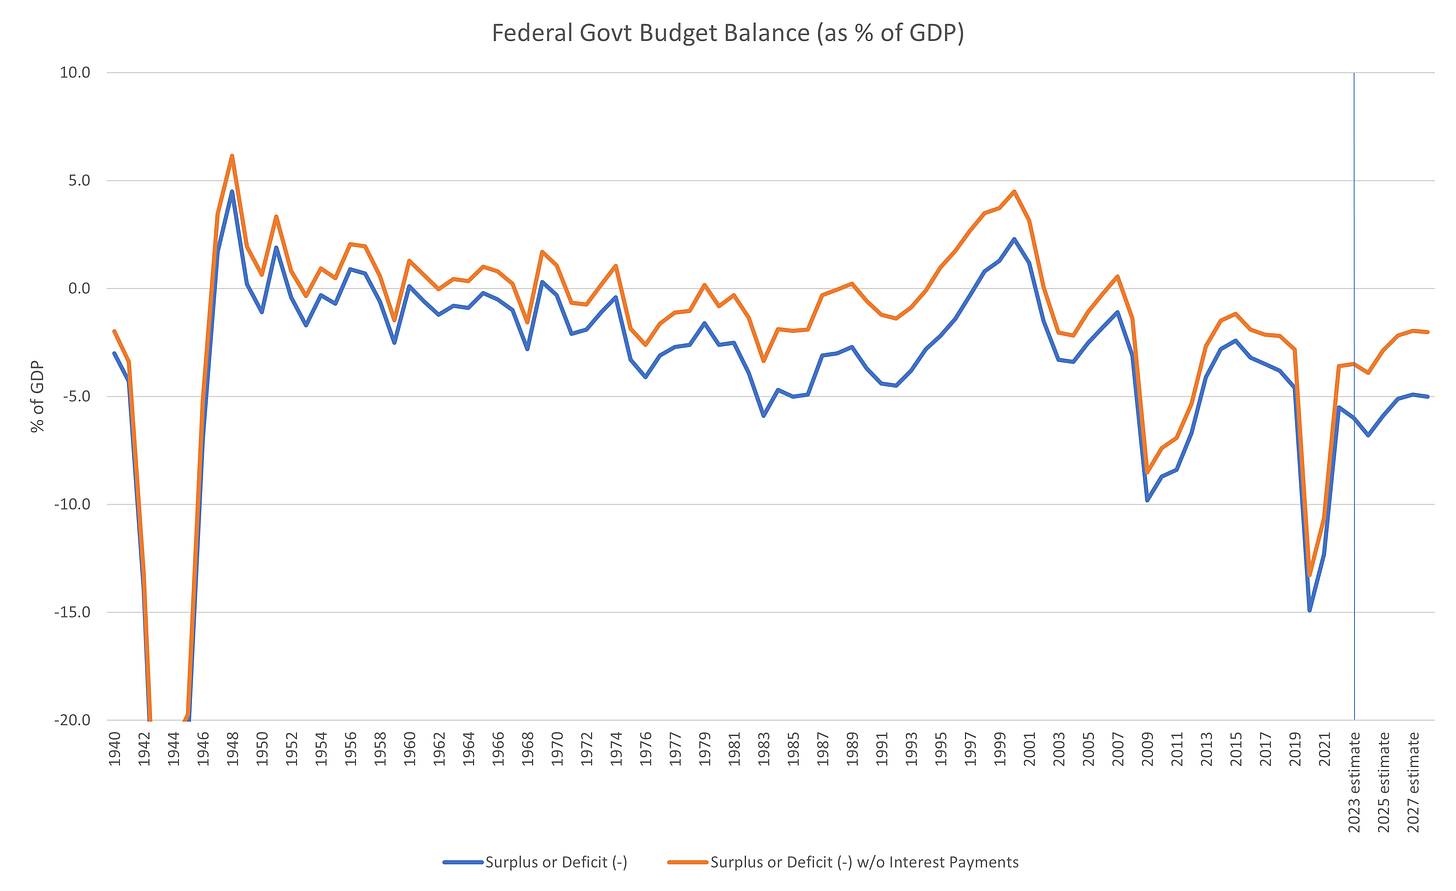
The forward estimates imply that the deficit ex-interest costs will narrow to accommodate. While this might eventuate, especially if the economy is strong, it is unlikely. The deficit ex-interest payments has been worsening since the Clinton-era surpluses ended, unable to break the downward trend. This trend can also be seen when considering the deficit as a percentage of GDP.
The recovery in the primary deficit would be bucking the trend of the last 20 years, and with the state of politics that it is currently in I would hesitate to assume that will come to pass.
Unless there is some regime change inherent in a higher level of interest rates that allows discretionary spend to reduce, I consider the OMBs forecasts to be unlikely, meaning that the deficit will likely continue to expand resulting in a “business-as-usual” deficit of 8% of GDP rather than the OMB’s forecast in the chart above of 5% of GDP.
Deficit expansion will be supportive of nominal GDP and will keep the fire that has stoked inflation over the last few years alive.
The counter: weak private sector borrowing
The public sector is likely to continue to expand its stimulative effect on the economy into the late 2020s. The private sector, on current trends, might do the exact opposite, at least for a while.
Understanding what exactly drives private credit growth is difficult. Extended periods where there is a stagnant or declining stock of debt are usually defined by banking crisis in which demand and supply of credit is affected.
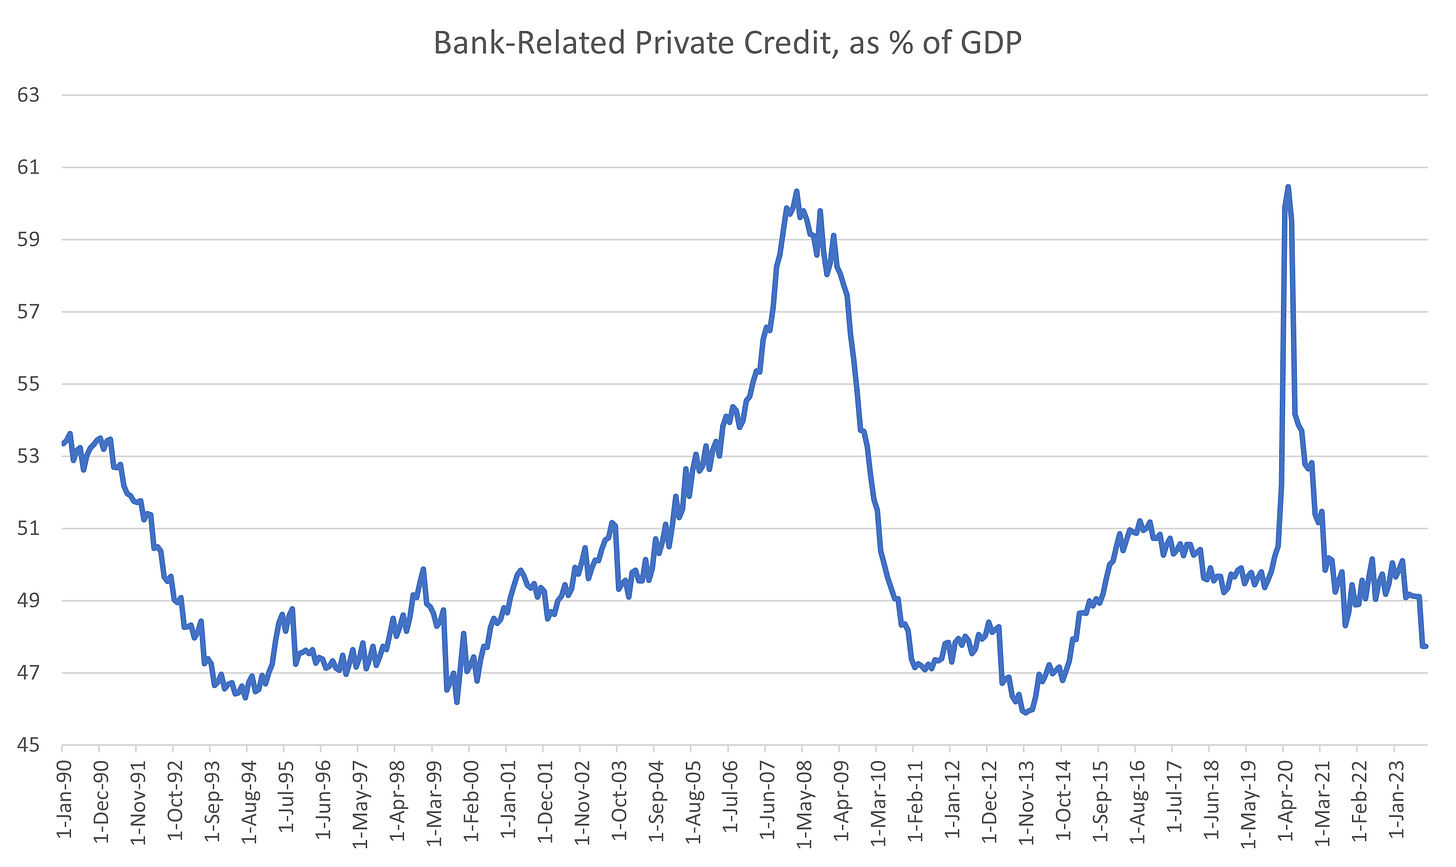
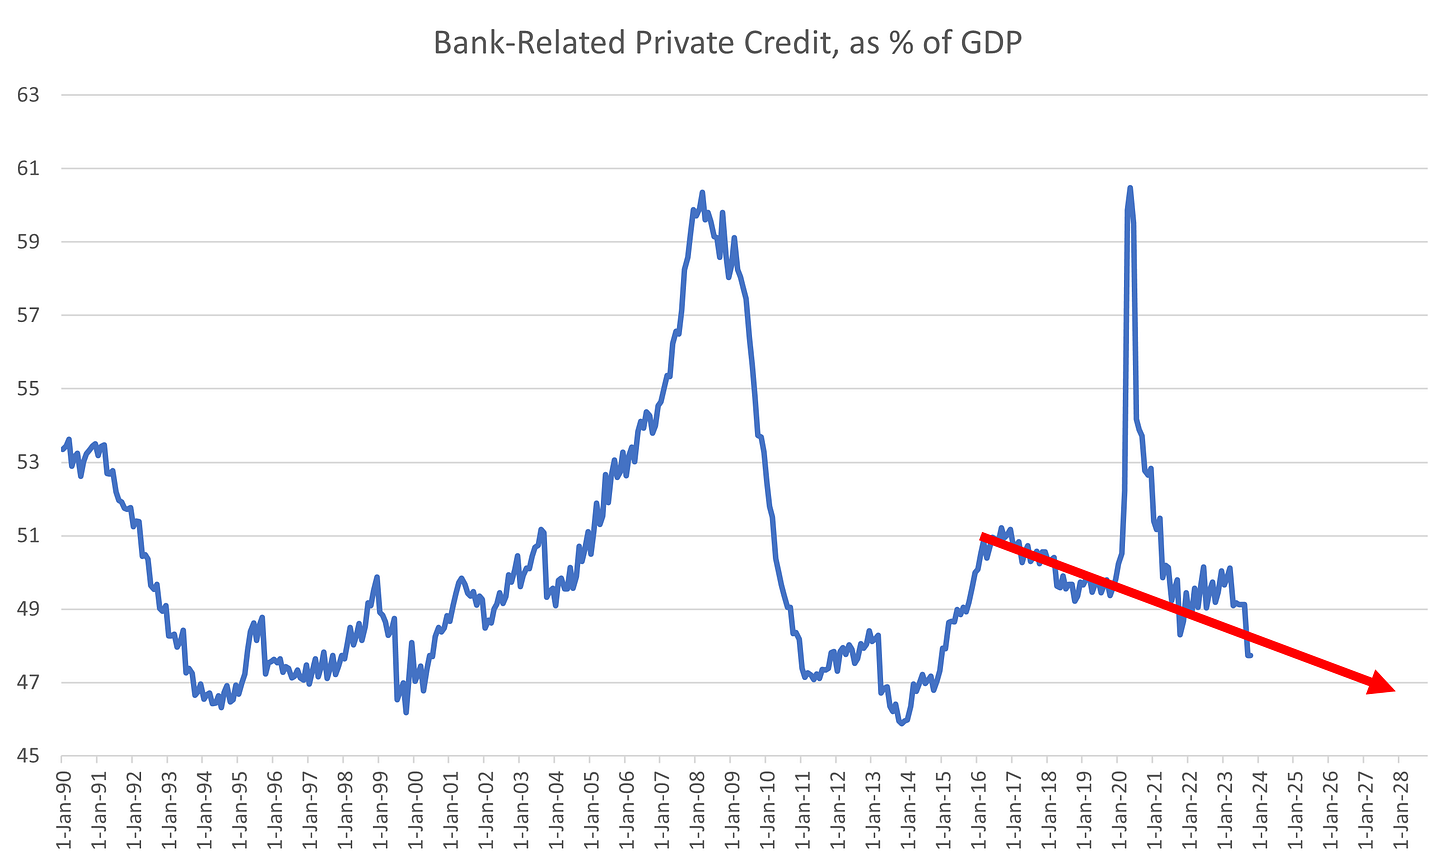
My dataset of all bank-related private credit2 shows containment in a tight range since 1990, bouncing in between 47% and 53% of GDP, with the notable exception of in the lead-up to the GFC.
We are heading towards the bottom of that range now, with bank-related private credit stagnating in nominal USD terms and nominal growth racing ahead the proportion compared with GDP has fallen.
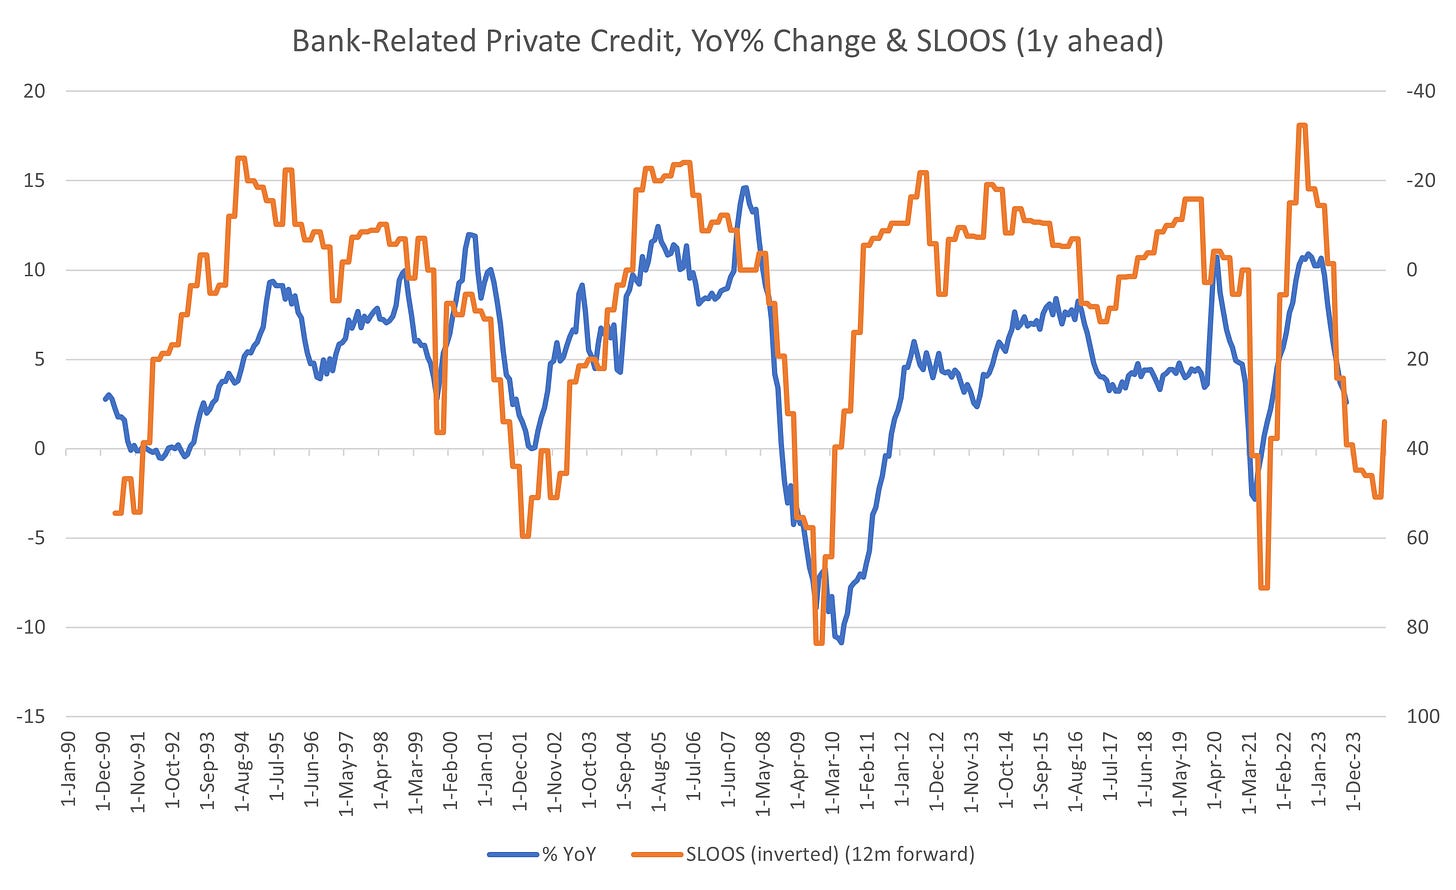
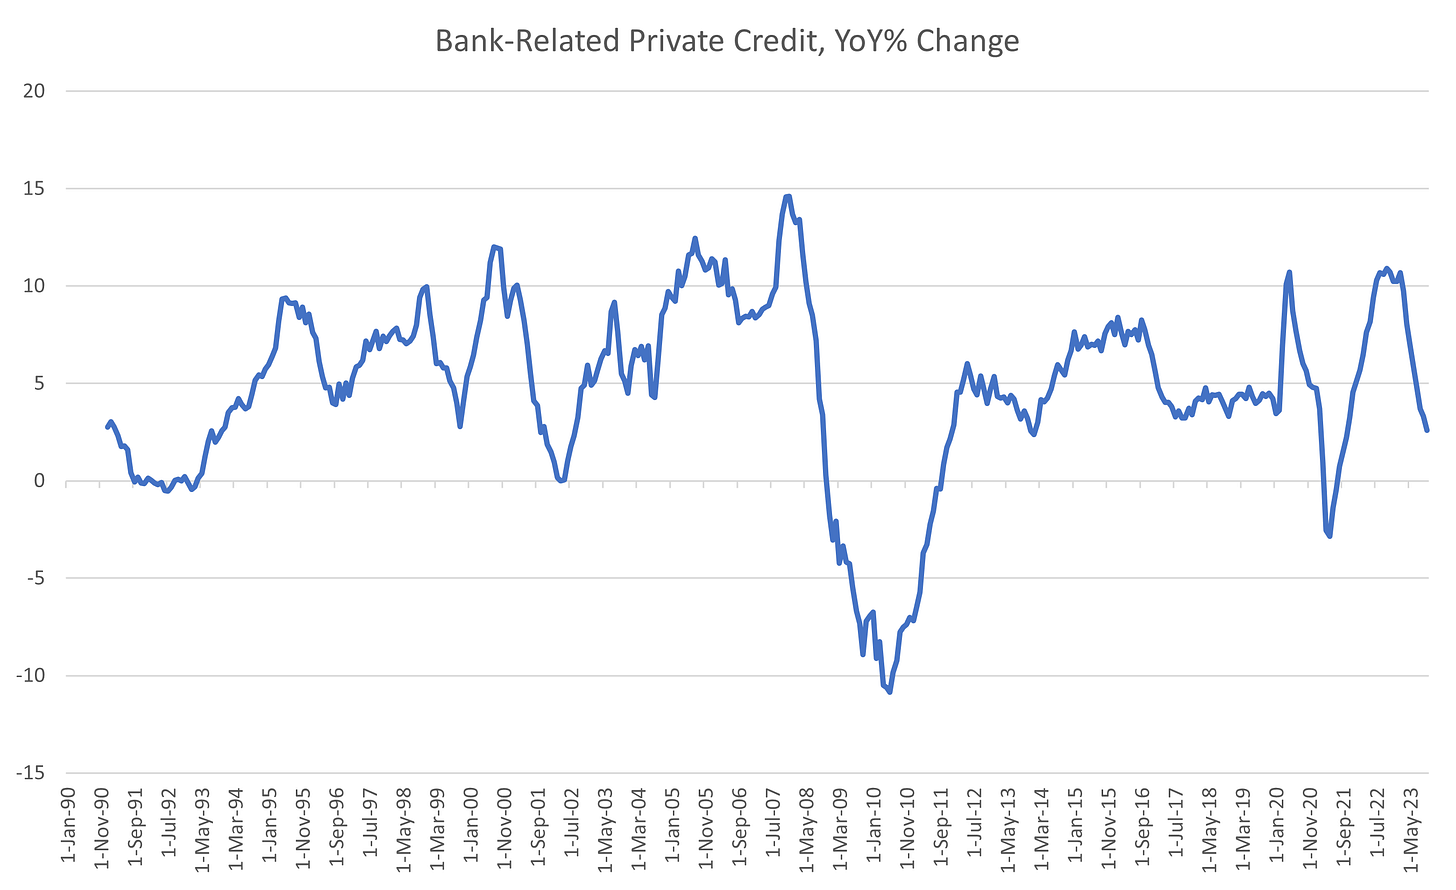
This has resulted in the year-on-year change in bank-related private credit to slow to recession risk levels. For those that use the year-on-year M2 chart as a recession signal, this version works far better than M2 as it captures the relevant “asset side” of all deposit-like liabilities3. This measure is still indicating growth over the last year, but shorter-term measures are contracting, a result which is rare, and concerning.
Despite a larger fall relative to GDP recently, private credit has been on a downward trend as a proportion of GDP since mid-2016. This could be associated with uncertainty related to politics, or a contemporaneously slowing China, and prompted low nominal growth and deflationary worries of those years.
Projecting a trend on this post-2016 regime in credit growth puts the arrival at the lower-bound of credit growth in late-2028.
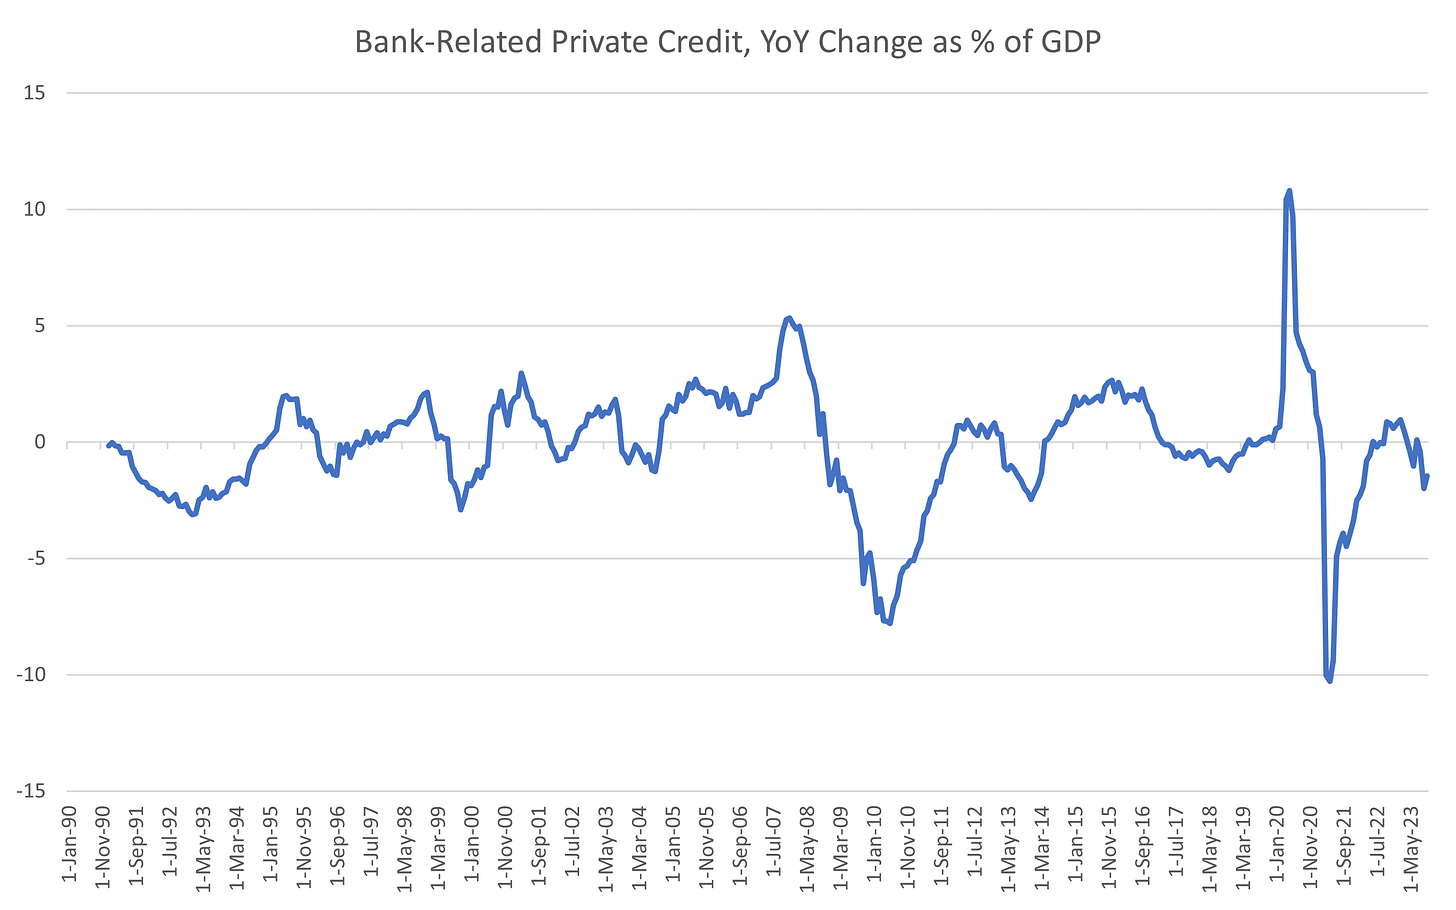
The pace of this decline is less that it seems. This would put private sector de-leveraging at 0.5% of GDP per year on average, well within the change in private credit that has usually defined recessions. I would consider the forecast that arises from this trend to be conservative, with a better result (private borrowing in-line with GDP) to be more likely.
This pace of contraction in private credit (-0.5%) defined the low growth years of 2016 to 2019 however, but this was without the help of the public sector that is present now.
Combining public, private, and external balances – the growth model
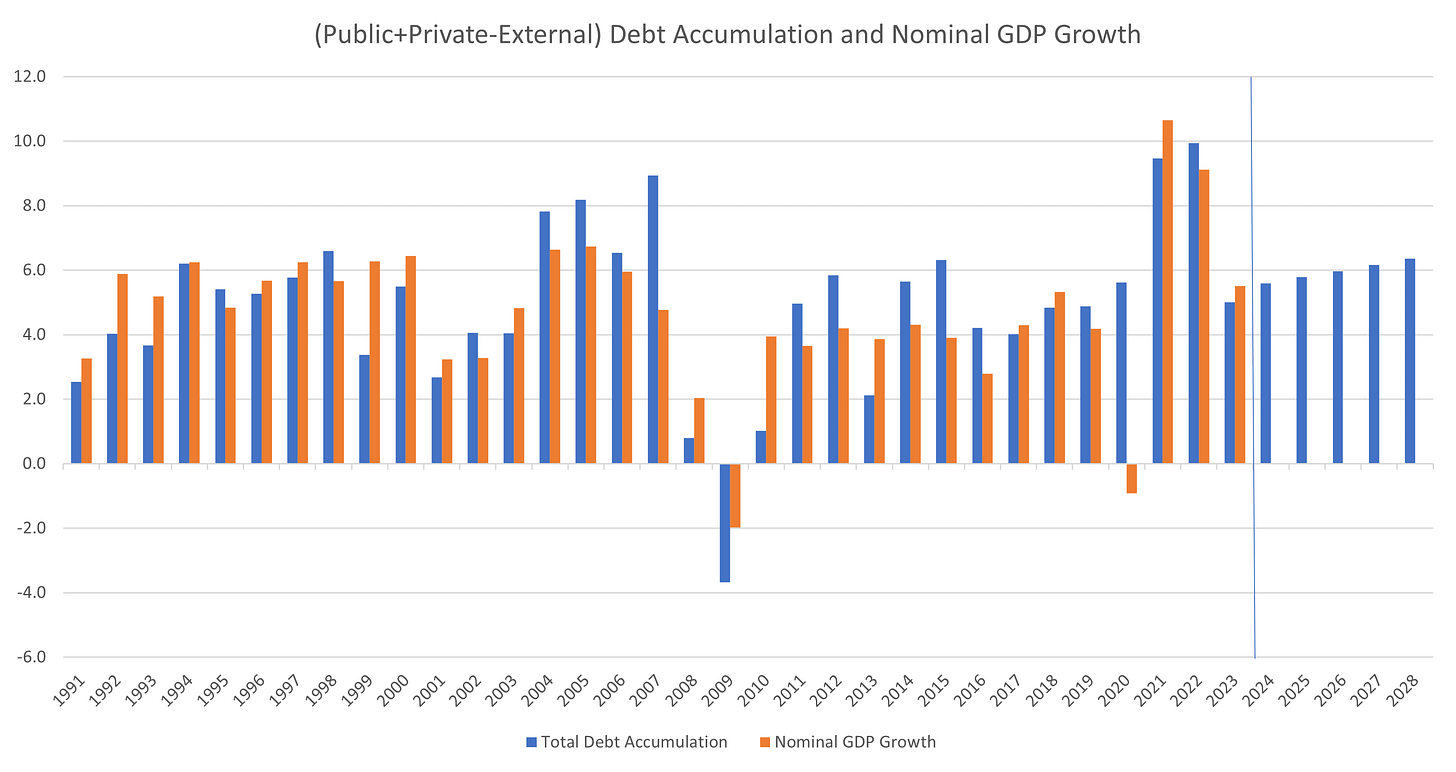
Weighting the contribution to the total deficit from each sector and comparing to nominal GDP growth produces the chart below.
The R2 for this model is 0.51, but if we exclude 2020 the resultant R2 is 0.70, showing a strong relationship. Note that this model is using the same year’s sectoral balance data to predict that year’s GDP figure, making contemporaneous usage difficult (unless deficits are announced ahead of time like in 2020/21)4.
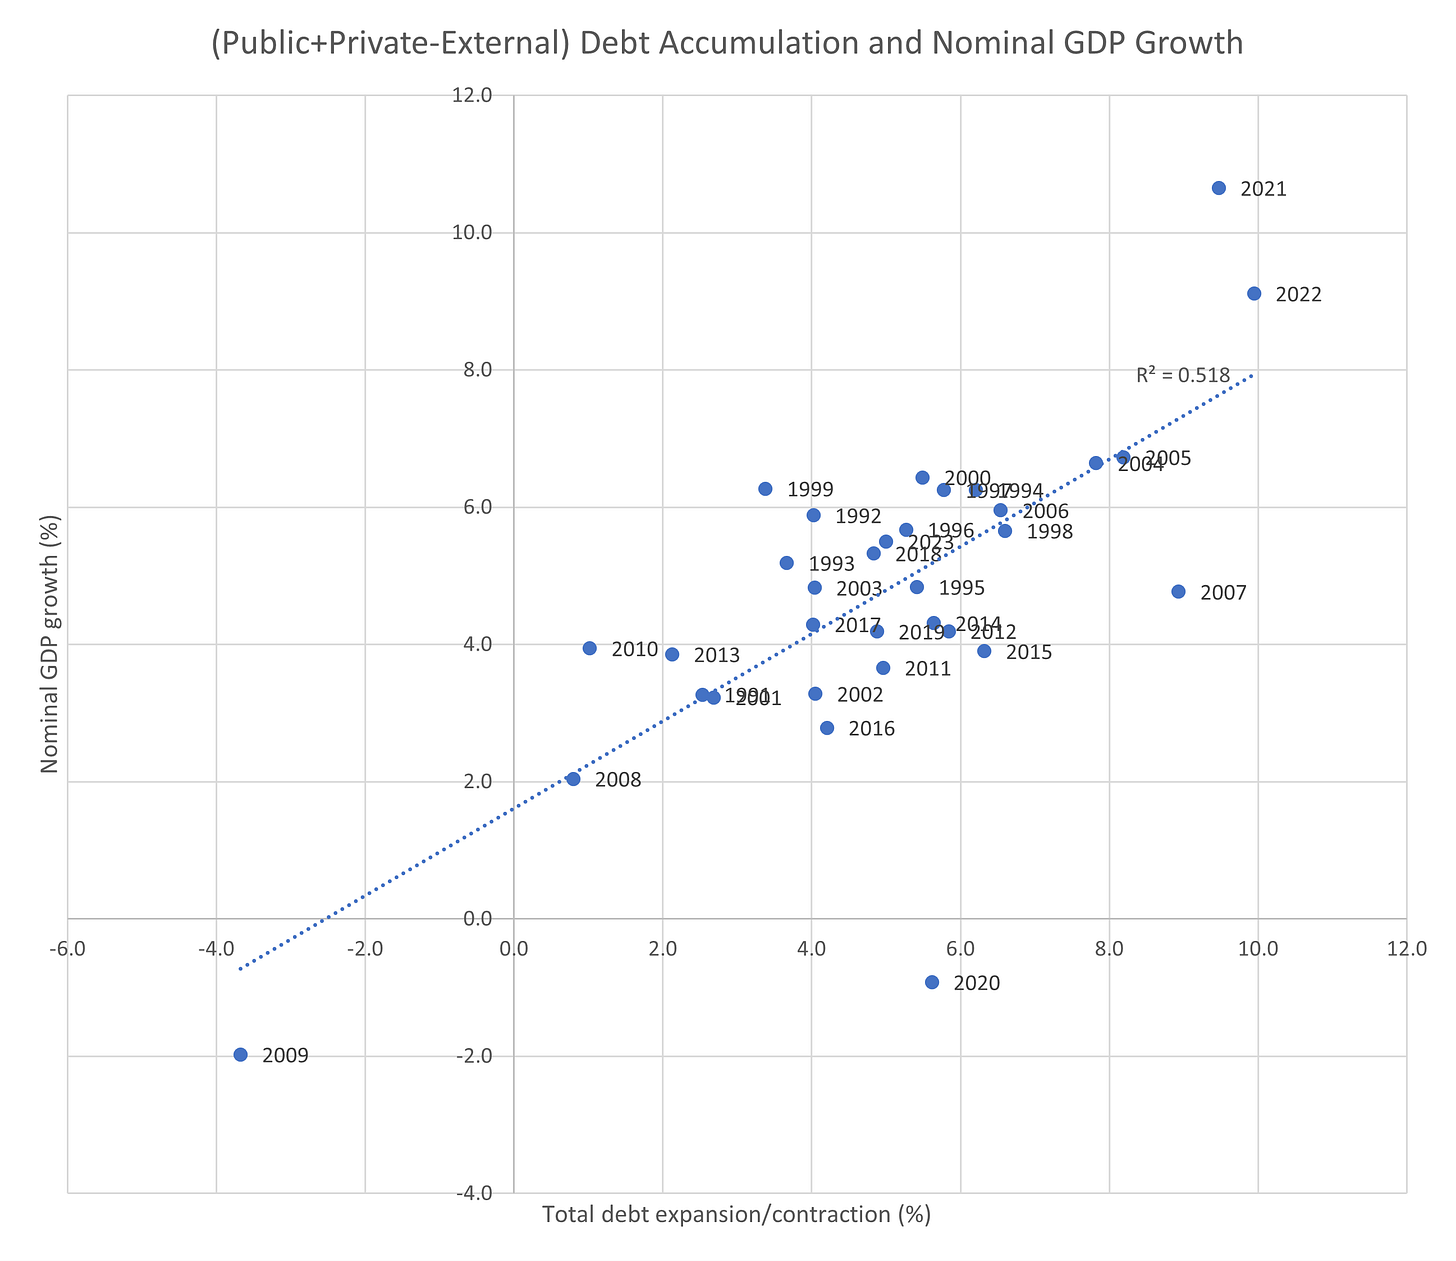
The weightings in this model show that private debt accumulation provides a 3 times stronger effect on nominal GDP growth than public debt does, with the contribution from an external deficit is shown to be minimal (this is likely due to the external deficit already being counted in either public or private balances).5
The model does a remarkable job of predicted nominal GDP growth in most years, with large errors only occurring in 1999, 2007 and 2020. Errors seem to a strong signal of impending crisis; however, they vary between over-predicting and under-predicting growth.
Using my estimates of future public and private balances from above, the forecast annual combined deficit across all sectors averages 6% of GDP over the next 5 years.
This quantum of debt accumulation is associated with nominal GDP growth of 5.5%, with historical results at this level ranging from 4% to 6.3%.
The low end of this range will still produce above average GDP growth in the post-GFC period and is greater than 2% real GDP plus 2% inflation.
This conclusion means that one of these components (growth or inflation) must be above post-GFC norms.
Are we in a self-fulfilling cycle?
These results show that in the US, interest payments increase the total deficit and are likely to be stimulatory into the future. This effect partially accounts for the reason the Fed is hiking rates. As the Fed hikes more, the interest cost will continue to increase. Does this mean the cycle is self-fulling and self-supporting?
To an extent, yes. If interest costs continue to escalate, it will offset the contractionary effect of higher interest rates on the private sector, but only if higher rates don’t cause the private sector to increase its surplus, that is.
There comes a point however when high enough interest rates will not just put the private sector in a position where it is slowing, but one where it puts financial stability at risk. Poor profits are very different from outright defaults that can cause contagion. The small bank crisis was just one version of what could go wrong.
If a crisis like this occurs, then a forecast of a private sector de-leveraging of 0.5% is going to be very wrong. A credit contraction like that of the GFC will cause a recession without a doubt. Any contraction in the private sector of more than 2% of GDP per year is aligned with credit crises, and these causes recessions.
On the other hand, the small bank crisis did show that the Fed was willing to introduce new programmes to avoid the problems created by a move to higher interest rates, and there is no reason not to believe that will happen again in the future.
An against consensus view
I was surprised in writing this newsletter that I didn’t end up with a forecast that showed well below trend growth, in a potential “give back” of the above trend growth we’ve seen in the last few years. I thought the fiscal impulse wouldn’t be big enough to offset a de-leveraging private sector.
The numbers don’t show this. This is partially because interest costs to the government are heading above 3% of GDP, and this is now baked in as permanent stimulus if the other parts of the Federal budget don’t try to compensate (which they haven’t up until this point).
3% of GDP is a very large sum in persistent stimulus, and in this model presented is the equivalent of a 1% private sector deficit, a level that would itself be a bull-market indicator.
This might sound like good news for the US economy. However, I would argue this path is likely to keep inflation and thus interest rates high, which will continue to cause the private sector to try to de-lever in response. I wrote in the last newsletter that spiralling government debt was the private sectors choice – the upcoming period might be the first time the public sector is the “tail wagging the dog”.
Alternatively, a positive turn in private sector debt growth would cause nominal growth to explode, likely leading to results of nominal growth of 6%+. The Fed will have a real problem if this ends up occurring. The only solution in this environment would be for the primary deficit to contract significantly, although it is unclear in this political environment if that could happen.
More recent data seems to indicate a turnaround in private sector lending is possible. If this plays out, then the bullish outcome may be more likely for 2024.
In this case either the Fed abandons inflation targeting, or further interest rate rises will cause a small private sector surplus to turn into one that is big enough to derail the whole economy.
All of this is not to say that a recession is impossible. Far from it in fact, as more debt breeds an environment for more volatility. If that volatility is controlled however, heavy debt accumulation will drive higher average nominal growth. It has tended to do that in the past.
While external balances must net to zero across different countries, all sectors within a domestic economy can be in surplus, or deficit simultaneously.
This dataset has been cleaned of all reclassification events.
Using M2 or other monetary aggregates misses conversions of deposits to other deposit like investments (mutual and money market funds) which don’t always affect the provision of credit into an economy (which is what they are trying to measure in the first place).
This limitation doesn’t make the model useless, however. When trying to predict longer term trends, the relationships discovered are still useful.
Private debt being 3x more efficacious than public debt to GDP growth isn’t necessarily about every $ of allocation, it is just saying that when GDP swings either higher or lower, it is private debt that is mostly responsible for that.


Fantastic post! Just the information I was waiting for. I have a suggestion for another post: exploring the different methods of government financing and how they affect GDP. Thanks!
The private sector only owes interest to itself, so the mechanical effect of rising interest rates has a net zero effect. The contractionary effect comes from the unbalanced effect on consumption and investment from those that are paying interest; the effect on those parties is far greater than the effect on those receiving higher interest payments.
You mentioned that the person recieving interest has higher propensity to save, which I agree. But we know savings must either be consumed or invested, which then should boost GDP. Then why higher interest rates leads to a downturn?