
How does US growth slow with so much new debt?
Uncertainty won't overcome the deluge of new public and private debt

Given the recent moves in markets this post couldn’t be at a worse time! However, it’s worth noting that the first time I posted about this model and forecasted bullish US growth was at the worst of the 4th quarter 2023 equity drawdown (-10%, same as today) so it might be worth a consideration even with the extremely poor risk sentiment at the moment.
I’m thankful for wartime sized budget deficits in a way – they finally made everyone realise how much more powerful debt is over the tinkering central banks do.
Excess private debt has started and ended many an economic boom, but government debt is something else entirely (especially if the issuing country is a global superpower).
There is no apparent near-term cost to financing a humongous deficit when everyone wants to buy your financial assets. There is no annoying debt-to-EBITDA or LVR checks, no bank capital constraints. Everyone is incentivised to buy your debt, and issuing it buys you votes and keeps you in power.
We’ve had a change in power, though. The tactic of raiding the crown jewels of to buy yourself another 4 years in control hasn’t seemed to work this time, in effect giving a mandate to Trump to get the spending down.
The loss by the incumbent didn’t seem to slow anything down though. The post-election deficit is actually up on the comparison to the last 3 years, allowing us to consider that the absolute size of the deficit had very little to do with incentives around the election. I find this very interesting.
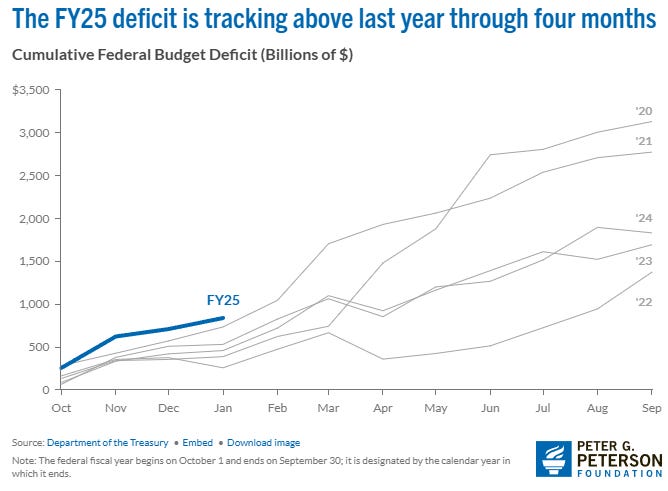
While initial accounting suggested that the annualised deficit is closer to $2.5trn, technicalities related to calendar adjustments and delays due to the Californian wildfires make the true number less dramatic. Despite this, at this pace the deficit will be larger than last years which clocked in at $1.83trn, 8% more than 2023 and equating to 6.4% of GDP.
This newsletter is updating one of my most read pieces attempted to quantify the stimulatory effect of both public and private deficits which are debt funded. It’s time to update those forecasts with the data of the last 18 months.

The short of that newsletter is that new debt emerging from both public and private deficits increase GDP growth and do so until that excess spending is decreased. Increases in private sector credit have more of an effect on GDP growth than a public deficit does - to the tune of a multiple of 3 - in that private sector debt accretion is 3 times more stimulatory to nominal GDP growth than public debt. If you are a free markets person, this should be music to your ears.
The piece, published in late 2023, predicted nominal GDP growth of 5.5% for 2024 on total new debt creation of 6.0% of GDP.
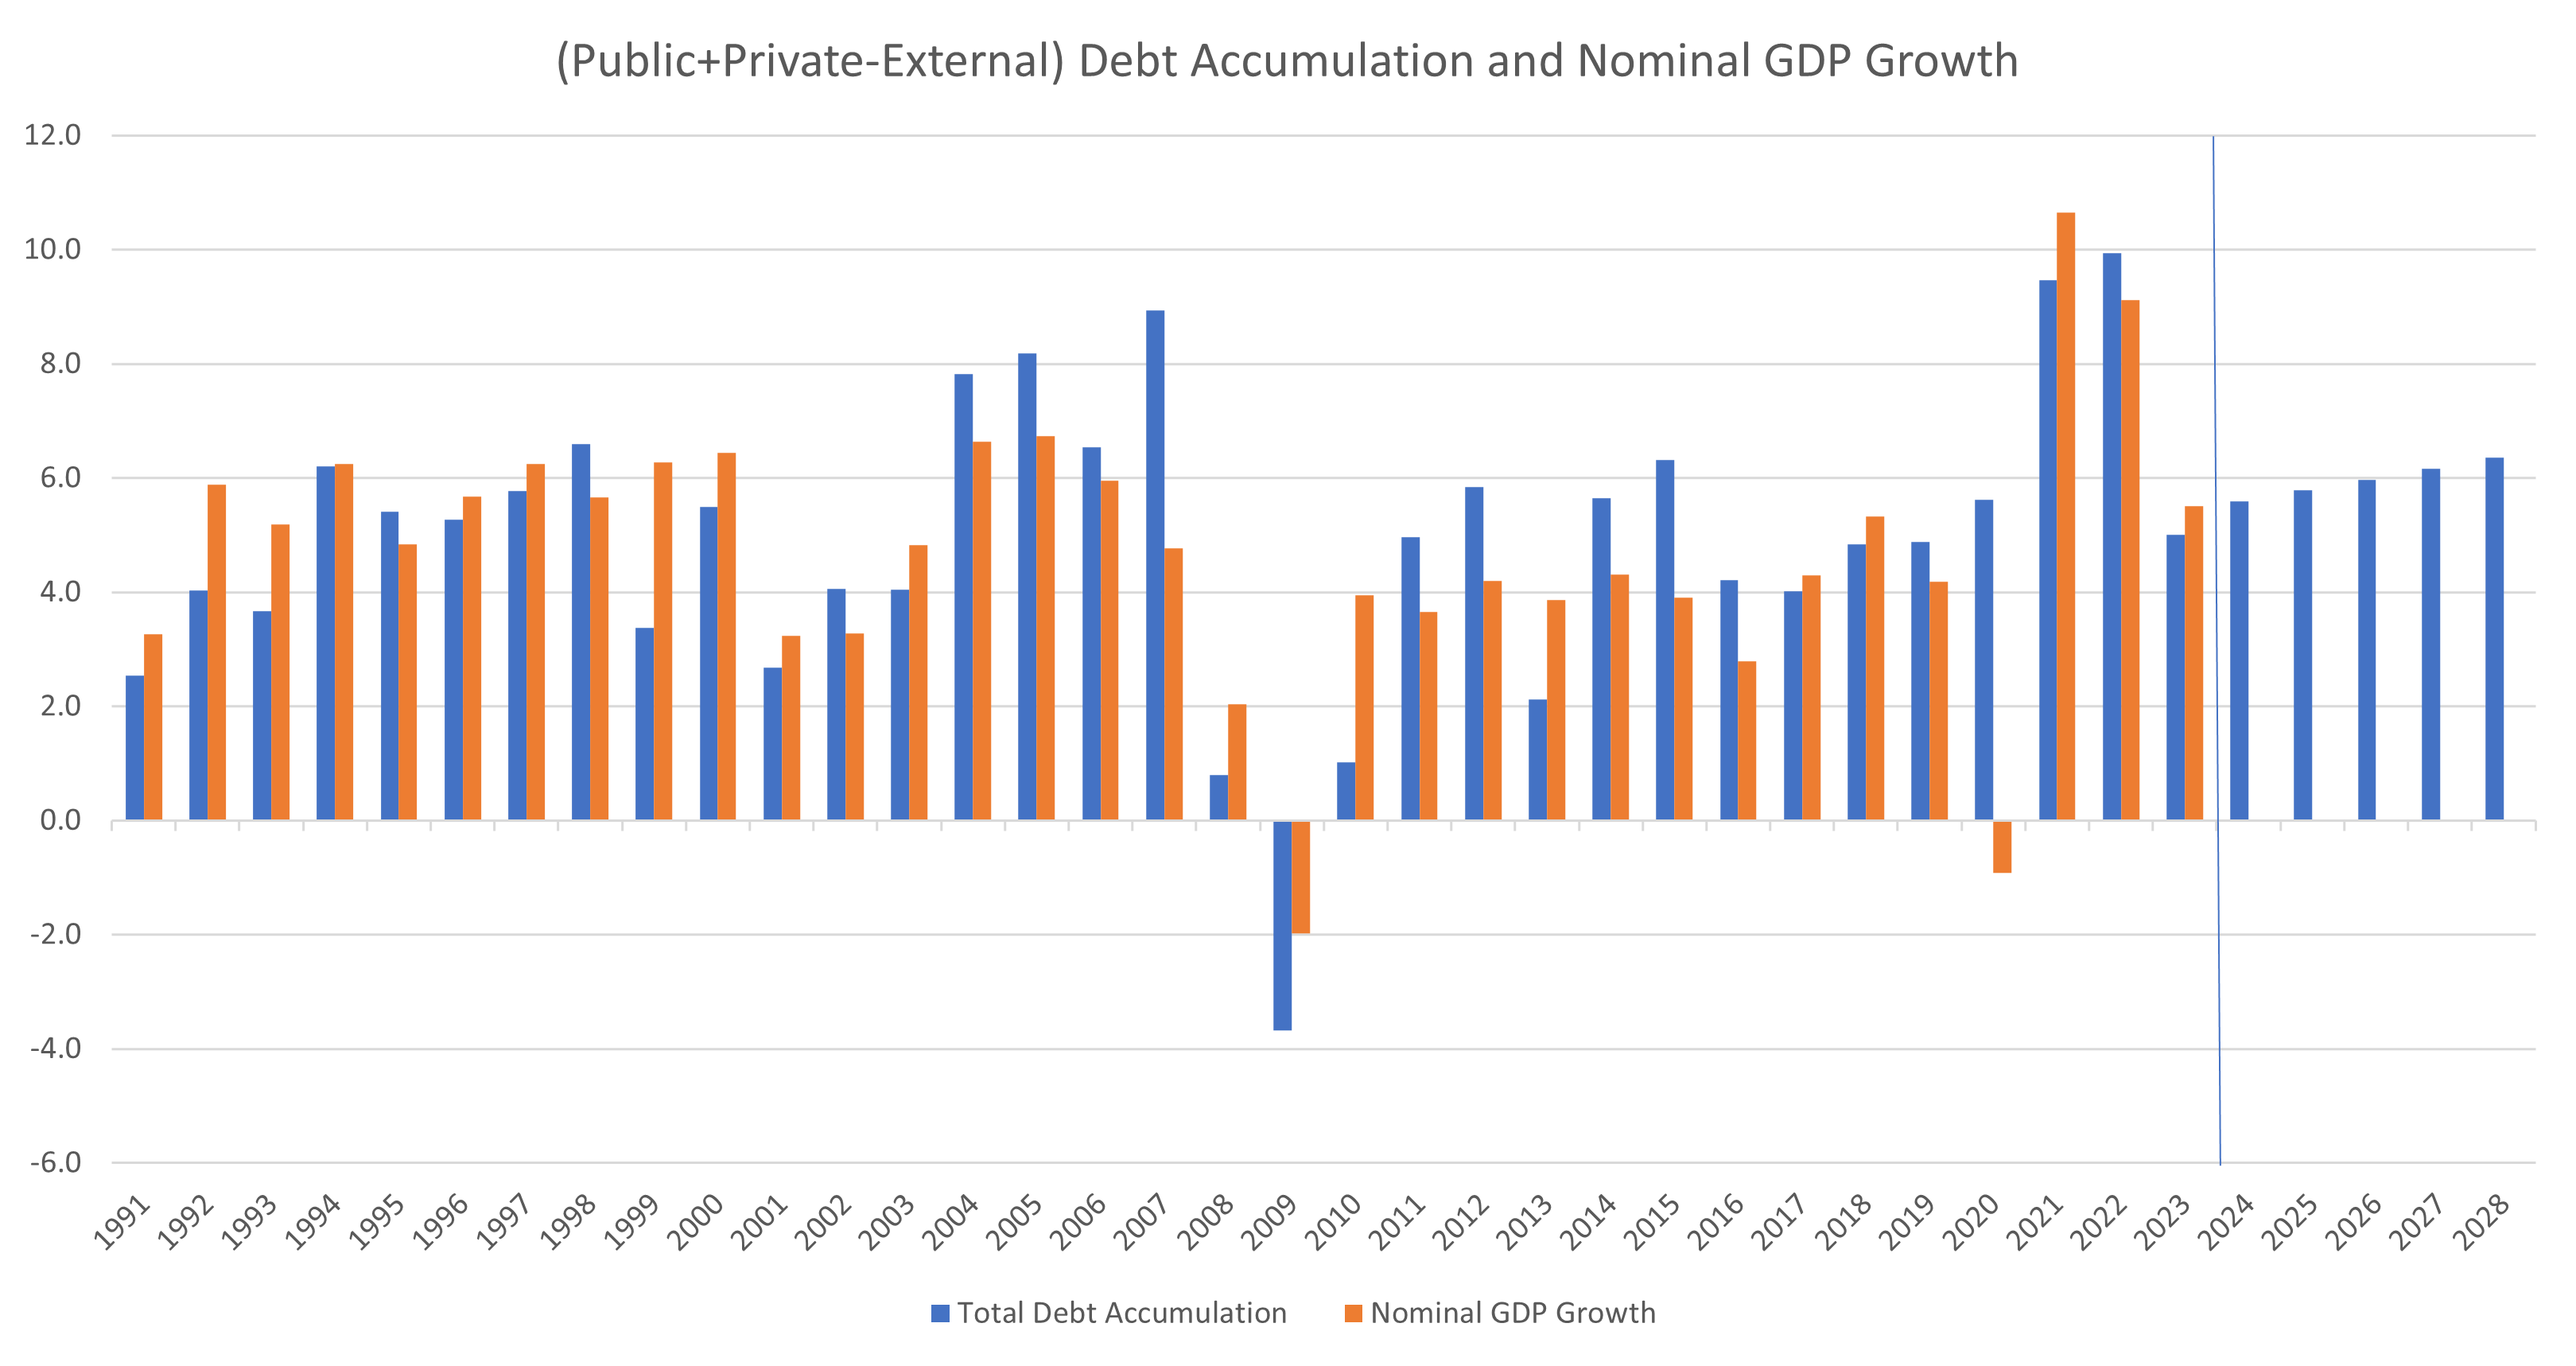
The eventual result? Nominal growth was 5.1% on total new (weighted) debt creation of 4.9%. Given that the calls for “recession” were very strong in 2023, this is quite a result.
The most important part was that the miss on debt creation wasn’t from the public side of the ledger – it was from private. Private sector credit underperformed even my poor expectations, with an extended period of lacklustre credit growth prompting the Treasury Secretary to make the claim that “we must swap economic growth from the government to the private sector”.

He may have spoken too soon. 2025 has seen the start of private sector credit growth rebounding. Whatever supressed the private sector during 2024 has lifted itself in 2025.
Reviewing 2024 – more government, less everything else
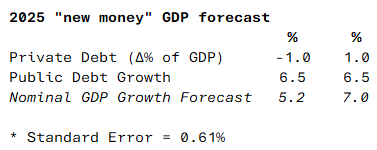
The total federal government deficit fell only marginally short of the forecasts of the OMB for 2024 (which were in my model). They projected a deficit 6.5% against an eventual outcome of 6.4%, resulting in marginal error to my forecasts.
What likely dragged down US nominal GDP growth versus the forecast was the poor result from private borrowing.
The total stock of private debt as a proportion of GDP decreased by 1.8% for 2024, well below my forecast of a 0.5% fall.
A contraction in private debt as a % of GDP is to be expected when the government budget deficit is as big as it is. Since the nominal size of the economy is expected to inflate directly from the size of the budget deficit, private debt will struggle to maintain the same size relative to GDP as the denominator expands.
I thought I had already taken this into account by forecasting a further fall in the importance of private debt in the economy, however it turned out that I heavily underestimated the lack of growth in private credit. From September 2023 (the last data point before the publication of the last article) and December 2024, private debt has only grown 2.8% against the nominal economy which has grown by about 6-7%.
The chart above shows that the 2nd half of 2023 saw a freeze in the growth of the stock of private sector credit, offsetting the better growth of 2022.
This sort of stasis in private sector credit growth is rare, only persisting for a significant amount of time (unsurprisingly) after the GFC.
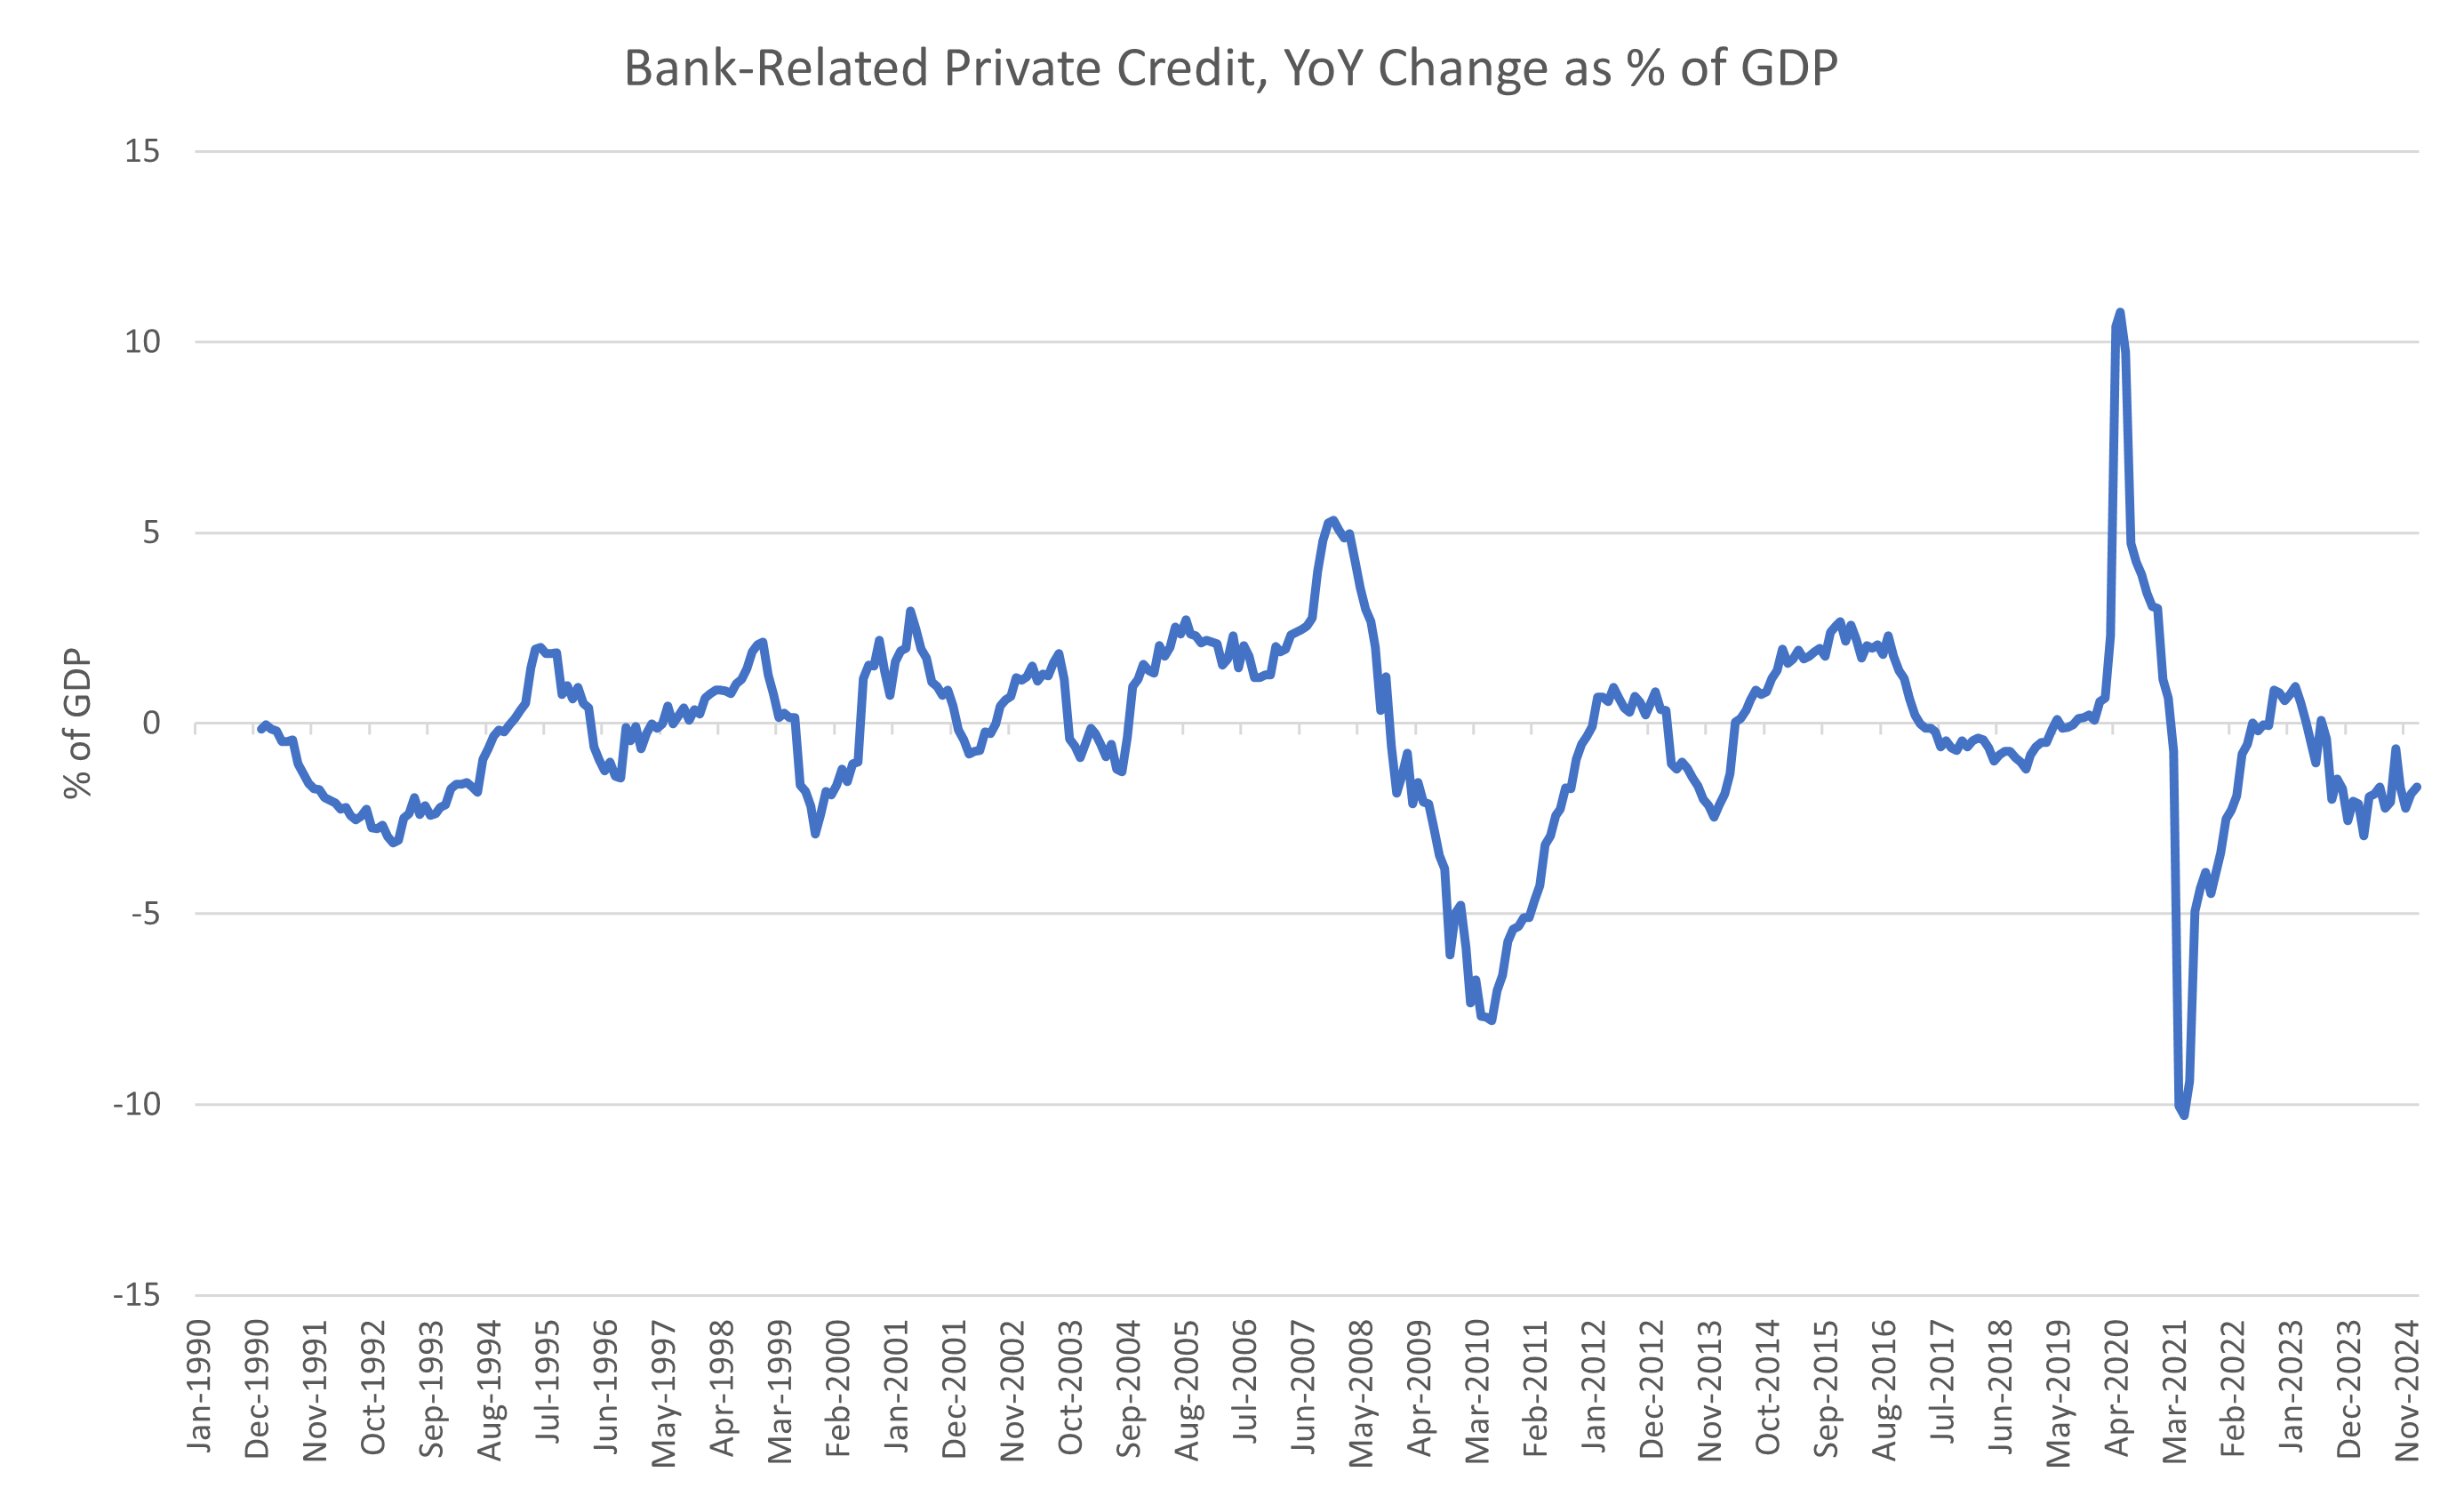
When expressing the stock of private sector debt as a percentage of GDP, the recent episode of contraction is as big as that of recessionary episodes in the past, with the difference this time being the immense public debt that expanded GDP instead.
Growth did resume in 2024, albeit at a slower pace than the pace that prevailed for most of the 2010s. While investment seems to be progressing along well enough, it isn’t being enabled by an increase in private sector credit.
The higher multiple attached to private sector credit growth means that with the revised figures growth forecasts were dropped, but nominal GDP growth still outperformed expectations (or perhaps the government multiplier is a little higher than estimated).
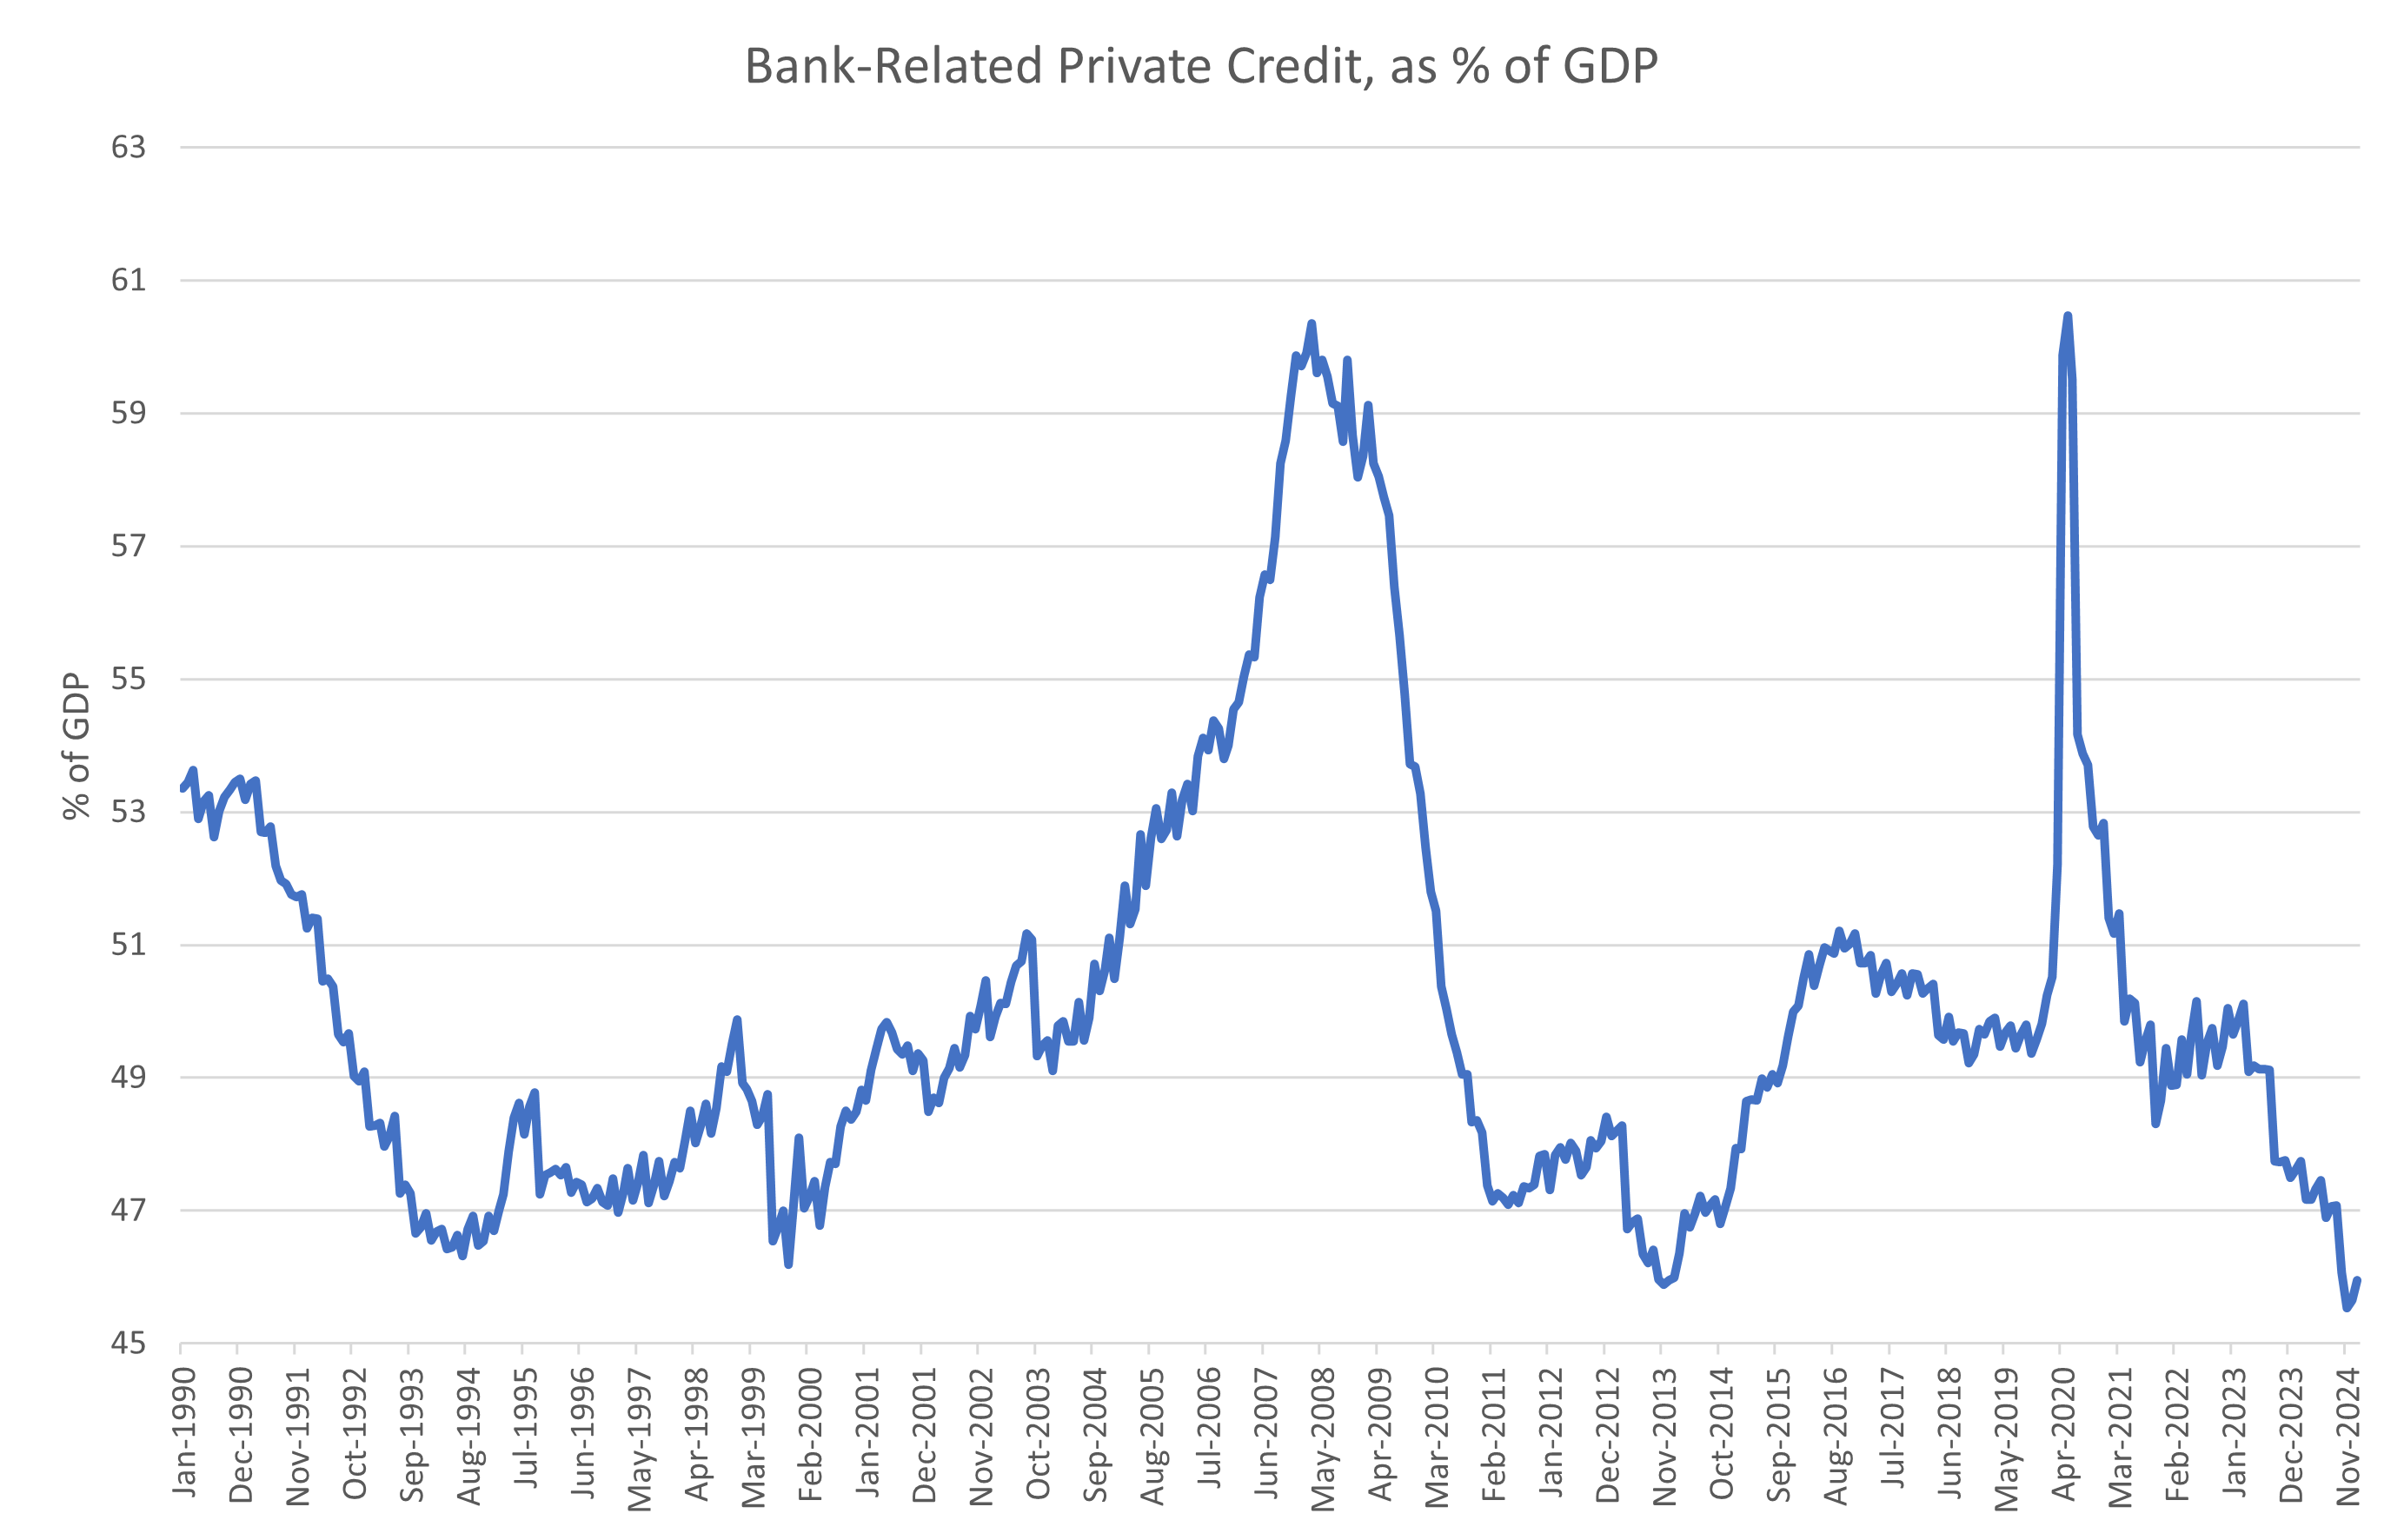
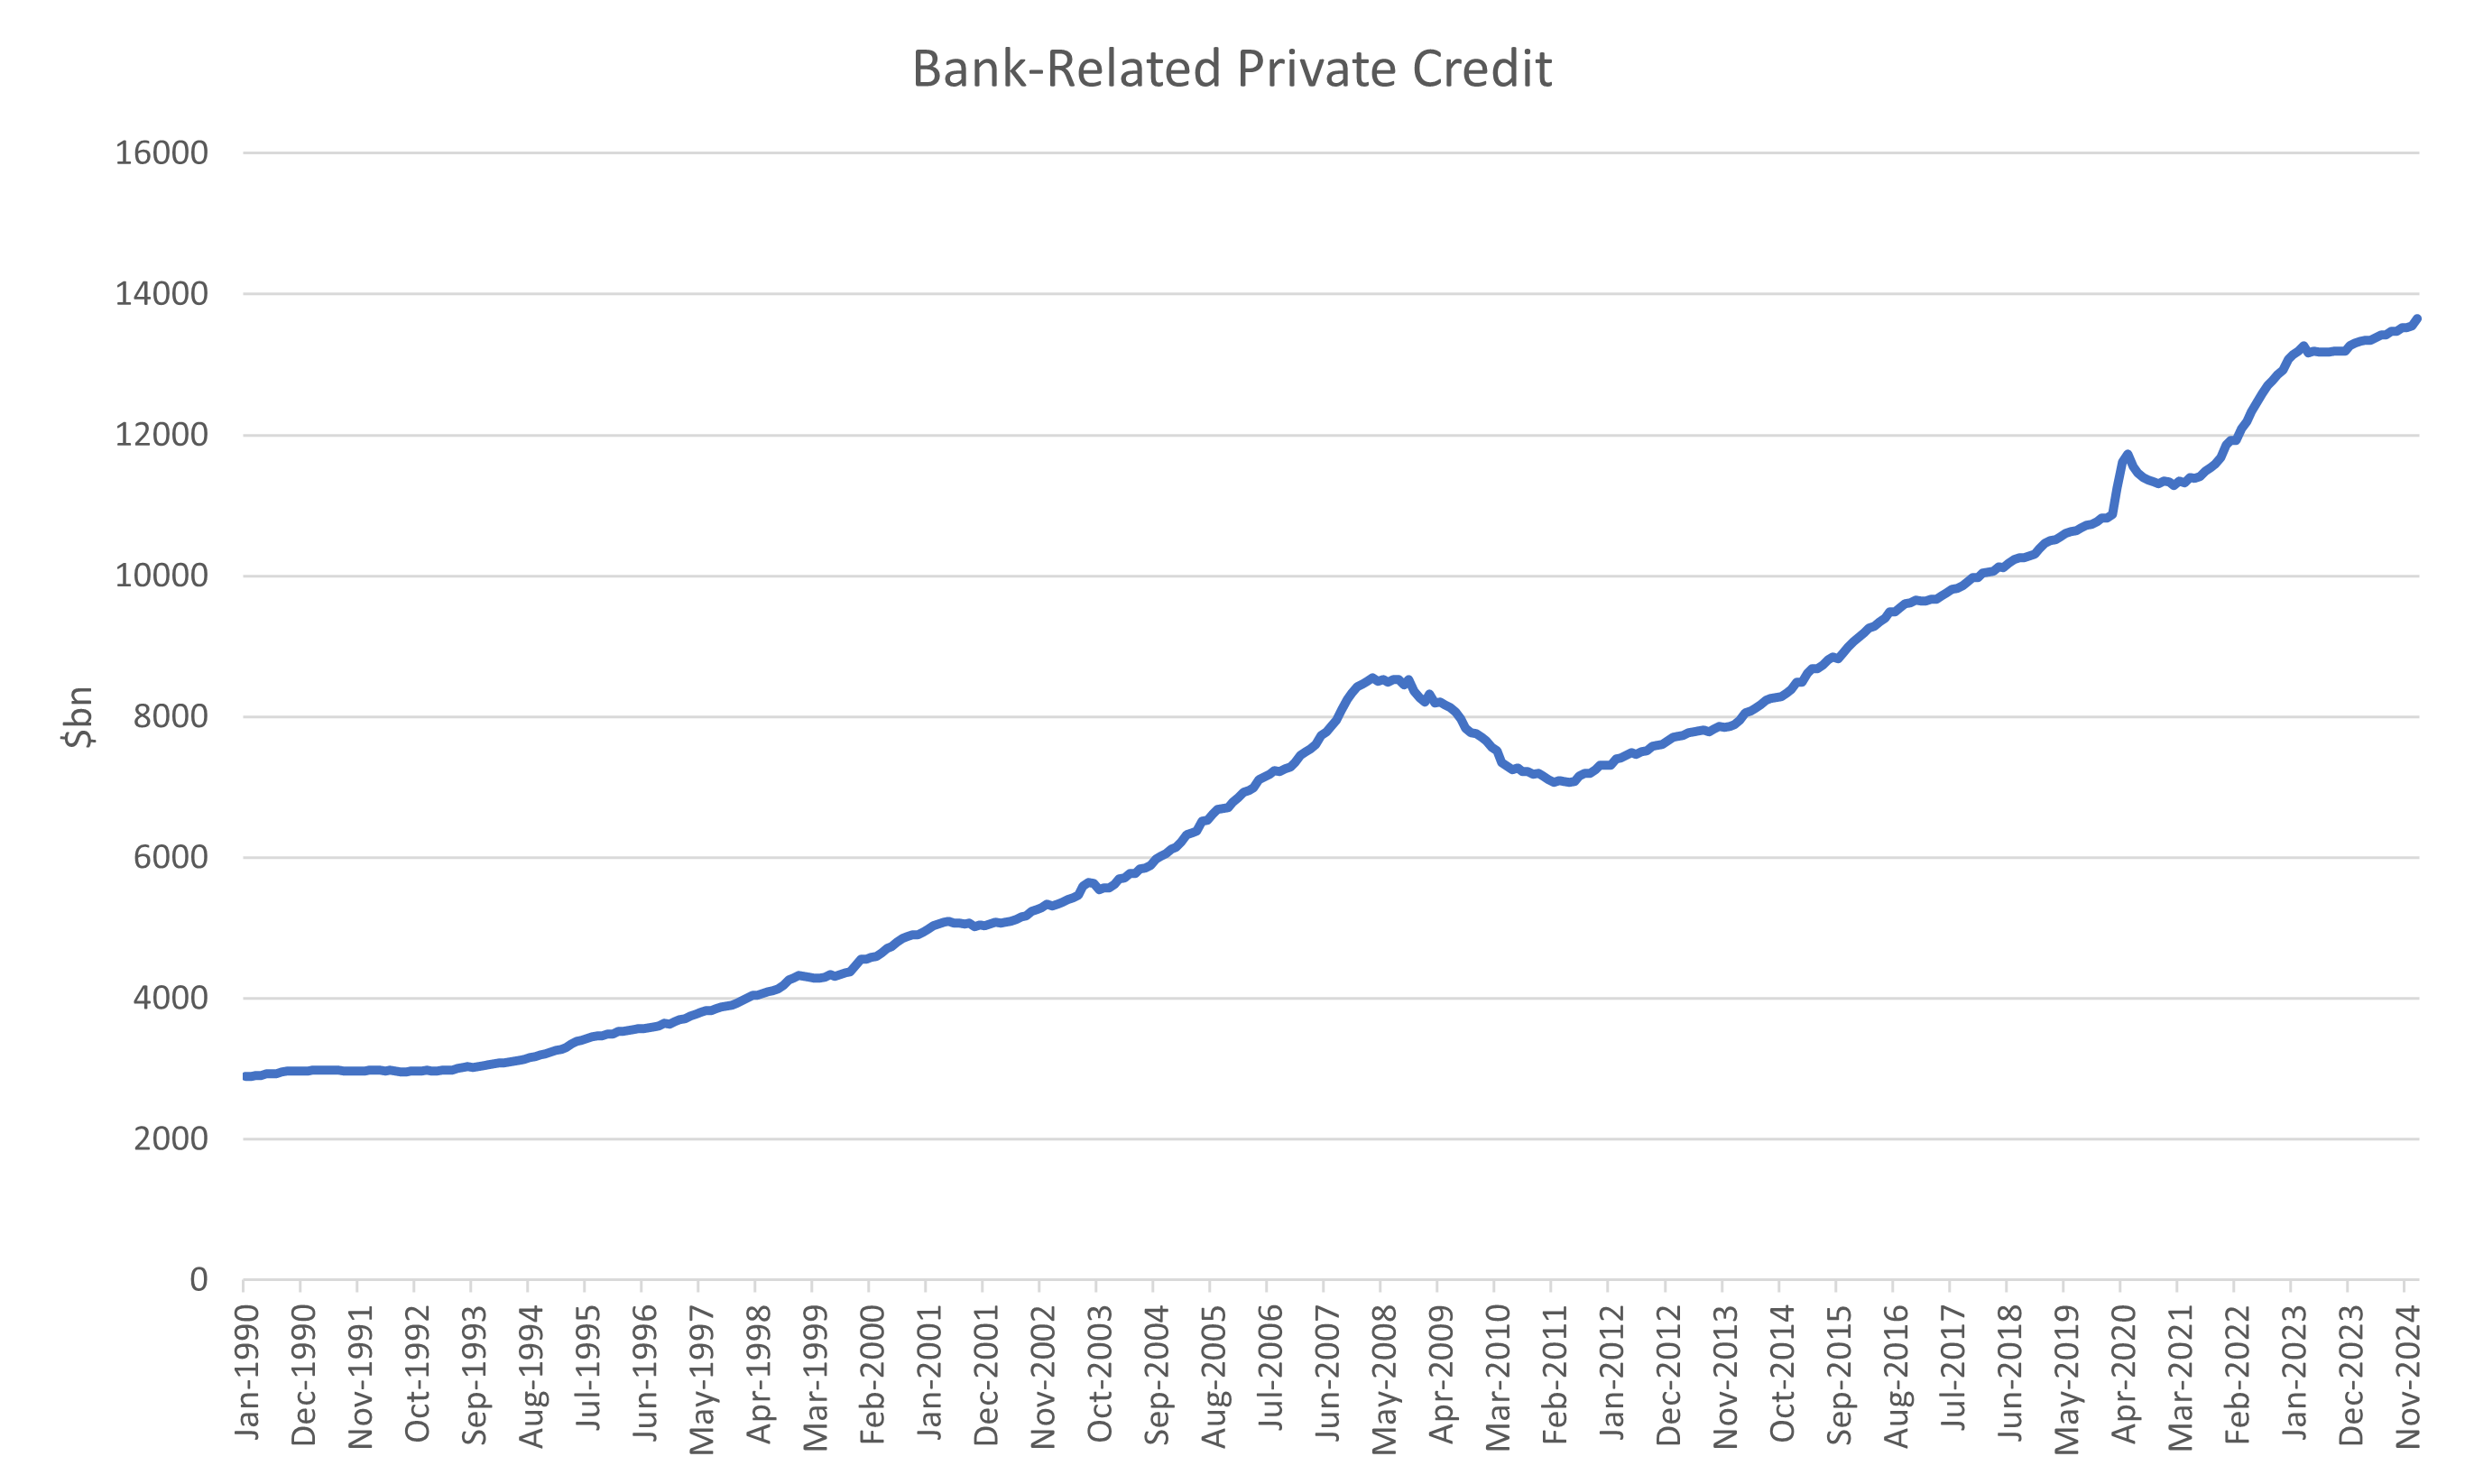
The last 18 months has seen the proportion of GDP of bank-related private credit to drop to historical lows. Apart from the pandemic induced rush to draw on lines of credit, the intensity of private sector credit in the economy has been falling ever since the government started increasing the deficit in 2016 and has accelerated as budget deficits have ballooned.
I do not believe that government borrowing “crowds out” private sector borrowing (more on this later). The banking sector has more than enough resource to accommodate lending to both and has shown its intention to lend by loosening standards since mid-2023. This effect is part mechanical due to the effect of nominal GDP growth being driven by government debt instead of private sector credit. The opposite would occur in a private sector credit driven expansion.
The chart above tracks the Federal Reserve’s senior loan officer’s survey (SLOOS) inverted against the growth rate in my bank-related credit metric that’s used in the model, but leading by 12 months. Essentially, a loosening in the SLOOS (credit standards are being loosened, or the blue line turning up) predicts an increase in bank credit growth.
When lined up with private sector credit growth, a rebound did occur. The issue is that nominal GDP growth has grown as such a pace that the rebound just hasn’t been big enough to contribute at all.
According to the correlation above a full rebound will only take growth to about 7%, barely above the current 5% nominal GDP growth rate. Government debt may not crowd out private but instead makes it less relevant.
I highlighted Scott Bessent’s comment in the introduction. The data over the last 18 months suggests he was right, but I think that might be changing rapidly. When I apply my shorter term “new money” model of debt creation, we could be at the start of a surge in private sector credit.
Tracking “new money”
Using the findings from the longer-term growth model we can use data that is updated from various sources to estimate the monthly growth in both public and private debt and estimate its relationship with equities.
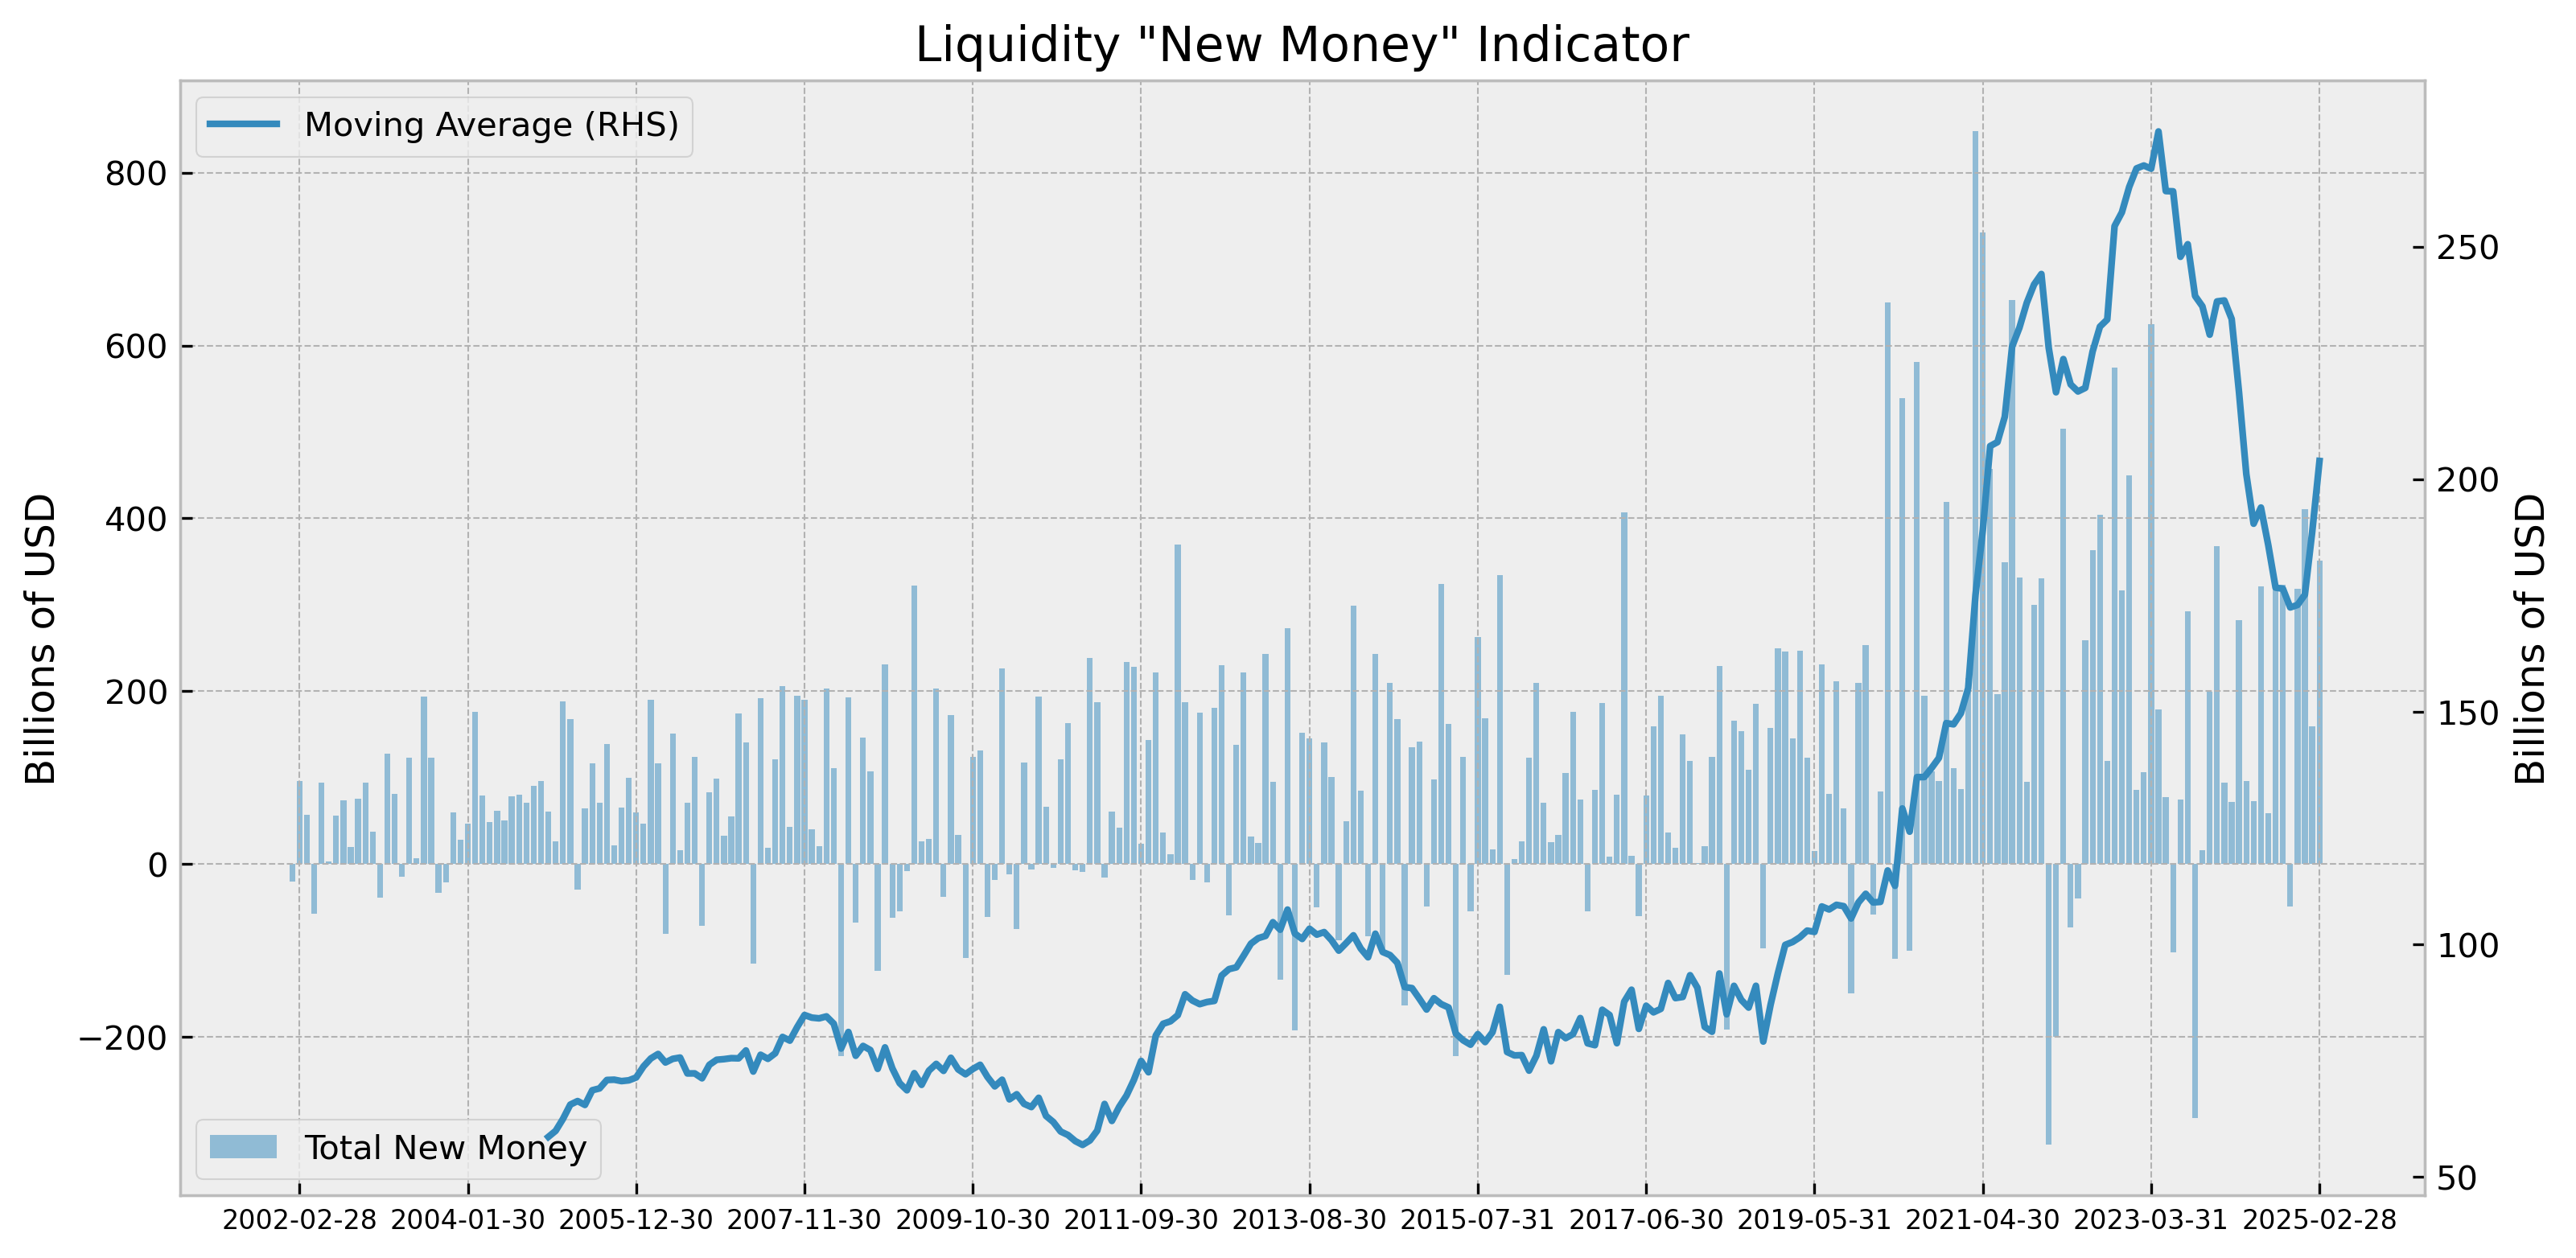
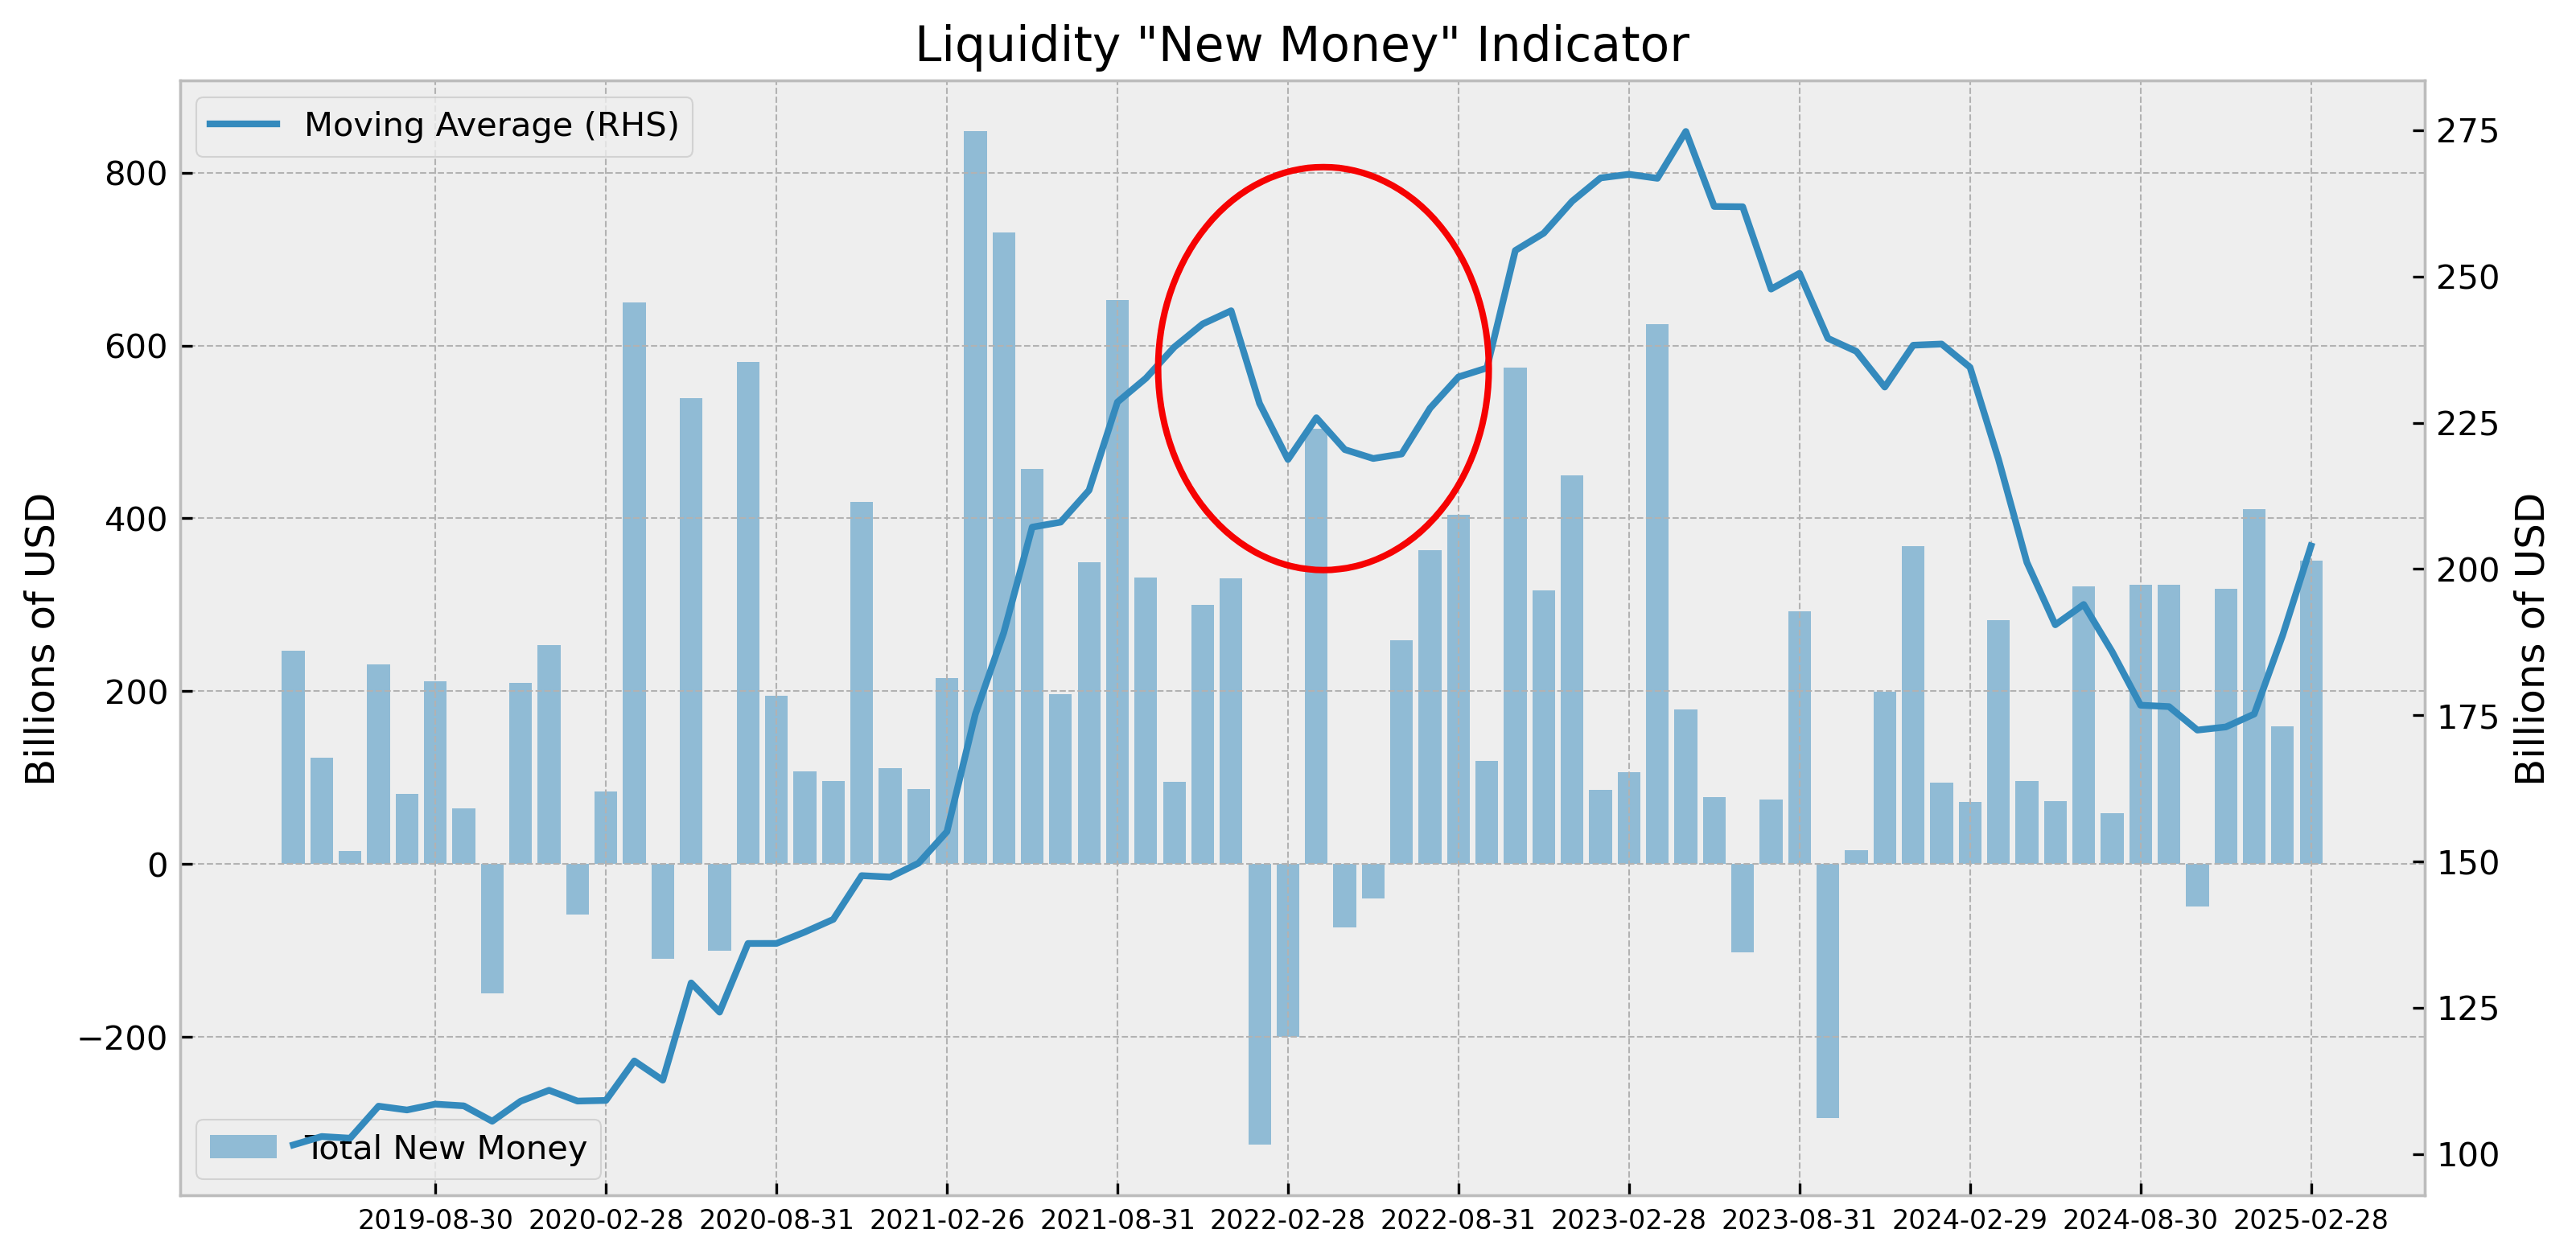
First thing to notice is the upturn in the moving average of total new debt creation. It has swung up above $200bn a month again, somewhat due to slower months rolling off the average, but more recently due to two other factors.
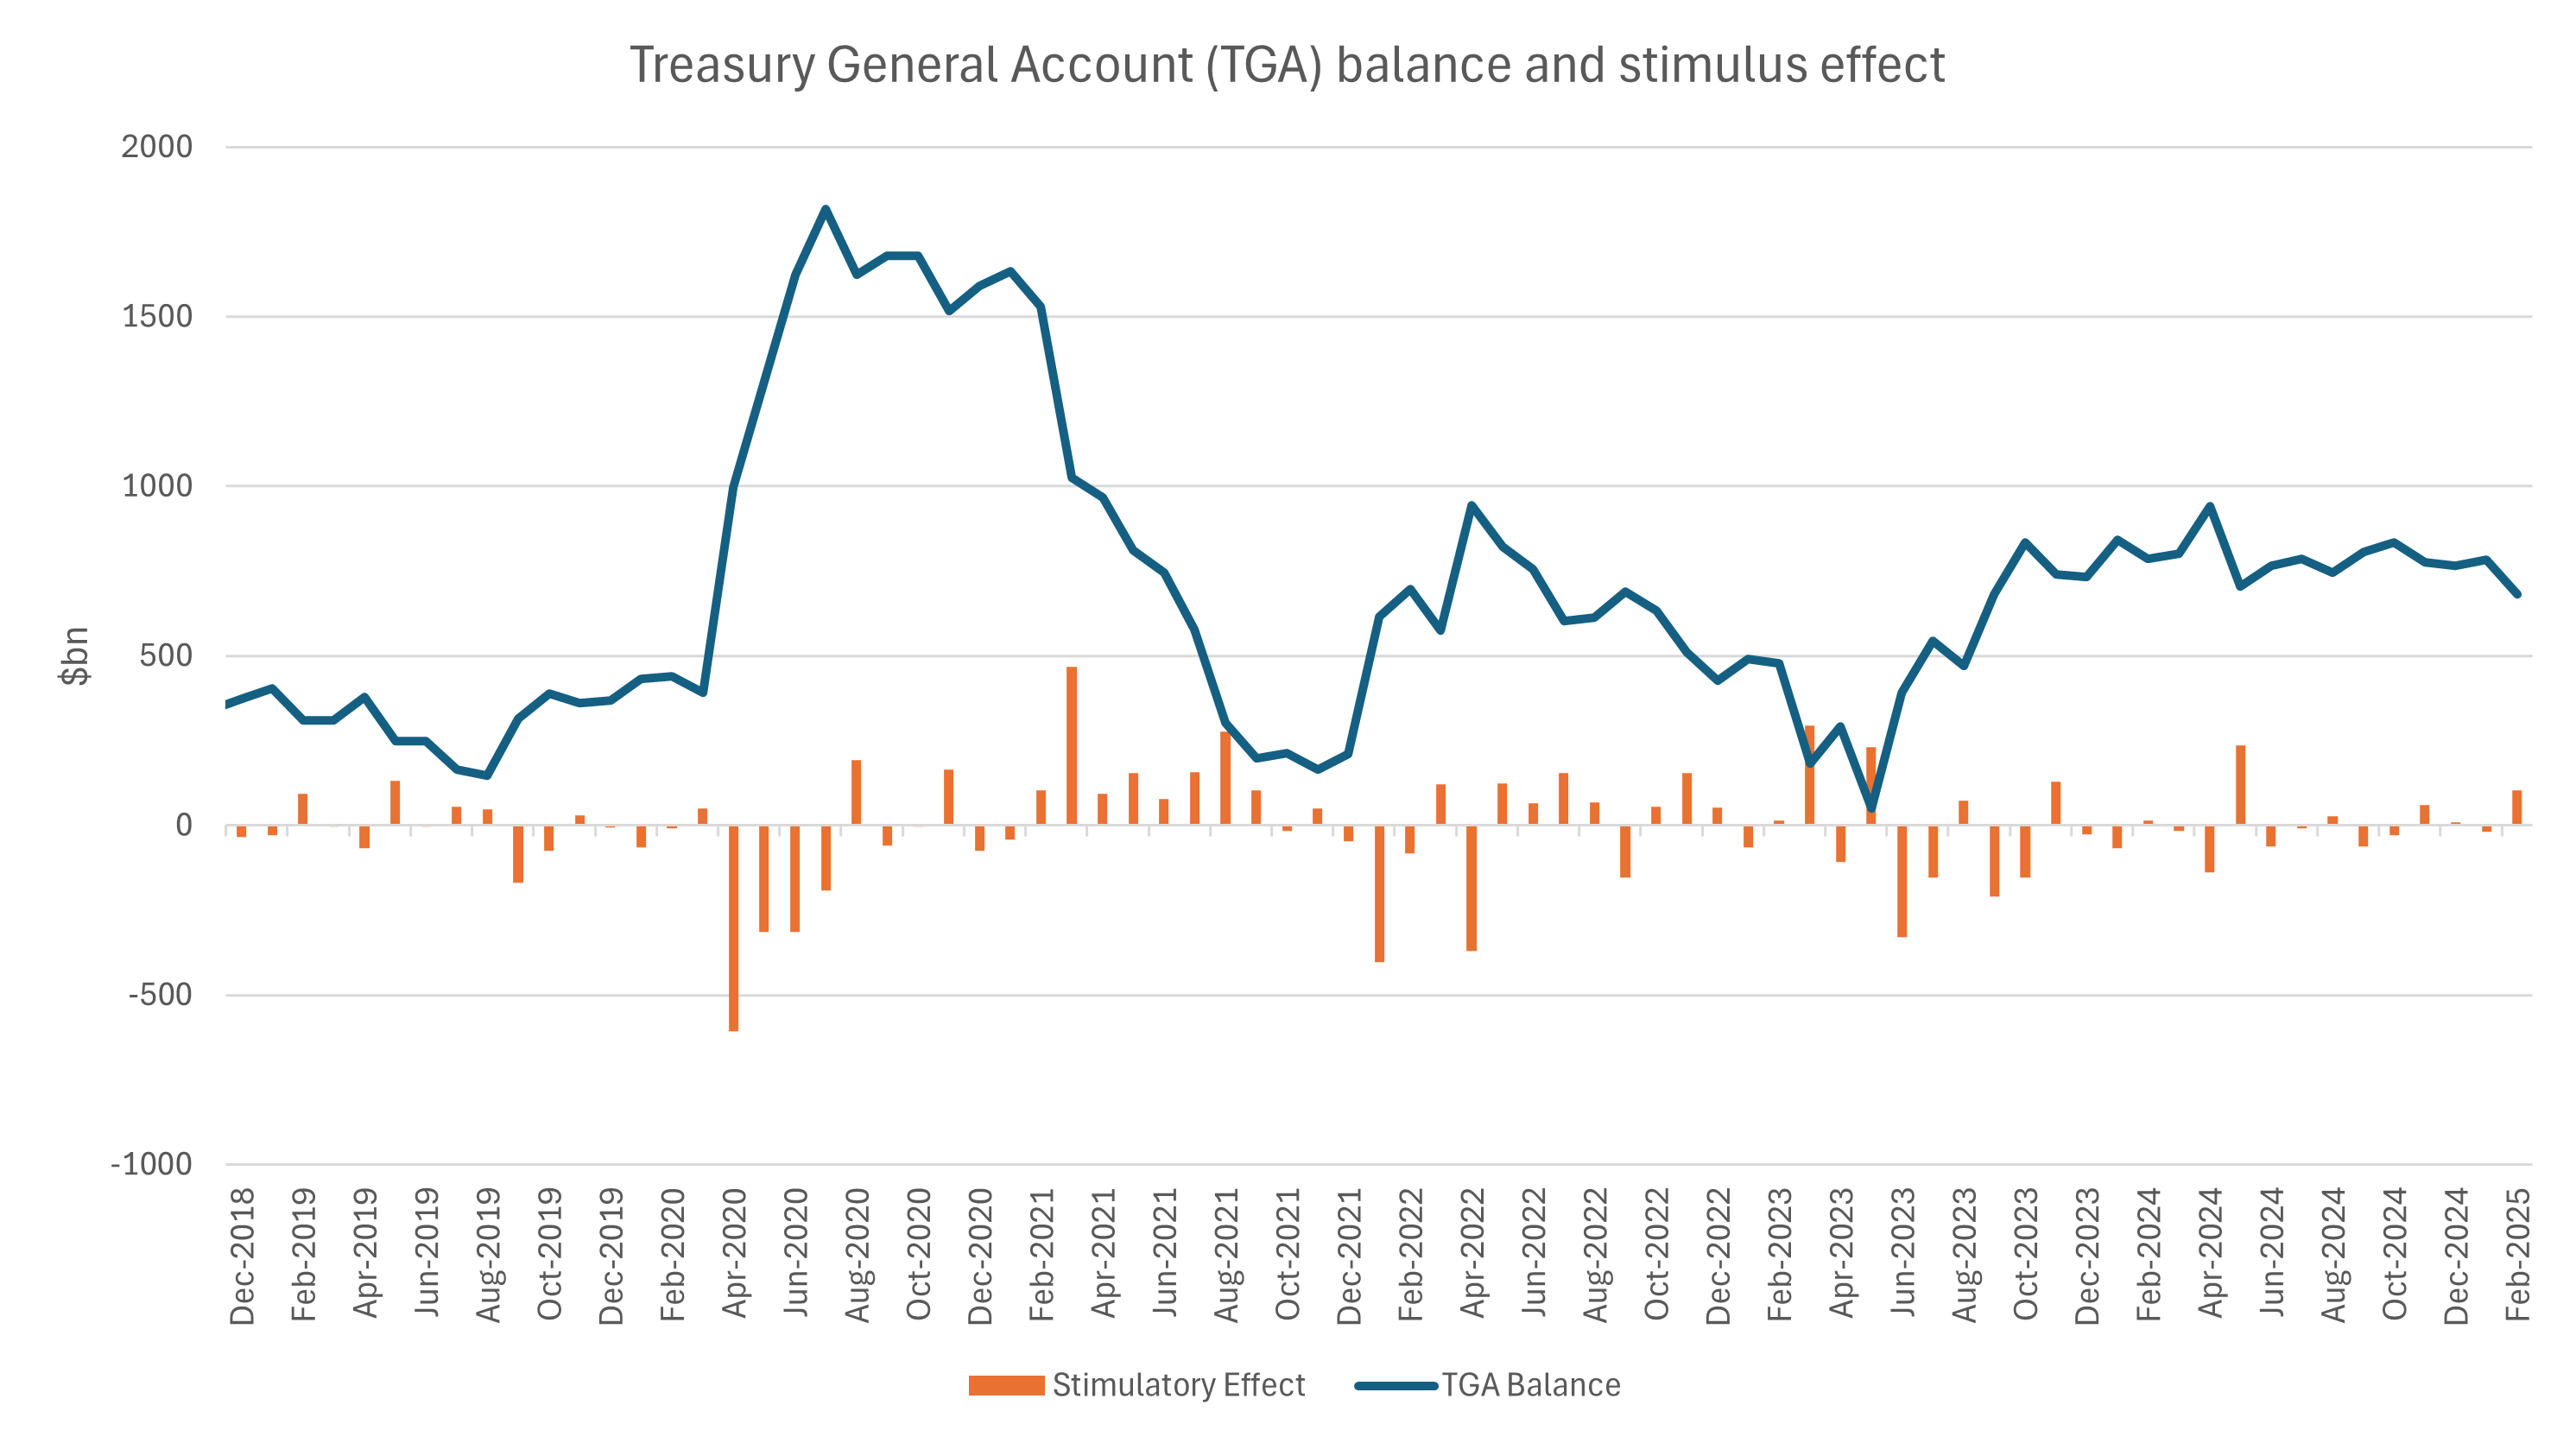
The first is the run down in the Treasury General Account (TGA). The TGA, or the government’s saving account at the Fed, is increased when debt is issued in preparation for spending. The model only counts “new money” as that which is spent from the TGA because it is at that point it enters the economy. This has started to happen as the extraordinary measures to put off the effect of the debt ceiling run out. This is happening in conjunction with the continuation of a large budget deficit as charted earlier.
The second effect is related to private sector credit growth and is much more meaningful. The chart below presents an estimate of bank loan creation and is turning up after a period of more than a year of hardly any growth at all.
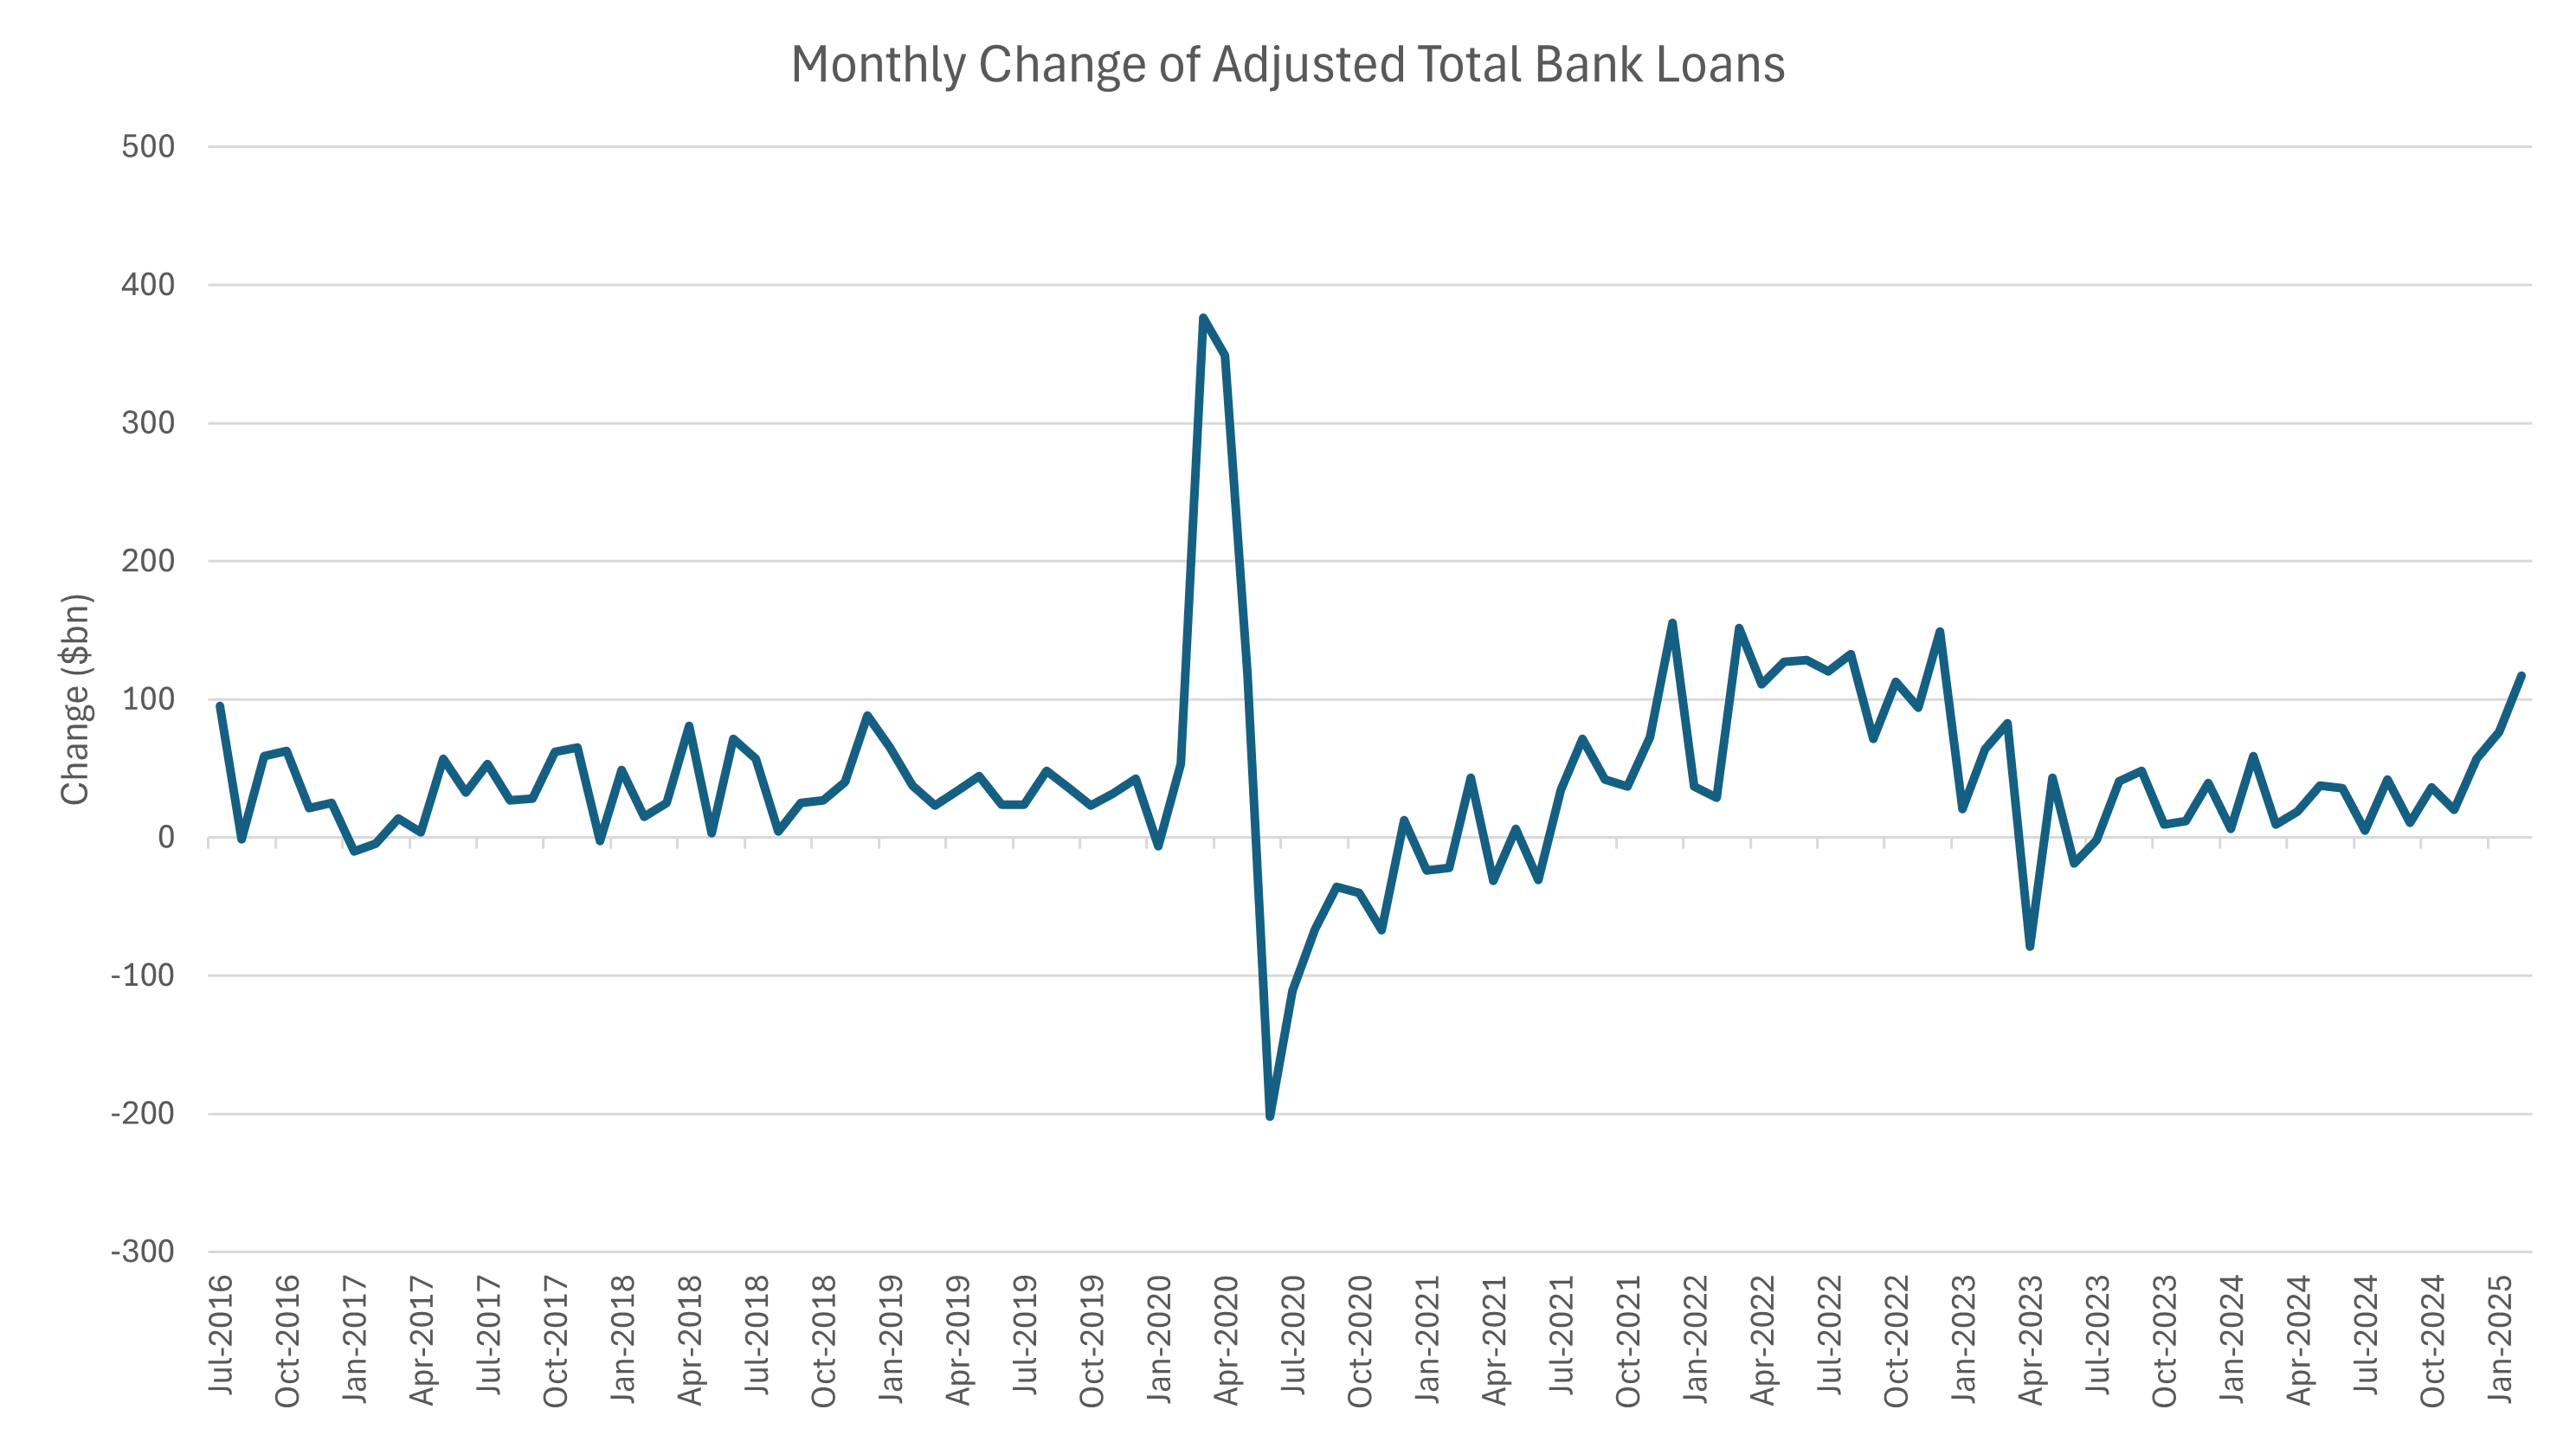
Taking a closer look at this series clearly shows the acceleration. The last time we saw this acceleration was during the equity market bull-run of late 2021. 2022 continued this growth (admittedly after a first quarter stumble) with the pull-back in public debt (and the Fed hiking rates aggressively) causing equity market drawdowns.
The growth has been driven across several different lending segments, with consumer being the smallest contributor to the expansion in bank credit. Real estate and commercial lending shared the burden.
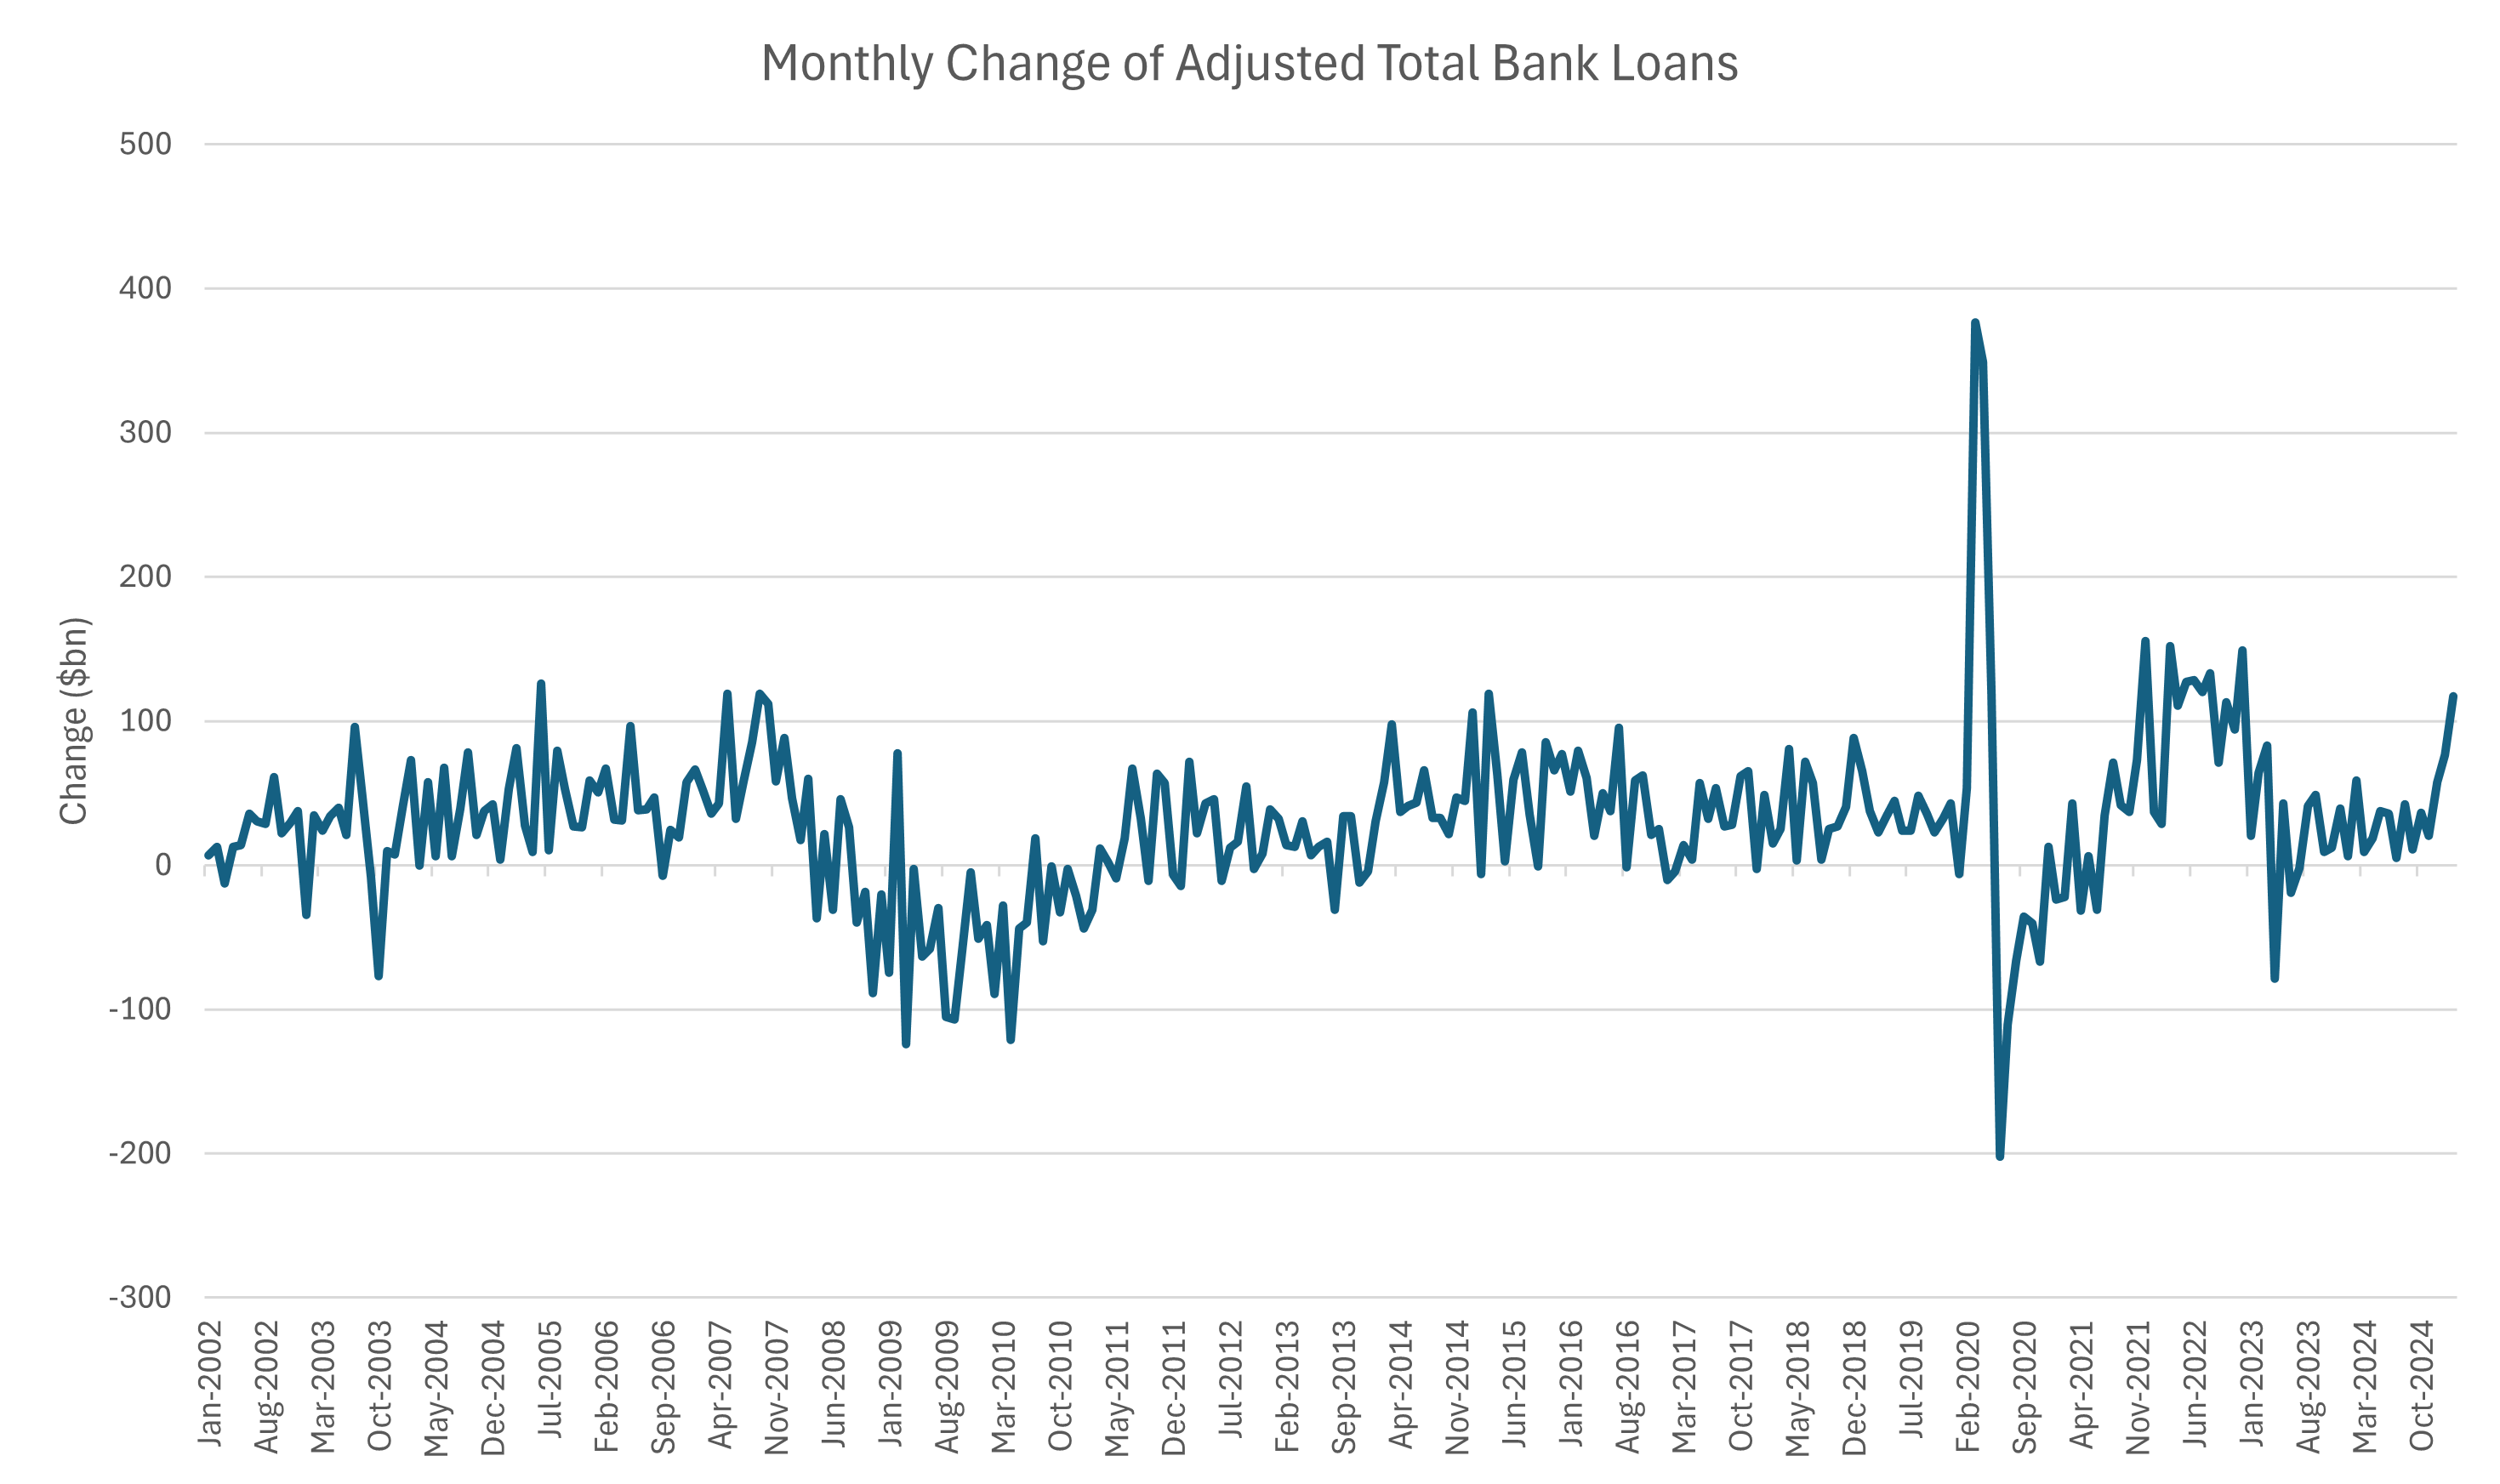
A longer-term chart shows the significance of this acceleration a little more clearly.
While it’s easy to get lost in the volatility of markets that are driven by short-term sentiment and uncertainty, this is a very hard measure of an increase in confidence in the private sector, driven by a desire to expand.
Some of this increase in demand for bank financing could be from pent-up demand of the last few years. This shouldn’t reduce the significance, however. With such a strong multiplier from the expansion in private debt it is very hard to be negative on US growth.
If you are negative on growth, I would urge you to reconsider.
What about DOGE?
There are a lot of big numbers being thrown about in terms of the effectiveness of DOGE and Trump’s strong desire to get the budget balanced.

The chance of this actually occurring is zero, of course. At least it is directionally correct and somewhat consistent though – if Trump wants to balance trade of the US with the rest of the world, it is a necessity to reduce what the US trades in return for those goods and services (financial securities).
A reduction in the trade deficit would be met with the less debt accumulation, and it doesn’t really matter in which direction you stress the relationship between the two. You can reduce spending to cut imports or increase exports to stop inbound financial flows.
The question, as always, is whether any sustained downward pressure on the budget deficit can be tolerated regarding the effect it has to slowdown the economy.
With credit expanding in the private sector some deficit consolidation could be achieved without a disruption in nominal GDP growth; however, we do have a recent precedent to measure by.
The almost recession of 2022
Real GDP growth stalled in the first two quarters of 2022. If the deficit was still large from post-COVID expansion, then why did the economy hit a road bump?
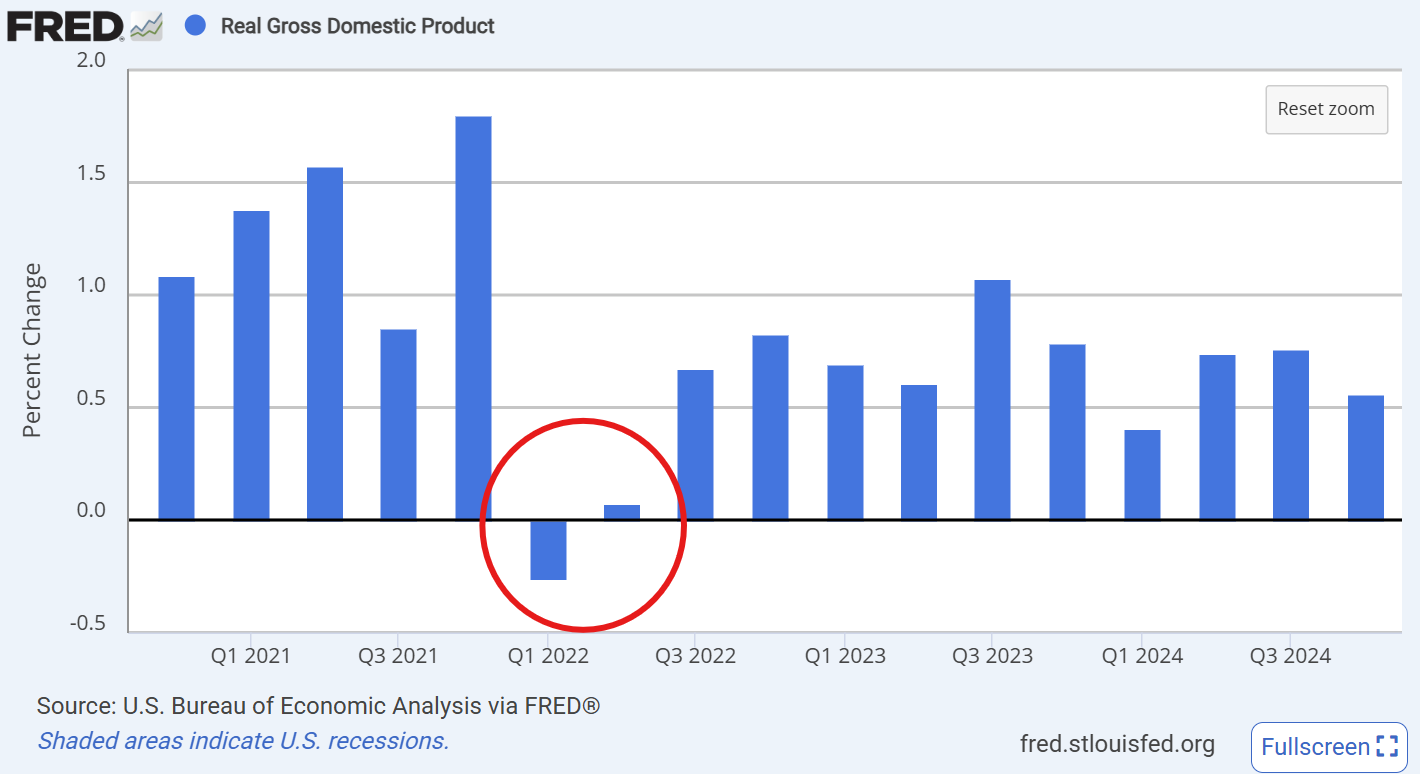
There was a road bump for the first few months of 2022 as a result of a sharp pullback in the amount of new debt being created in the economy.
Several things happened at once. There was consolidation in the size of the budget deficit at the same time the TGA was being rebuilt. This was “new money” negative, withdrawing the effect of debt driven expansion to the economy. Bank loan growth also ceased during those 2 months, possibly as an effect of very volatile public equity markets and a stark roll-over in US Tech earnings at the time.
These two effects pulled back average “new money” growth and put broader economic growth under pressure.
By the 2nd quarter both public and private were back adding to debt growth, pulling the economy out of its lull and back to posting >5% nominal GDP growth nearly every quarter after that. This is illustrated by the re-acceleration of the moving average measure in the chart above.
Compare this to today. With the engine of private debt growth starting up and a TGA being drawn down upon it will be difficult for jitters surrounding the new administration’s policy to slow US growth.
The sharp upturn in the moving average of “new money” creation is the ultimate story here and it shows the push of debt expansion hasn’t stopped giving a tail wind to growth and equities.
Does public sector debt crowd out private sector debt?
The question of whether the public sector borrowing can “crowd out” private sector borrowing is one that is, at worst, misguided or at best misunderstood.
The public sector can crowd out the private sector when it comes to land, labour or resources. This is a certainty and ignoring this will just result in inflation.
When people consider the statement these days, however, they consider the public sector crowding out the private sector in a financial sense. The question today seems to be more about public sector debt issuance being able to crowd out the ability for the private sector to be able to borrow.
The simple answer to this question is that the public sector doesn’t crowd out the private sector.
The banking system has the ability to expand itself for either type of borrowing, with the only limitation being the risk capital (otherwise known as risk-weighted assets, or RWA) assigned to the lending in each.
Risk capital can only be created via capital raises by the banks in either equity or equity-like debt markets, or via retained profits. These are the practical limitation for how much banks can lend. There are some other complications such as with the Supplemental Liquidity Ratio (SLR) that changes the formula between the ability for banks to take on public versus private risk, however this is very much at the edges and is more relevant to liquidity in the US Treasury market.

Ultimately there is no technical limit to both the public and private sector raising debt. The decision to raise debt may be influenced by constraints that exist in land, labour or other resources, but this is a different consideration all together.
My favourite example of the expansion in debt in both sectors is in the Chinese economy where the accumulation of debt hasn’t been impeded anywhere despite their lack of access to foreign markets to raise capital.
The business cycle is still dead
As it stands, I can’t credibly warn that the US government budget deficit will contract sufficiently to impact my debt-driven forecast of US growth over the next 2 years.
Trump’s ongoing comments about the deficit can’t be ignored, of course. Nor can Musk’s efforts in DOGE. But this is also politics; the attempt to do what they have promised is sometimes as important as actually doing it or finding out that delivering on what you promised isn’t feasible.
Without a huge possible delta in the budget deficit, the base for growth looks decent. The question will be whether the increase in private sector lending this year will persist for long enough to bounce the intensity of bank credit in the economy of those historic lows.
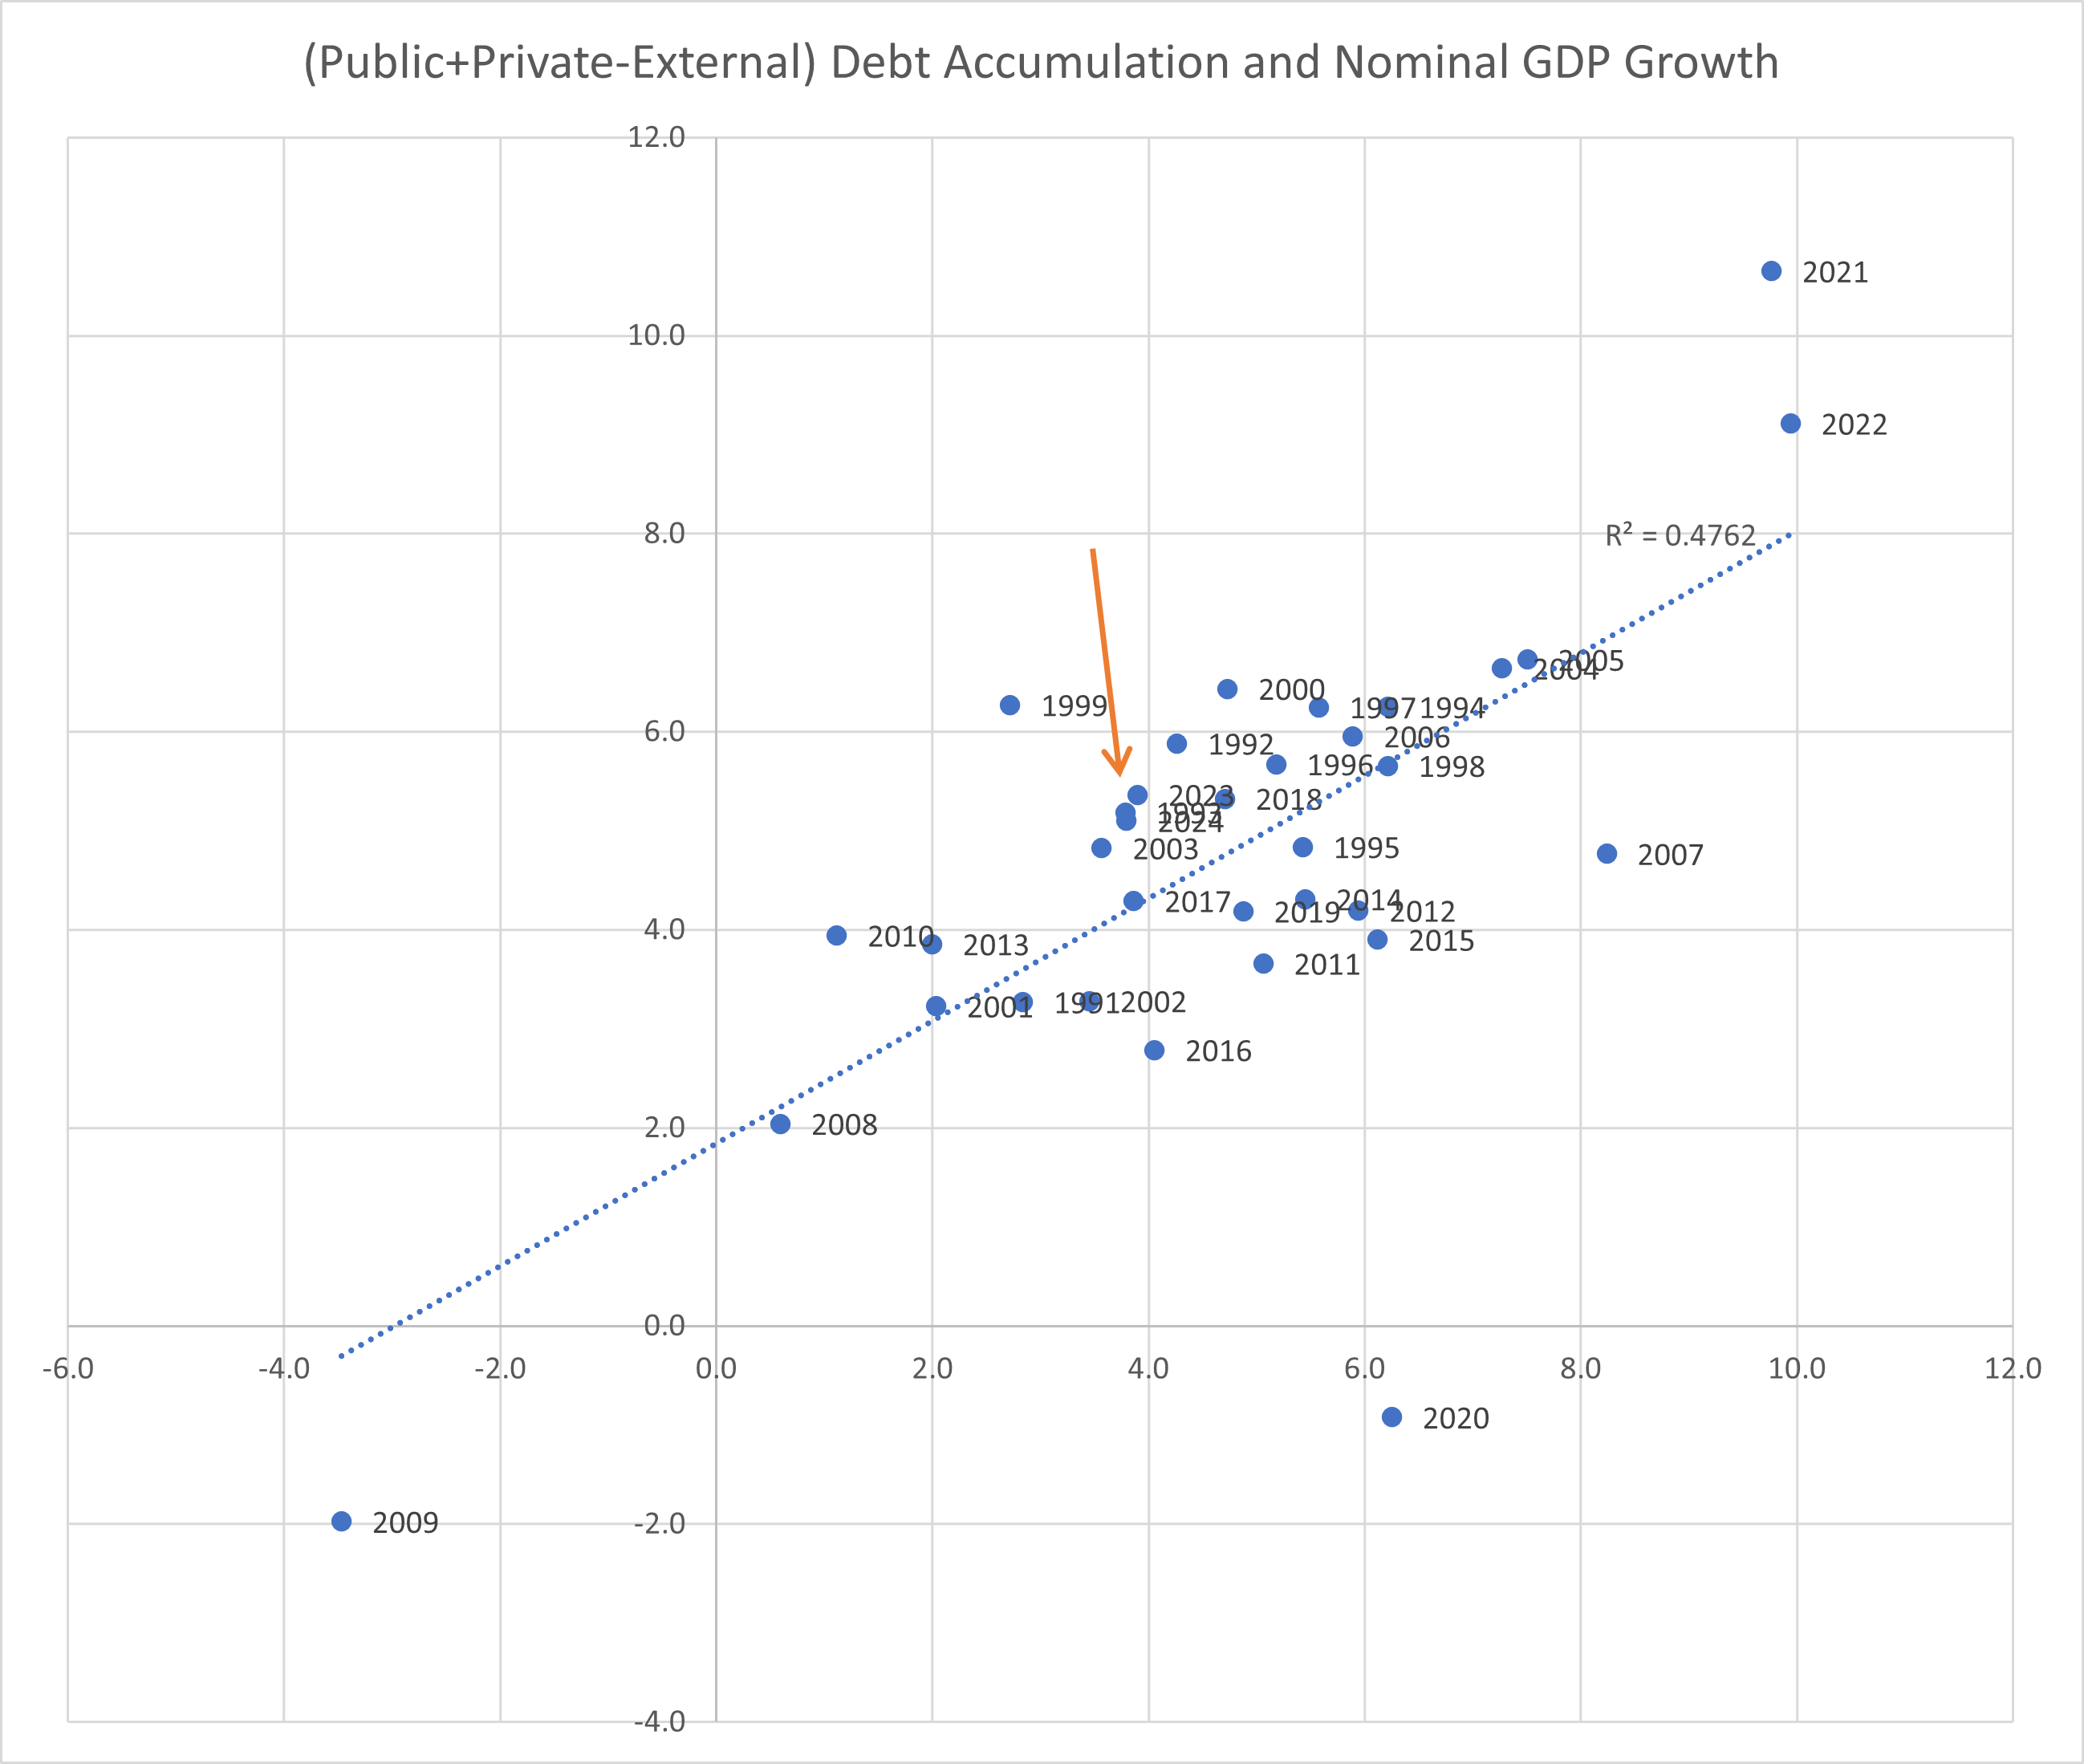
If the intensity of private sector debt in GDP expands (rather than contracts) by 1% per year the forecast for nominal GDP growth improves by 1.8% based on prior relationships (the model has a R² of 47%).
This shows how meaningful a contribution from the private sector adds up to. When debt is growing, nominal GDP is expanding. When that growth (and subsequent investment) is happening in the private sector the effect is so much greater.
The combined debt expansion will keep nominal growth high, which includes inflation. It will make the Fed’s job difficult to fulfil Trump’s wish of lower rates more difficult and will make the US yield curve steepen up again to where I strongly believe it should be.

If the government’s budget deficit does contract, then forecast growth will be lower. At this point it is unlikely because interest cost is still increasing, and congress has just extended the Tax Cuts for Jobs Act (TCJA) with a questionable way of funding it. If something changes then I will have to renew my forecast. Until then it still stands at above 5%.
The continued expansion in debt will also prolong the flattening of the business cycle to the point where it really doesn’t exist anymore. This is what debt does; it shifts consumption and investment to today to boost demand no matter what the natural business cycle is doing.
When you see key economic indicators stop making the classic sine wave shape you know the business cycle is dead…and you should just buy equities.

Hi, good day. Thank you for your article. Every time you post something I am looking forward to reading it.
May I ask you how you have constructed the «Total stock of bank-related private sector credit» chart from FRED? I may have asked you about this before, but I didn’t manage to replicate it. You said something about using «Loans and leases in Bank Credit: All Commercial Banks» and applying some changes. If you don’t want to share I respect that.
Kind regards,
https://convex-strategies.com/2024/05/15/risk-update-april-2024-wittgensteins-ruler/