As a portfolio allocation, bonds really suck right now
Bonds need to be “defensive” to bother having in a broader portfolio. Right now, they have little chance of being that.
To put it bluntly, it is costing you money to be long bonds. This may not be immediately obvious looking at a chart of the 2-year or 10-year bond yield, but I can guarantee you it is.
It’s costing you less to be long the 10-year bond than it is the 2-year, with both attracting negative carry due to the sharp inversion of the yield curve. A continual delay of the start of rate cuts over 2024 has crystalised those losses in portfolios.
This cost might be acceptable if bonds could provide portfolio protection in equity drawdowns like it has in the past. Pricing and yield curve dynamics make that unlikely and have ended the defensive role for bonds.
The reasoning is the same for why the inversion of the 2-year/10-year yield curve wasn’t a signal for recession this cycle. Relationships have been broken and have changed the way bonds interact with macro as a whole.
Going long shorter maturities has far more potential to protect a portfolio of risky assets, but it isn’t a free ride like it used to be. If the Fed doesn’t follow its forecast as per the dot plot, that protection will result in negative returns on your portfolio.
This doesn’t mean you shouldn’t trade bonds. Short-term range trading can be a great alpha source. My position is from a portfolio perspective. Once upon a time it made sense to just buy and hold bonds. It doesn’t now, despite yields being much higher than they were.
The first 2 sections have a short guide to bond pricing dynamics - veterans may want to skip forward.
How bonds perform in your portfolio
Bonds are called “fixed income” as when they are held to maturity, they provide a fixed return known ahead of time, equalling the bond’s yield. Nothing can change this outcome if you hold it to maturity (and there is no default).
This only takes into consideration two points however, when you buy it, and when the bond matures. In between the story is much more complicated.
As the bond ages the yield on the bond may change from what you got when you bought it. If this happens the price of the bond will change, and it will have an effect on the performance of your portfolio.
For your bond not to change in price over its life, the yield will always have to stay the same as it approaches maturity. A 2-year bond bought at a 5% yield will always have to be valued at a yield of 5% to keep a price of 100 (par).
This is easy to visualize when the yield curve is perfectly flat, in that the overnight interest rate is 5%, the 1-year rate is 5% and the 2-year rate is 5%. As your bond shortens in term to 1 year, the new valuation yield is unchanged.
But what happens when the curve isn’t flat?
The yield curve and expectations
If the overnight rate is 3%, the 1-year rate is 4% and the 2-year rate is 5%, then in a year’s time, your bond 5% bond will be valued at a 4% yield and the price of the bond will increase. This means you can sell it and then repeat, making a higher return than just holding to maturity.
The crucial caveat in this instance is that for this strategy to work, the yield curve can’t represent a future prediction on where rates will be.
This is complex but key to understanding why it can cost money to hold long positions when yield curves are inverted, or short positions when they are positive sloped.
Going back to our simple example of a 3%, 4% and 5% yield curve. In this case, if the yield curve WAS a predictor of where rates would be at 1 and 2 years into the future then in 1 years’ time the overnight rate would be 4% and the 1-year rate would be 5%.
This outcome would obviously require the central bank to hike rates to this level to “fulfil” the predictions of the yield curve, and the market would have to continue to expect the same rate of hikes over the next year as well.
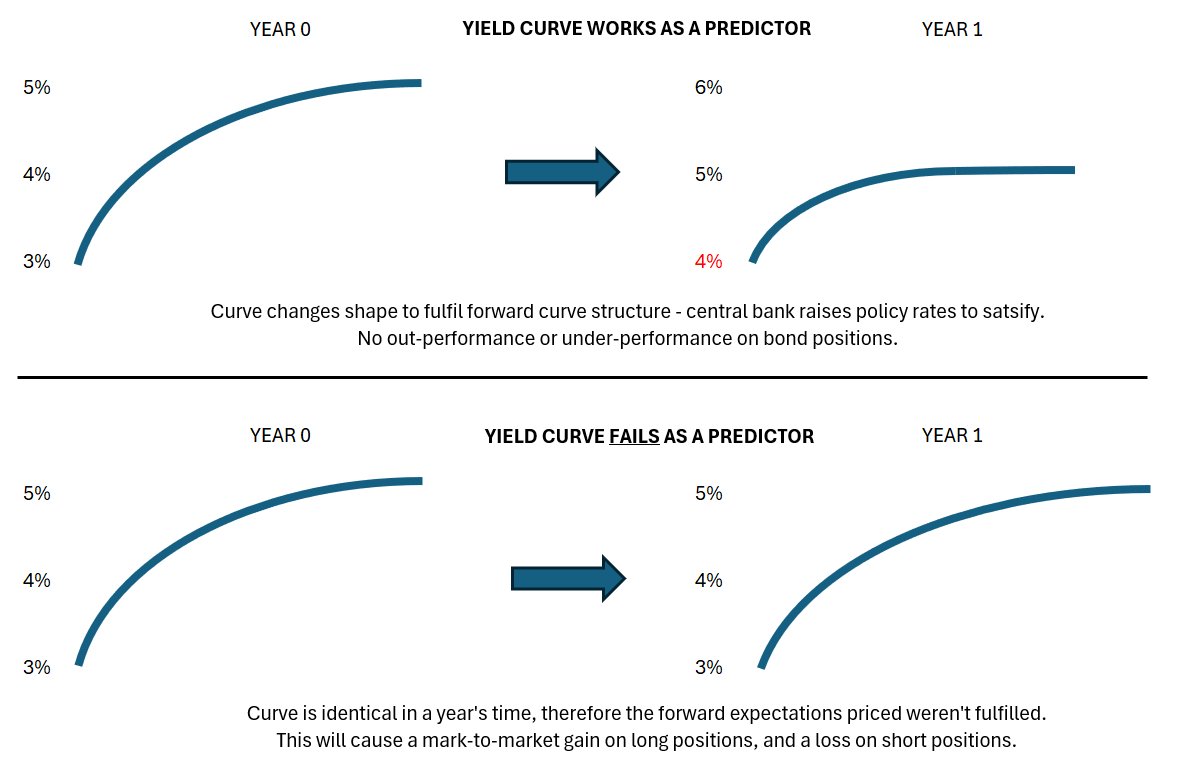
In this example, the predictions of the yield curve have been fulfilled, and there is no opportunity for a 2-year bond that was bought at a yield of 5% a year ago to add any additional returns to your portfolio.
Let’s put this in terms of current market pricing. The chart below illustrates the 1-month SOFR forward curve and the Fed median dot plot.
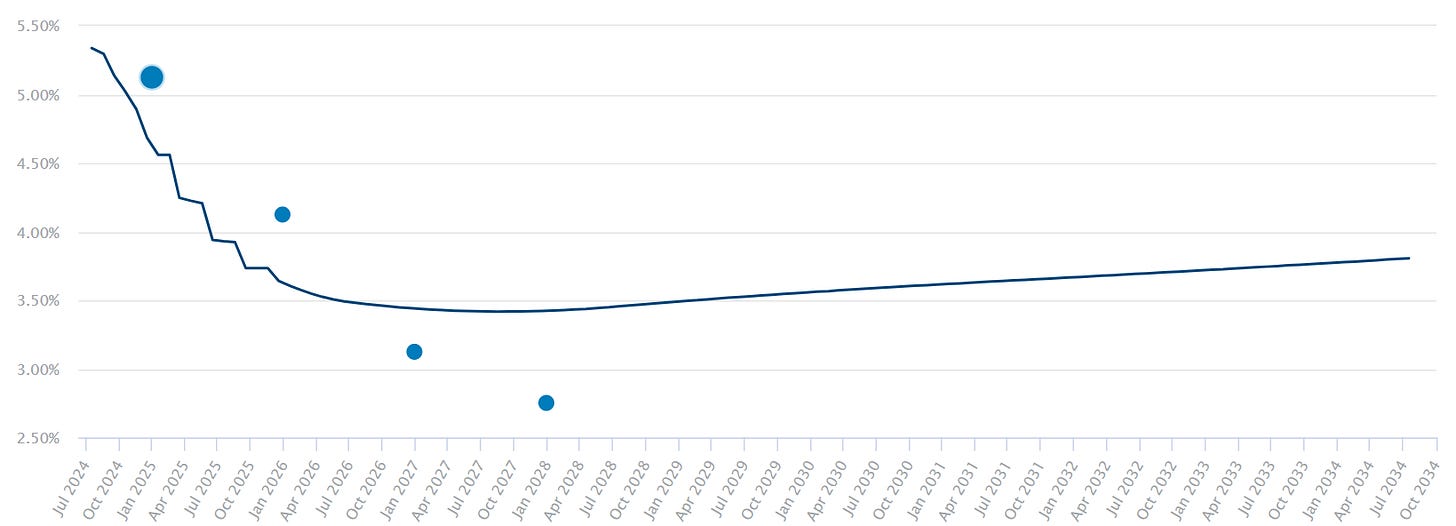
This curve places Fed policy rates at about 3.75% by the end of 2025. This is below the Fed’s own forecasts, as the dots above show.
Any instrument that is sensitive to expectations in this timeframe (including the 2-year bond) will have mark-to-market losses if the Fed rate ends up higher than 3.75% by the end of next year.
For long duration to be profitable it requires more rate cuts (or less rate hikes) than a forward yield curve describes.
When I talk about being “paid” to take a certain position, it is the fading of expectations that are priced into the yield curve that “pay” you. For most of this year, being short resulting in positive performance because the expectation of the Fed’s first rate cut kept on being pushed out.
This tends to work because yield curves are bad predictors of the future.
Forward curves are bad predictors
The more common outcome is that the curve looks the same in the future as it does now. In this case the future predictions didn’t come true, as the rate cuts/hikes that were priced didn’t happen.
Years of positively sloped yield curves weren’t met with consistent central bank hiking to fulfil these forward rate expectations, and the strategies above worked, with a side benefit of “defensiveness” (which I’ll explain a little later).
Academics use the phrase “term premium” to describe that steepness in a positively shaped yield curve that isn’t explained by forward expectations for interest rates. Term premiums are meant to compensate a holder for the greater volatility and liquidity risk of longer duration bonds (in theory).
The term premium itself is only an estimation and is not observable ex-ante. For this reason, I tend to ignore any trades based around it as a factor.
Apart from “term premium”, two other plausible theories exist. In the case of a positively sloped “normal” yield curve, the forwards may outperform expectations because:
The market requires extra return over and above the interest rate set by the central bank to even think about allocating capital towards bonds over other risky assets; or
The central bank has just set the overnight rate at too low of a level for the market to “clear” properly.
Unlike “term premium” which should be positive all the time (the compensation for volatility should always be positive since there is always volatility), the other possible effects can be positive and negative at different points in time, including when the yield curve is inverted.
The inverted yield curve
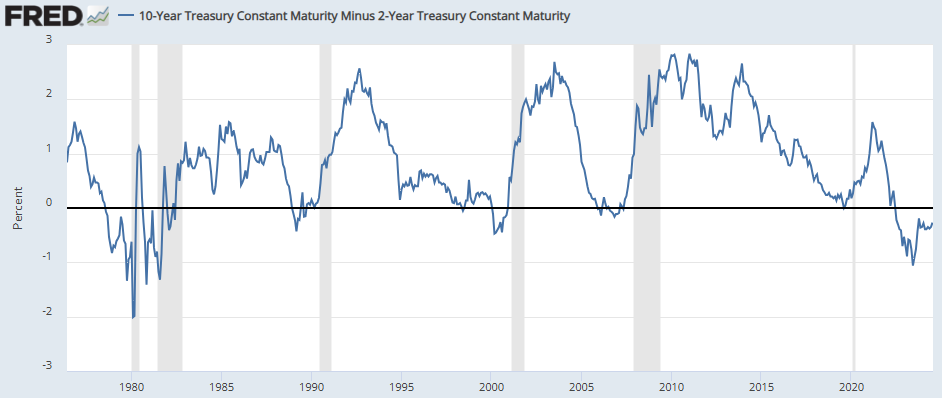
The US 2/10-year yield curve has been inverted since mid-2022. Typically, inversion has signalled recession, but it clearly hasn’t this time around (to the chagrin of many).
Despite the heavy inversion, recession hasn’t been on the cards. I’ve been actively warning against using the curve as a signal this cycle. This is due to ‘where’ the curve was inverted, and ‘how’ the curve inverted.
The ‘where’ is the most important part of the equation. In a typical cycle where the economy is slowing, central bank overnight rates will reach a plateau, usually after a hiking cycle. At this point the short-end of the curve (roughly out to 2-year maturity) will go from being positively sloped (i.e. the market is expecting more rate hikes) to flat.
Normally as the economy continues to slow, the 1 to 2-year part of the curve will fall below the overnight rate. From this point onwards, the inversion will ripple through the curve, making its way to 2/10-year and then 5/10-year.
Once the latter two curves invert, the message is loud and clear. The market is now reaching for duration, not only gaining the leverage of owning longer duration bonds (with more profit potential), but at a yield premium to shorter yields when still positively sloped.
This will continue to play out while the central bank remains on the sidelines about shifting monetary policy, encouraging the trend towards deep inversion of the yield curve. Inversion of the longer end of the curve happens less frequently and later than inversion at the short end of the curve, which optically makes it a better “predictor” of recession.
You can think of inversion of the 2/10-year curve as the final confirmation of a downturn of a business cycle, one that happens infrequently enough that it should be taken seriously. So why didn’t I take it seriously when it inverted in mid-2022?
Simply, the market was still looking for rate hikes and policy rates were still increasing!
Pricing in near-term rate hikes is entirely contradictory to also implying that recession must be near because 2/10-years have inverted. Both data points need to square for a clear message to be given.
This is not to say that rate hikes can’t cause recession (indeed that was the misguided point of the hikes), just that the signal in this situation isn’t valid because the curve will invert purely for mechanical reasons.
Considering it another way. An inverted 2/10-year curve is saying that the priced level of policy rates is highly unlikely to be sustained for a long time. In the past this was due to economic slowdown. This time around it was about inflation (or at least the Fed’s view of inflation).
The 10-year bond was never going to price in the same level of breakeven inflation that the 2-year was, and this was the prime determinant of why overnight rates (and thus partly the 2-year) were at the level they were.
This means the inversion of the 2/10-year part of the curve could essentially be ignored from mid-2022 until the end of 2023, when the Fed’s pivot away from further rate hike guidance finally allowed the very short part of the curve to invert.
If we take 1-year bond yield versus Fed Funds, the inversion has been mild and not historically enough to say recession is near either.
In addition to this, the pricing of rate cuts has also happened at a time when the 2/10-year part of the curve is re-steepening.
If we were in fact getting closer to recession, both would be inverting further, rather than moderating. Again, this guides us AWAY from recession rather than towards it. If the Fed starts cutting rates in September, the curve to become positively sloped again. This is just a mechanical realisation of the forwards and not a trade that can be implemented.
While the curve has steepened up slightly recently, a decently positive slope won’t come about until the Fed has a number of cuts under its belt. The June inflation print finally adds validity to this view that the rate cuts priced in by the curve (and the Fed’s own dot plot) will materialize; but this still makes the 10-year bond a horrible buy.
Not only is it a horrible buy, but it has very little utility in a broader portfolio given the starting point of an inverted curve.
How bonds perform in your portfolio pt. 2
We’ve established that owning bonds is, quite literally, an uphill battle because of the inversion of the yield curve. A positively sloped curve combined with the continual failure of the yield curve to work as a predictor of the future and declining policy rates made bonds an easy add to a portfolio of risky assets.
These factors gave bonds a positive expected return since the 1980s, and this has obviously been beneficial to portfolio inclusion over this time.
Even though the expected return for bonds was less than equities, they still warranted inclusion for the simple fact that they became strongly negatively correlated to equities once the Fed moved towards a “deflation-phobic” stance.
This gave bonds a very beneficial attribute in that they were broadly uncorrelated in normal times (when equities tend to go up) and heavily negatively correlated in times of trouble (just when equities were likely to go down).
This conditional correlation is the whole reason the 60/40 portfolio existed. Needless to say, it is still a huge requirement at the moment to bother including long bonds as a diversifier.
Historical testing reveals that a positively shaped curve is highly associated with bonds working effectively as portfolio protection. The data says that buying bonds when the curve is flat or heavily inverted is ineffective at best, and sometimes (like in 2022) they can work against your equity allocation.
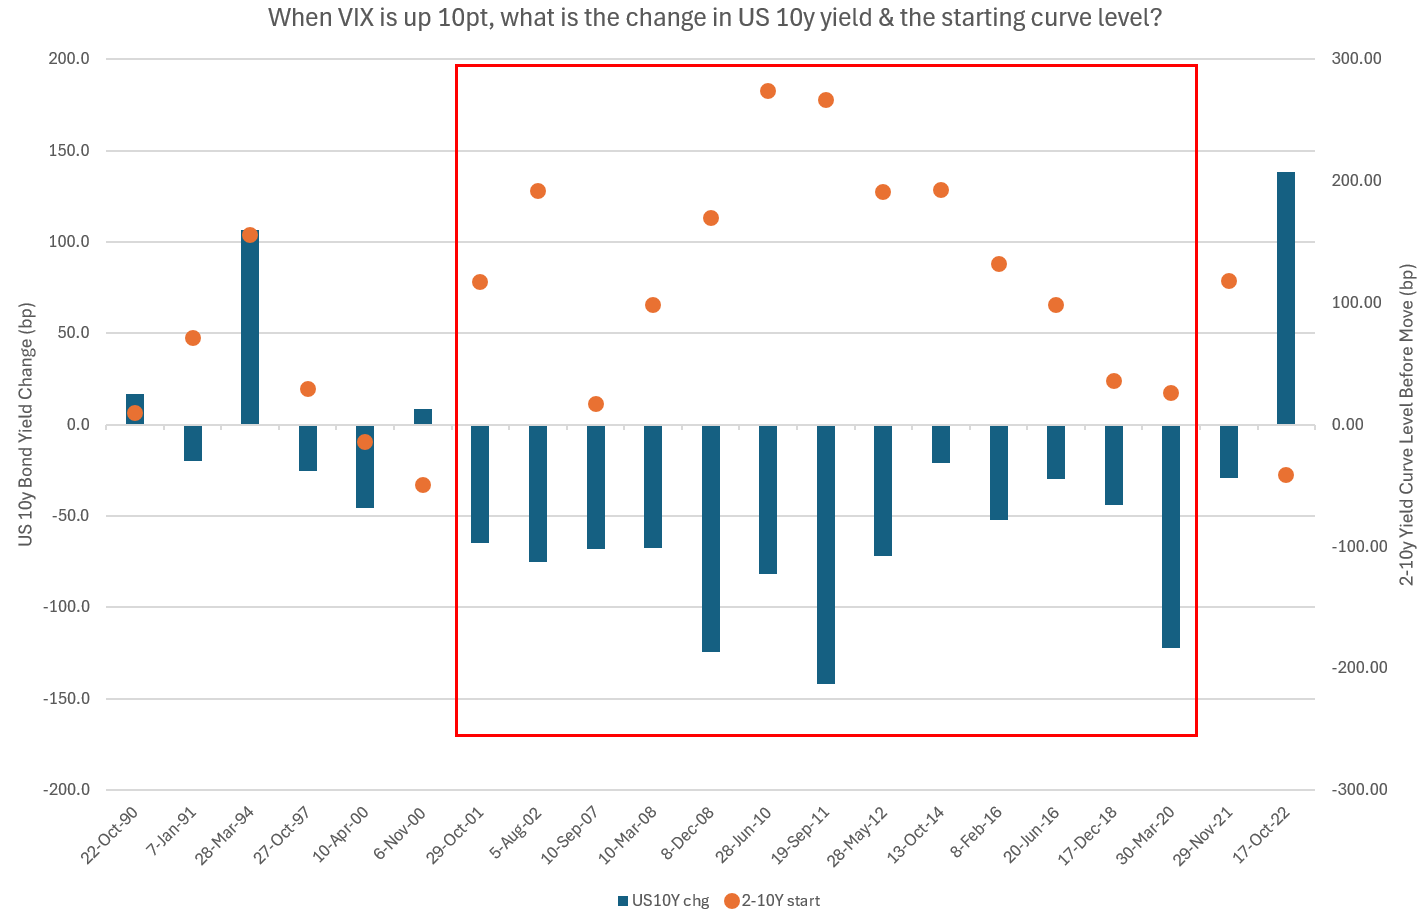
When the curve isn’t strongly positively sloped, making bets on more aggressive cuts delivered far more portfolio protection than owning the benchmark 10-year bond.
In other words, don’t bother reaching out in term unless 10-year bonds are cheap to the near-term path for the Fed. They just won’t return if there is already a huge hurdle in the form of rate cuts to deliver first to return the curve back to a positive slope, and the testing shows this clearly.
The current pricing of Fed interest rate cuts lessens the portfolio insurance provided by the short-end, and in weird reflexivity, disaster insurance is also already priced into the Fed’s expected policy path.
Portfolio protection
If you buy the 2-year bond now, your return will equal the yield you bought it at if the Fed delivers on the rate cuts priced into the bond at the times that its priced to. From this point of view, the yield curve and its predictions matter to your returns.
In the same way that the split between “term premium” and Fed rates expectations are unknowable, there is a component of the policy rate expectations that is “disaster protection”.
You could call this portfolio insurance, which would be the opposite of term premium. An insurance cost present in pricing that looks like more Fed cuts but is in fact hiding a premium that market is willing to buy at to bet on the Fed cutting hard in a disaster scenario. A negative term premium, if you will.
The insurance cost exists despite the inflation scare of the last few years in the face of true economic fear the belief is the Fed will still cut aggressively, inflation be damned. Rates are high, and in disaster they will likely find a level a lot lower than where they are.
It may seem simple, but it’s an entirely rational view.
Can we estimate this protection cost? This, unfortunately, is difficult.
The most complicated option is to derive implied interest rate paths from probabilities built into call option pricing at different out-of-the-money strikes. An increasing call skew, for example, would suggest that there is more premium being built into pricing as people are willing to “pay overs” for low probability outcomes (in this case fast interest rate cuts from the Fed due to a crisis).
Another way is to compare current rate cuts with the Fed dot plot or the median analyst in the market. Of course, the median analyst has consistently been wrong (especially concerning rate cuts) and tends to use current pricing as an input to their own forecasts.
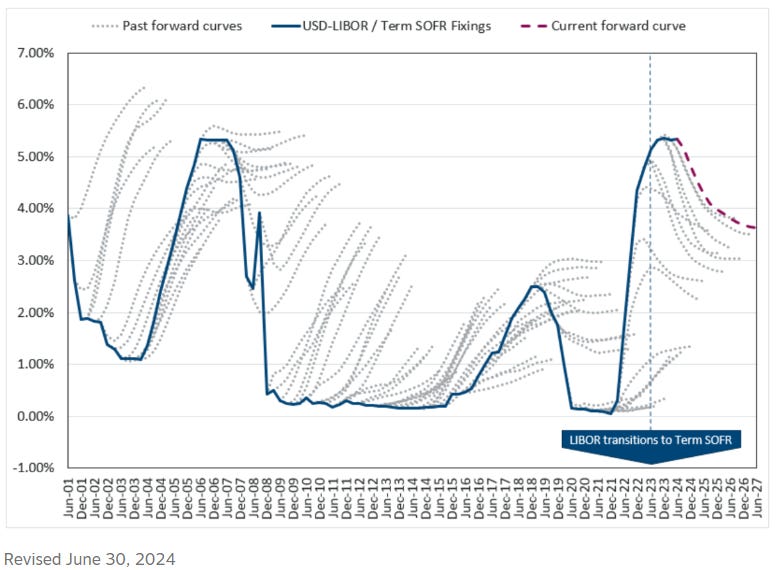
The Fed dots suggest an end of 2025 policy rate of 4%, putting the “portfolio insurance” premium at 0.25%. Very roughly this is a 10% premium rate if an extra 2.5% of rate cuts are delivered in crisis (taking the policy rate to 1.5%). To some this trade makes a lot of sense.
However, if you are short, you can collect this insurance premium.
Ultimately the best determinant here will be your own distribution of Fed policy outcomes. If you don’t think the Fed will cut as much as pricing indicates, then the difference could be attributable to net buying for portfolio protection purposes.
Everything ties into the Fed’s regime
These observations are all intimately linked with the core drivers of the Fed’s actions, and how their view of risks changed significantly since inflation reemerged.
I wrote a newsletter about the shift in regime and the drivers for it. It’s a more technical read, but worth the effort. This is missed by most analysts, who seem to just write it off as “there was no inflation, and now there is”. This only captures half of the reasoning, and frankly this just isn’t enough when it comes to risk taking.
Remember, it isn’t the returns of an individual security or asset class that kills you – it is getting the correlation between the assets in your portfolio drastically wrong.
I’ll be interested to see what the Fed does when growth does start to disappoint. This will reveal their attitude towards the growth versus inflation risk debate. Right now, employment is becoming a huge talking point because of its slight drift higher (and an unemployment rate that, while still low, is higher than what it was pre-pandemic).
While the Fed is yet to cut, if they do so in September then that is a strong sign that the tail to inflation is moving back towards flat away from uncontrolled inflation. Employment may be the cover but will look like an excuse compared to the much lower level of nominal growth in the 2010s.
Come back when the curve is at +100
This newsletter purposely excludes my own views on the rate path – it instead concentrates on the value inherent in 10+ year yields with the curve the shape it is.
Bonds aren’t usually in a portfolio for ‘alpha’ but are there for their diversification benefits. It’s from this point of view that they just aren’t going to do their job as well as they have in the past. The upside just isn’t there because of the interest rate regime we are in.
The far better solution is to have leveraged bets in the front-end (<2 year), which should effectively cover you if a disaster occurs that necessitates the Fed to cut aggressively. There is plenty of room for rates to fall (obviously), so the profit potential is large – much larger than for the longer end of the curve.
With rate cuts off the table, the downside is capped as well. A Fed on hold will cost but won’t destroy returns. This may be worth the insurance it provides, something the allocator will have to decide on.
This strategy used to be free in the past as curves were rarely this inverted, and so many cuts outside of recession priced so aggressively. This will cost if the Fed keeps dragging their feet.
The 10-year bond doesn’t have the same cost of carry, and this is where the trade-off resides.
You can hold a 10-year bond position for longer because of the less punitive carry, but this is already priced. 10-year bond yields in essence have already been signalling our future return to the old regime where the worry is low nominal GDP and deflation.
An inverted curve limits protection as yields just won’t move anywhere near as far as the Fed cuts.
So, the choice is strong downside protection but negative carry (buy 2-year to protect) or less negative carry and weak downside protection (buy the 10-year).
It used to be an easy and obvious choice to jam a bond exposure into a portfolio. That isn’t the case anymore.
If, like me, you have the view that nominal growth will continue to punch above where we should probably be then the balance of probabilities might eliminate buying short duration bonds as well.
But for long-term holdings in a diversified portfolio, long bonds serve absolutely no purpose at all with pricing where it is. They won’t protect, they won’t return enough, and you are exposed to an adverse event and you are open to an admittedly unlikely but possible bear steepening.
Please like & share if you enjoyed this newsletter!


Thanks, great post !
Thanks, your pov is always much appreciated 👍