
Charts & Notes: There is no bond "rout"
Yields will drift higher, and fiscal will just expand to deal with it

I’m not sure what is going on with reporting on bond markets these days. I love a trader’s market with plenty of volatility as much as the next guy, and if you read the financial news, you’d think that’s what we have.
But we don’t have that. Bond volatility continues to decrease. Momentum is still for higher yields, but this in itself does not create a “crisis”.
While the narratives are directionally correct, the general alarm just doesn’t match actual asset performance.
Maybe part of the problem is that the general acceptance is that the great inflation is over, so we should go back to the prior 50-year trend of falling bond yields.
As I’ve spoken about many times, the prior decline in bond yields was because of a number of factors, including:
A downward trend in nominal GDP growth in the developed world; and
The reliance on bonds to be negatively correlated to risk assets.
The change in the first factor is the dominant driver of higher yields now. The second factor is more complicated and is tied in with central banks abandoning their 2% target for inflation.
The true reason for bonds being such a good diversifier since the turn of the century is because central banks (most notably the Fed) switched the reaction function from being fearful of higher inflation to suddenly being worried about the risk of deflation. This meant big interest rate cuts when growth faltered, which in turn led to strong bond performance.
Now, central banks can’t afford to be worried about deflation as they are shifting their inflation band higher. This means big bond rallies to offset 20% S&P500 drawdowns are gone. Mathematically, it was in periods of equity drawdowns where nearly all of the “diversification” came from.
For more on this, read the article below. It will change how you think about the role of bonds in a portfolio.
Is the 60/40 portfolio dead?

The 60/40 equity-bond portfolio became popular as it enhanced risk-adjusted returns by leveraging the negative correlation between equities and bonds.
Exhibit A
The article below (click the image to read) is a perfect example of this alarm.

On France,
Last week the crisis was the sell-off in French bonds - called OATS - after a confidence vote on the government was called for Sept. 8, prompting a sharp fall in the CAC 40 (FCE00) share index on fears of a political vacuum.
the UK,
This week, the alarm bells are ringing in the U.K. as 30-year bonds - known as gilts - continue their inexorable decline as the Labour government tries to plug a GBP20 billion to 25 billion fiscal hole during its upcoming autumn budget.
and the US.
At 4.97%, the 30-year bond yield is within spitting distance of the key 5.00% level. The U.S yield curve is steepening with the spread between 2 and 30-year bonds now 130 basis points, suggesting that inflationary expectations are becoming unanchored.
Let’s start with one only one that should have been mentioned, Japan.
Japan
30y JGB yields continue their march higher.
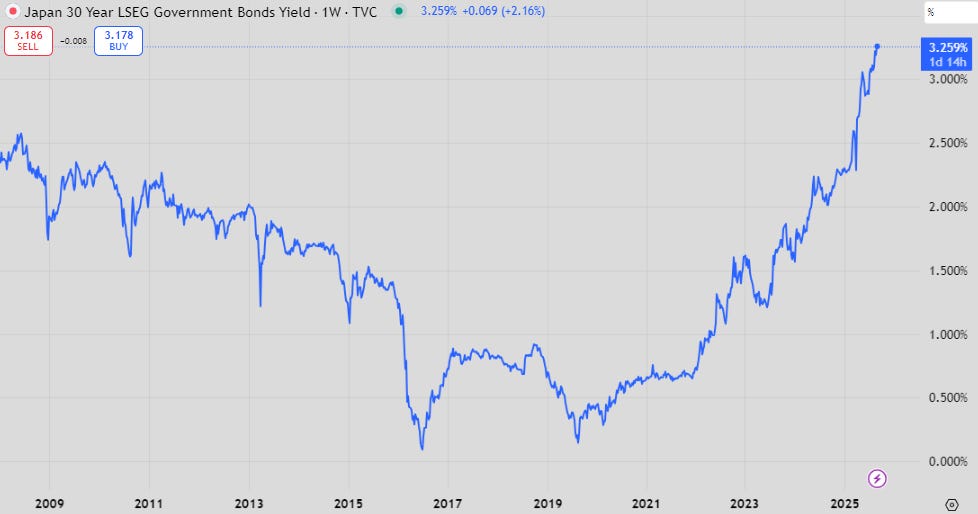
The dominate theme was rate hikes, but not in this second leg. I covered a big reason for it in this edition of Charts & Notes. Essentially Bank of Japan and domestic buying hasn’t been replaced by foreign investors. The 30y is still trying to find its clearing price.
You can see where this change took place. The structure of the JGB market means that BoJ QT has had a bigger effect on JGB demand than it would in the US (where the opposite usually happens).
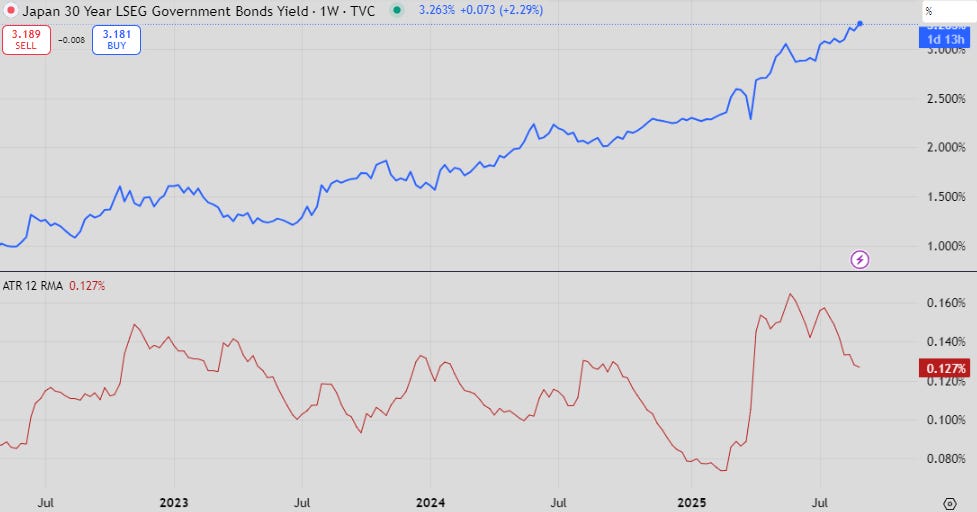
The bottom pane of the chart above shows the average trading range of the 30y over 3 months. It’s my preferred measure of volatility.
While it is still elevated, it is falling, but at 12.7bp a week it is still less than most other markets.
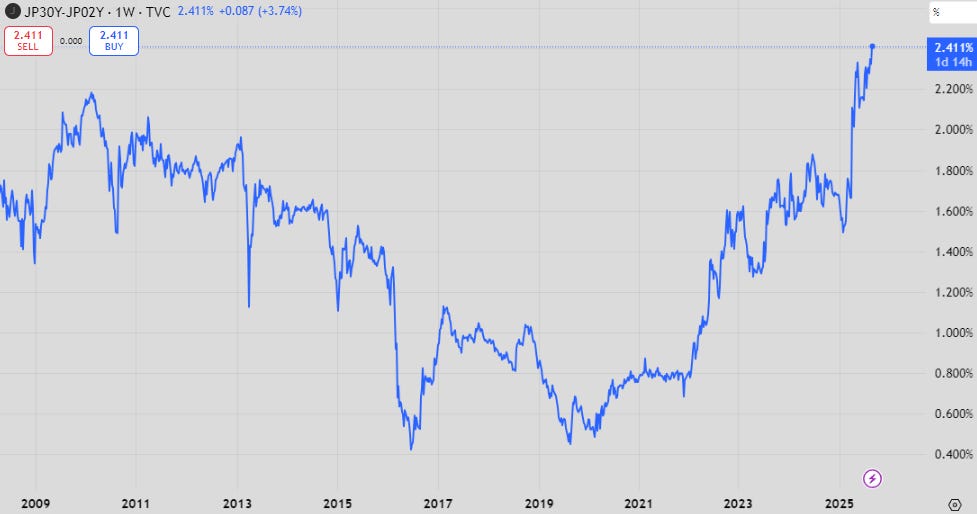
Despite a dramatic looking chart, JGBs have steepened slightly less than other markets.
France
This week’s catalyst for this bond market narrative was from French politics as noted in the opening article.
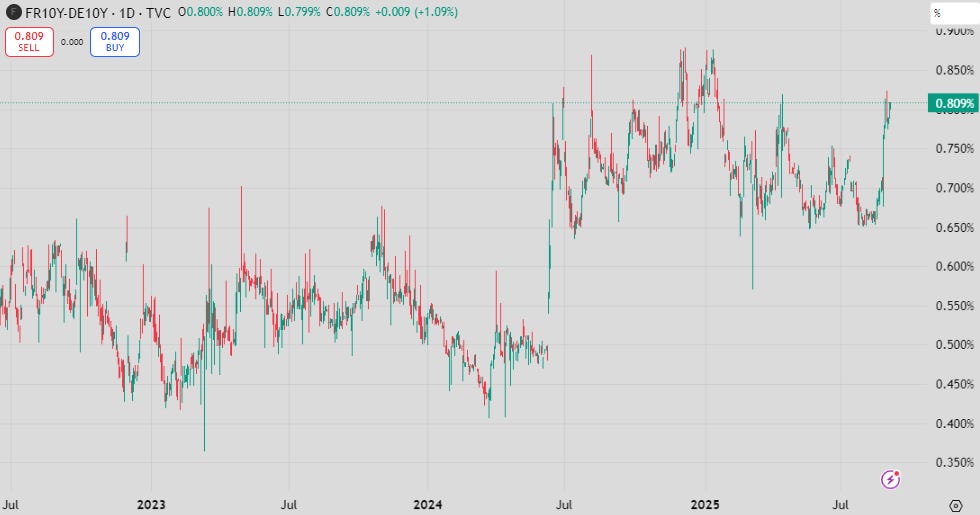
French bonds sold off against the German benchmark. Should Germany be the benchmark given their fiscal plans?
The 15bp widening in the above spread isn’t catastrophic and isn’t a breakout of the 1-year trading range.
On an outright basis, OAT yields a still falling in trading range despite the political volatility. This isn’t the sign of a “rout” at all.
UK
I’ll let DB’s Jim Reid express the dominant narrative.
Deutsche Bank's head of macro and thematic research, Jim Reid summarized the predicament in which the U.K. government finds itself as a "slow-moving vicious circle: rising debt concerns push yields higher, worsening debt dynamics, which in turn push yields higher again."
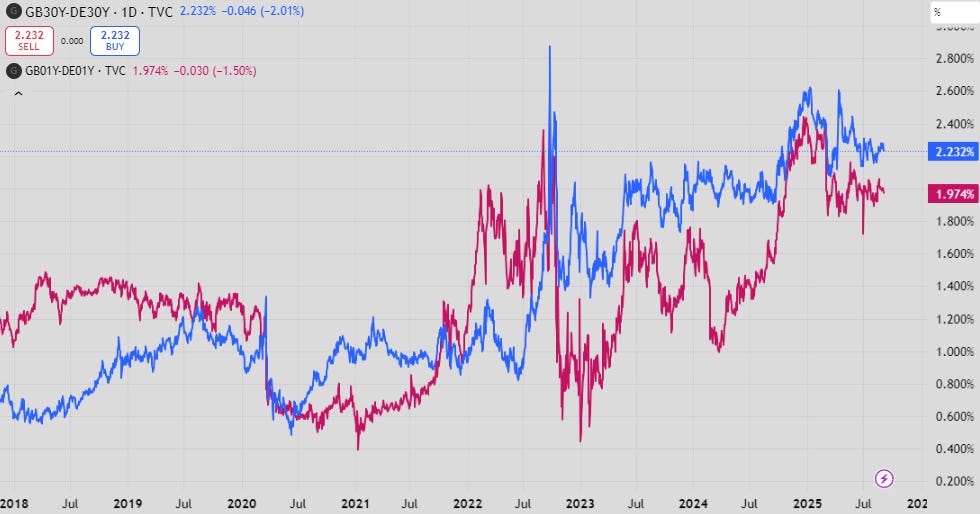
Gilts have widened against Germany…
…but this can be explained by the ECB cutting rates by more than the BoE. the 2-year/30-year curve has steepened about the same in both countries.
You could argue that the market could also be voting against Germany’s fiscal plans, but this isn’t reflected in financial media reporting.
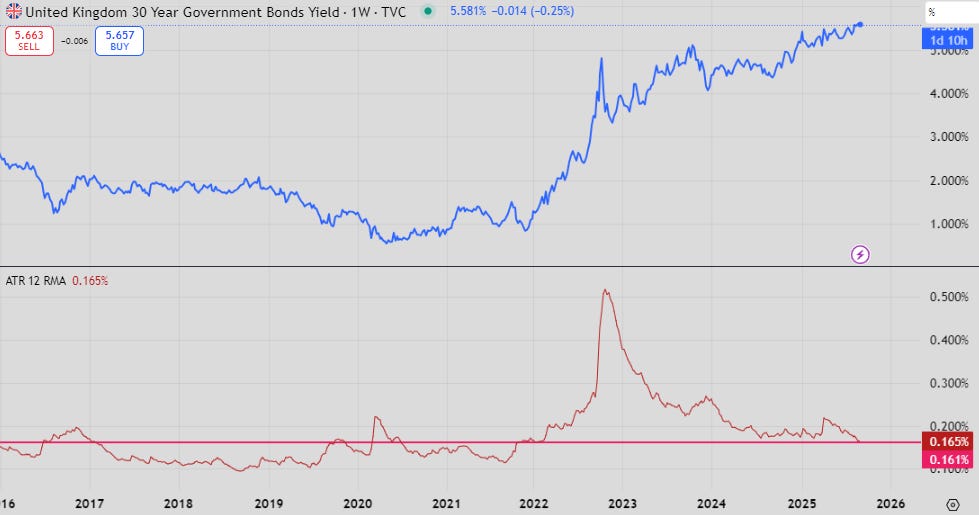
Volatility of the 30-year gilt is higher than Japan and France, but in line with the yield adjusted volatility of the 2010s.
US
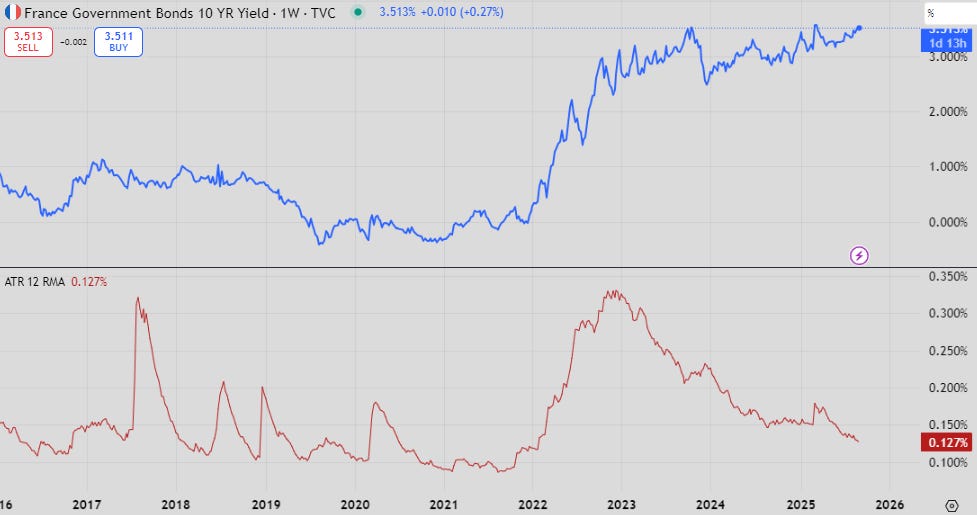
Finally, the US, where 30-year yields have been bumping up against 5%…for quite a while now.
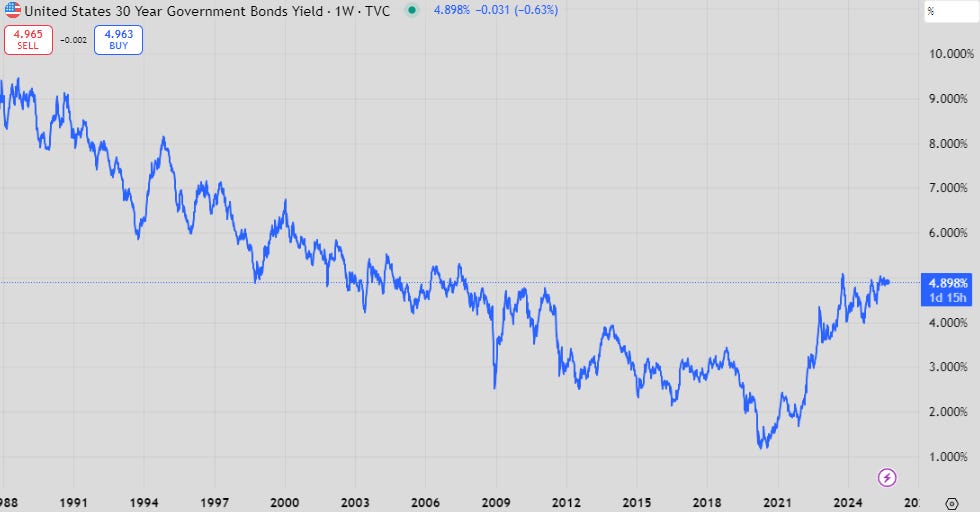
Long-end yields are in a holding pattern. I’ve argued that the Fed will accept a core CPI target of 3% - 30y yields at 5% are probably a little low in this circumstance.
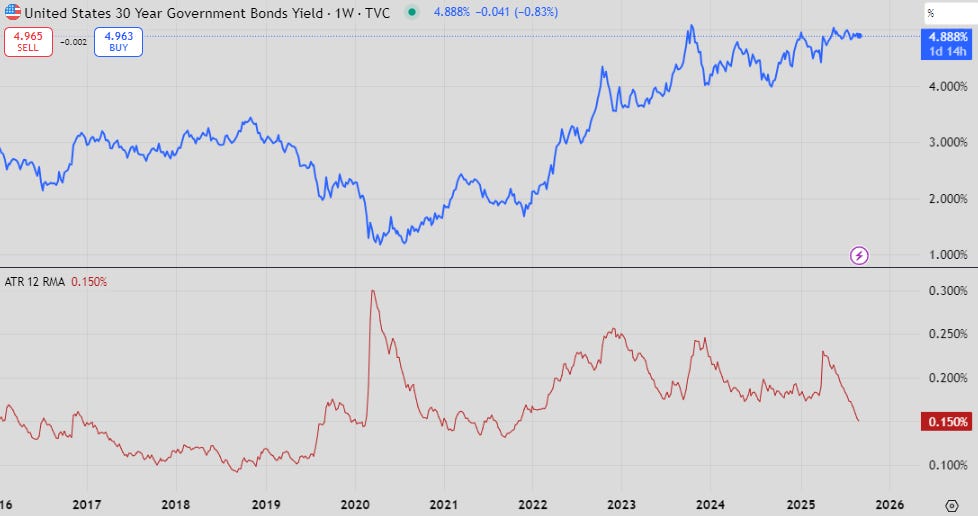
Again, volatility has been falling after the Liberation Day spike. It is substantially above low 2010s vol, but once adjusted for yields (higher yields mean higher volatility), it is not out of line.
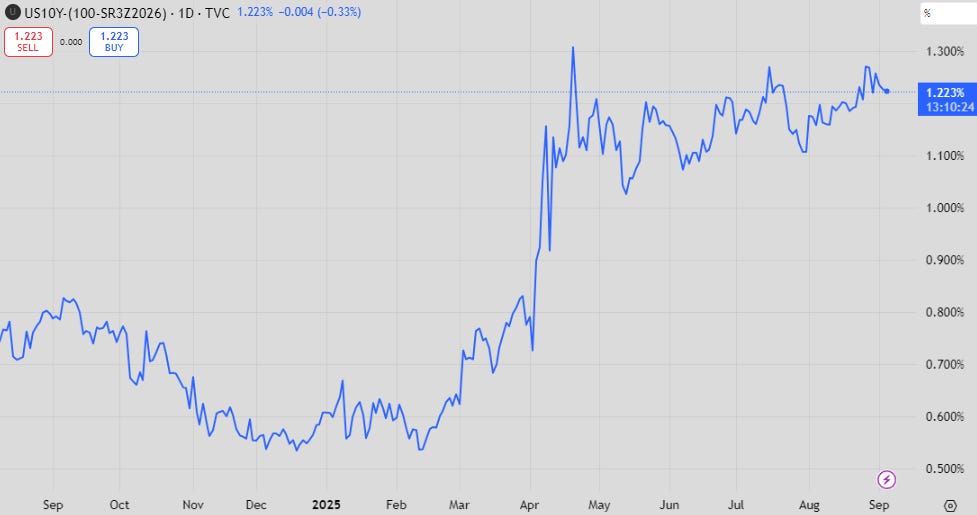
My preferred expression of the steepener isn’t doing a whole lot. This trade is still viable once we break down narratives to leave out journalist exaggerations.
Trying to sound smart
Reporting on the bond market has always suffered this issue. If they are moving, for some reason something must be written about how important that is.
There are real narratives there. Fiscal expansion and changing central bank behaviours will affect yield curves and bond performance in the context of other asset classes.
A “rout” it is not. The prior 50-year trend of ever falling yields is over, and the bond market can still technically be described as being in a bear market.
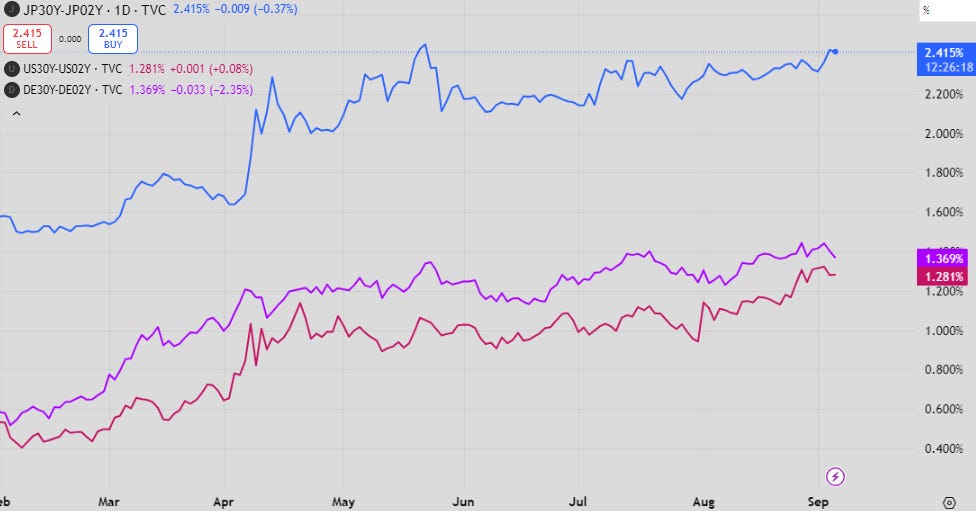
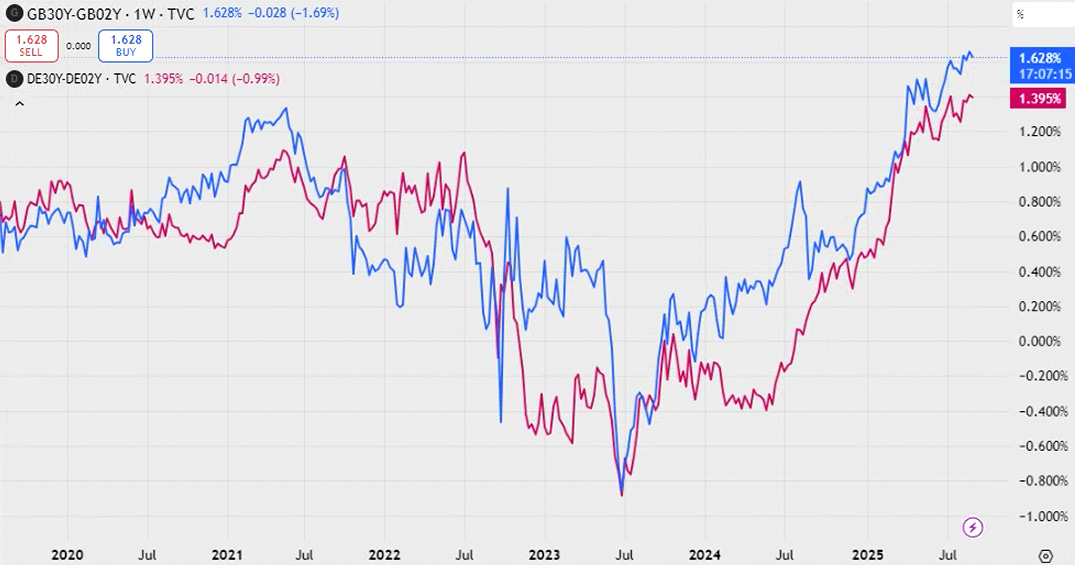
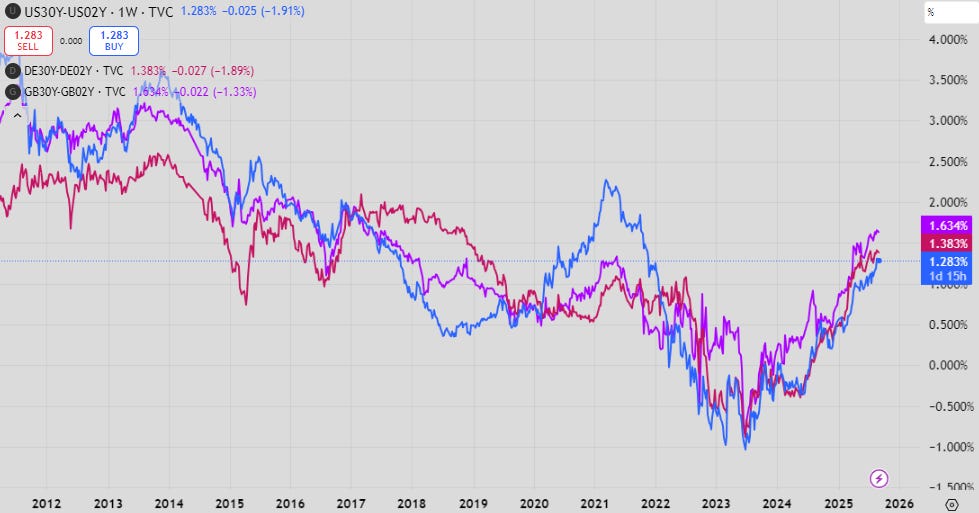
The last chart above shows the 2-year/30-year yield curves from 3 countries spoken of above. They are all moving similarly because the key drivers are all moving in the same direction.
The final debt accumulation has to be at the government level because households and corporates have had their generational blow-ups. The geopolitical situation demands governments compete similarly - and this is going to make bonds a difficult asset class for a time to come.
Great as always..
Ray Dalio had something similar to add to bonds. His view comes from rising government deficit world over. The path that US fiscal deficit is in will lead to a crisis in 3 years give or take one or two years as per legendary macro trader.
Nice piece. Part of the narrative panic might have something to do with bonds' relative performance compared to gold, and increasingly, the entire precious metals complex. If gold is the fire alarm for bonds and currencies, some panic would seem to be warranted.