

According to Goldmans, US average tariffs will rise from 2.6% to 18.8%. Once you include exemptions, the new average tariff rate will be 12.6% (chart further below). Asia was hit harder than the Americas and Europe somewhere in the middle. 10% base tariffs take effect on April 5, with the rest on April 9.
This is the extent of what we know. Everything after this is akin to trying to solve a game of “GO”. There are so many subsequent paths this cannon shot may result in, and the most honest answer is that nobody really knows how it’s going to go.
Negotiations are the most obvious first step, however the base 10% tariff won’t be subject to negotiations. Then it’s the fiscal response. Technically all the tariff revenue could be passed on as tax cuts which complicates the US growth worries.
Getting information has also proven difficult. The well is very much poisoned by analysts who mix in their political views with what is meant to be unbiased research. These enormous tariffs are something that has happened in response to a decades long trend. Anything else that is done to arrest that trend would be equally as disruptive.
With more conviction I can at least say the following narratives are still driving markets:
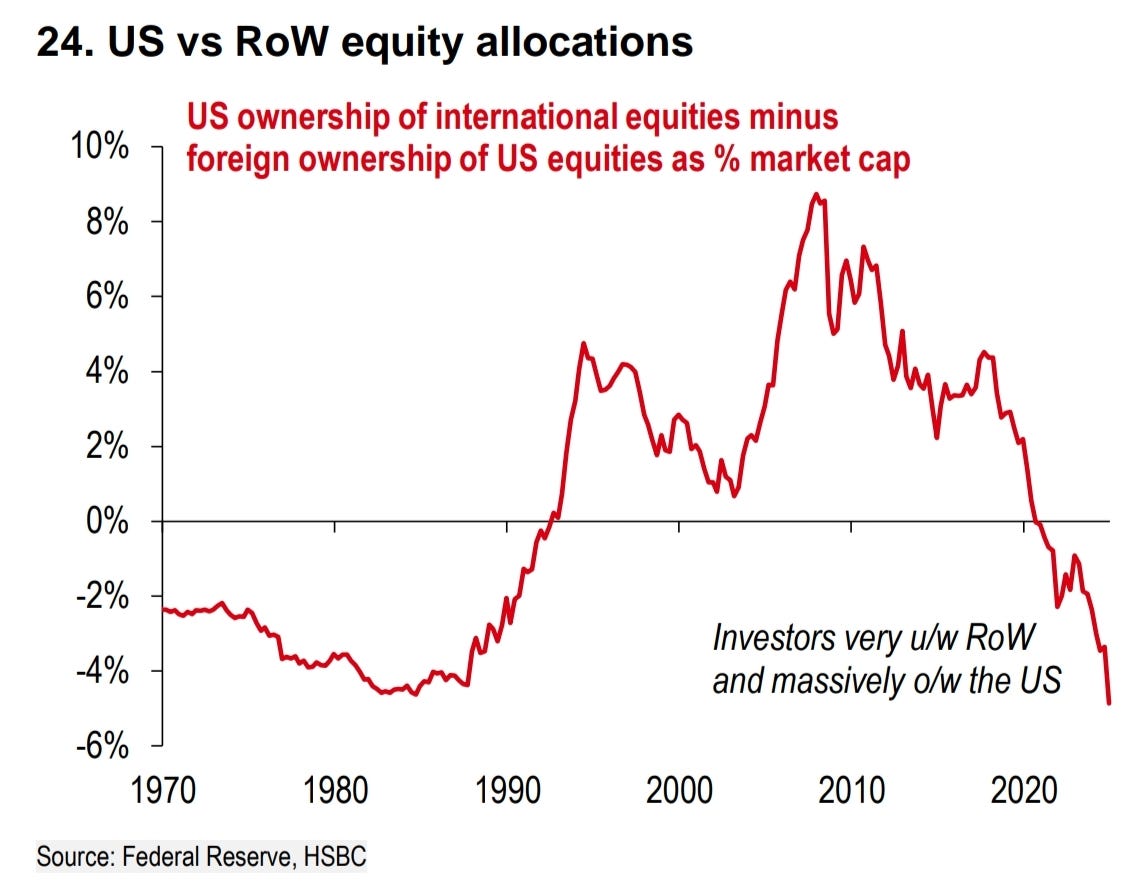
The rotation out of the US has only picked up steam. See the weak dollar for confirmation;
Tech led earnings downgrades are still more important than recession pricing (I’ve talked about this ad nauseum, more charts below);
There is much more certainty on the conviction of the Trump administration to put an end to the US consumer funding manufacturing surpluses of the rest of the world;
Uncertainty in any form affects valuations by lifting the discount factor. This is the first government in my trading career that embraces uncertainty, with the exception of the short “moral hazard” debates of saving banks during the GFC. More on this in an old newsletter below.

What isn’t driving markets right now is the more certain effect on global inflation of the intent to eliminate the lowest cost producers of goods. This won’t be transitory if it is successful. The market is 100% focused on growth and growth alone. This is driving rates pricing and has finally managed to crack credit markets.
With the intent now clear, we are in a situation similar to the first half of the GFC when financially stability concerns affected the US, and the realisation of the effects elsewhere were ignored. The USD fell 10-15% and US equities underperformed their European peers by around 30%, not realising the financial linkages that existed. When it comes to global trade, surplus countries have more to lose than the US, but it is far too early for that trade yet.
Alternatively, tariffs executed like this could be the worst idea in human history. Nobody really knows right now.
Tariff chart of the week
Really, how could it not be?

Goldmans’ rundown of total tariff increases is in the table above.

While the numbers in this chart differ from Goldmans’ numbers, they put this move into context with history.

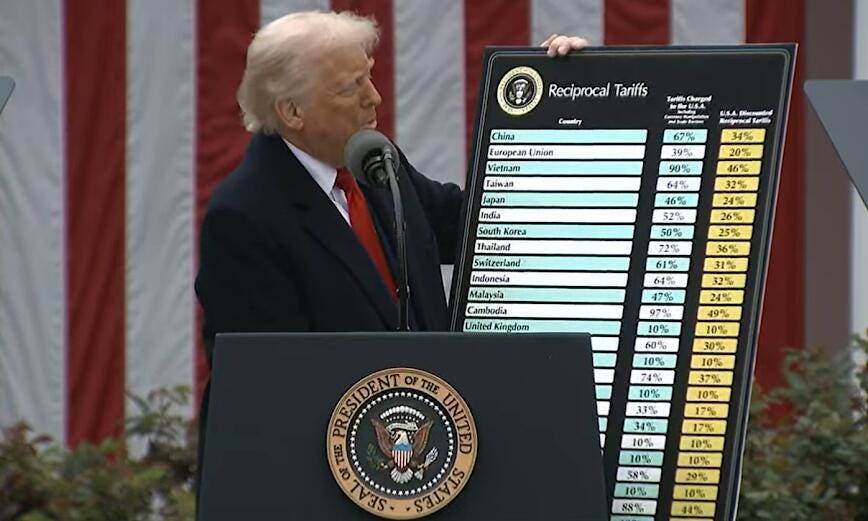
Much has been said about the adjusted tariff rates presented by the administration. Turns out it was just the deficit over how much the US imported from that country.
The number has been seen as silly, and the title given was misleading, but it makes Trump’s intent clear to me. If we import more from you, you are more of a target.

The whole charade isn’t without humour though. The USTR presented what looks like a very complicated formula as explanation for the very simple calculation. As a student of both mathematics and economics I’ve done this more than a few times myself!
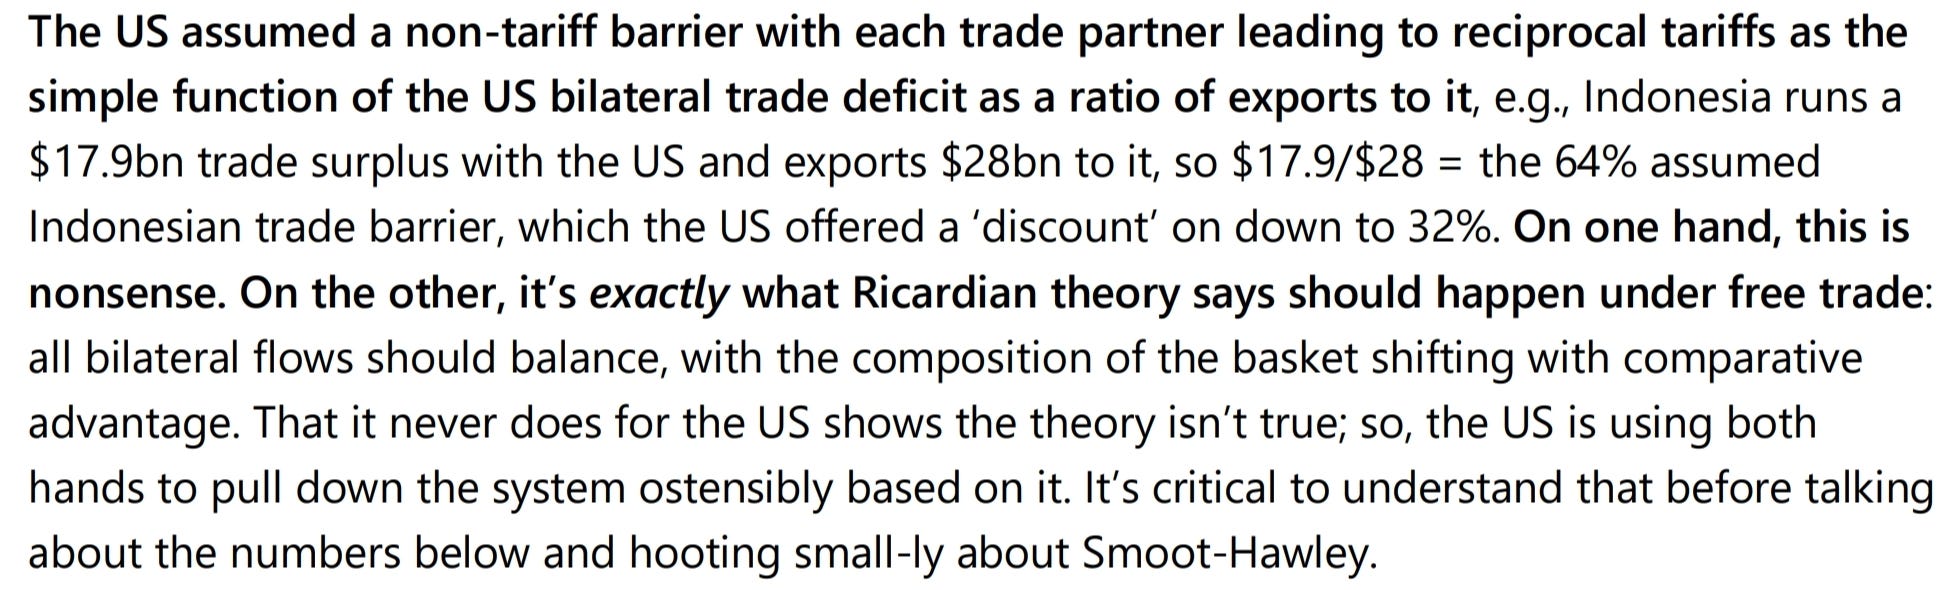
As HSBC says above, the calculations can be thought of as nonsense or says that the presence of any persistent trade balance is proof that trade theory is equally nonsense.

While I don’t fully agree with the conclusions above, the growth and inflation estimates aren’t too far from what I’d expect. There is far more certainty around the heating up of core inflation than the hit to growth in my view.

Here is another estimate on the effects of the tariffs as a tax on different sectors of the US economy. Revenues could add up to a quarter of the current deficit (around $1.8trn).
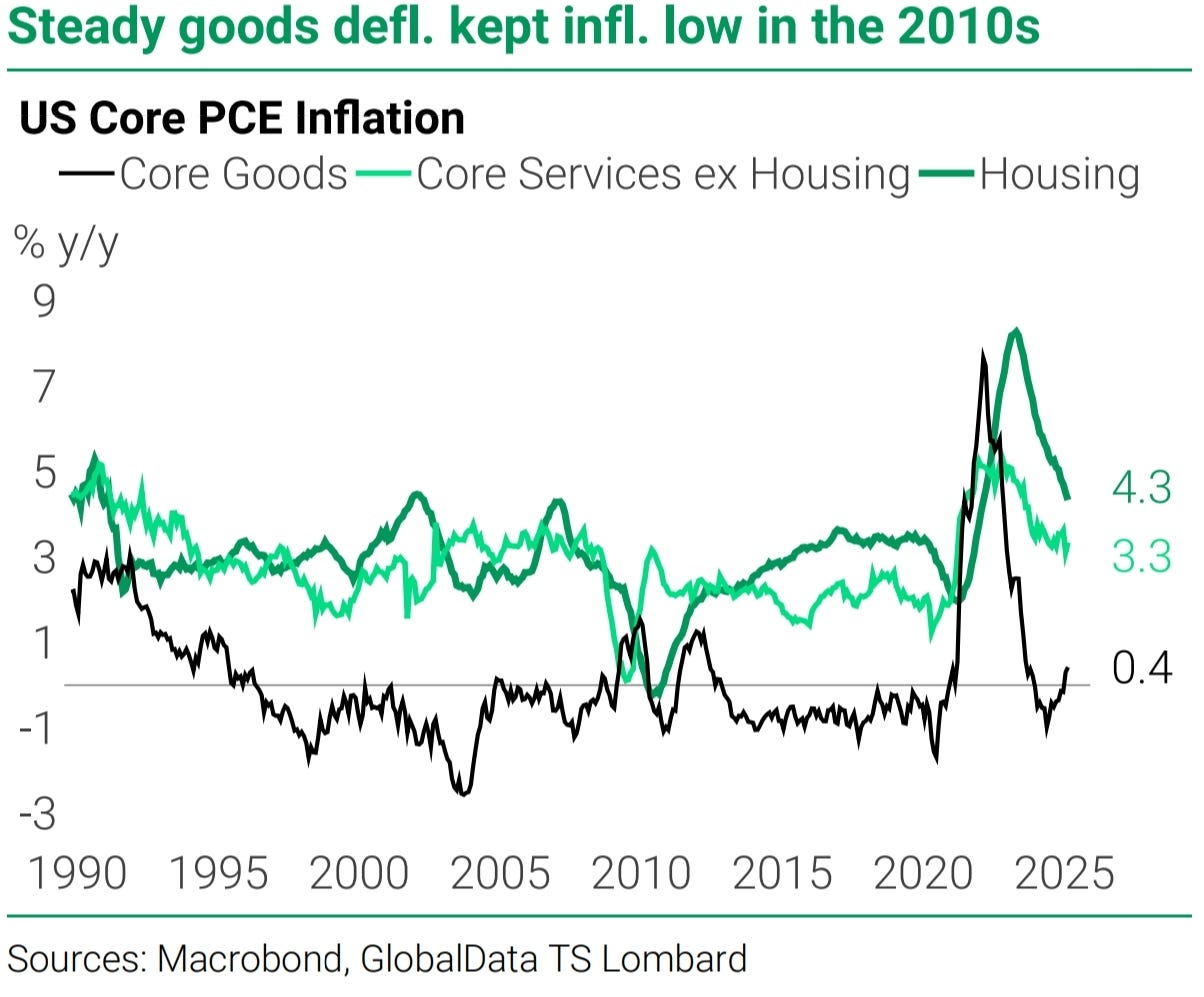
Core goods deflation, which supressed inflation in the 2010s (essentially China exported deflation for this entire period), is likely to never happen again. The 2% core inflation target is dead.
Key questions that arise for me are whether the pivot is immediately to the fiscal response, getting the markets attention away from the drastic nature of this change to global trade. It’s what I would do, and a goal Trump has repeatedly spoken about in regard to eliminating income tax in favour of tariffs.
The reaction to near term economic data will also be important. Payrolls data out today will be the first.
The tariffs applied on Vietnam were the most shocking out of the whole lot. Vietnam has acted as a conduit for Chinese companies looking to escape past protection manoeuvres by the US (including that placed by Obama before Trump), and also as a way to secure cheaper labour for apparel manufacture once Chinese wages started climbing.
It is also the most interesting from the point of view of whether the US even wants (or can) reshore apparel and footwear manufacturing. I’ll leave single stock analysis to others, but the effect on companies like Nike will be significant.
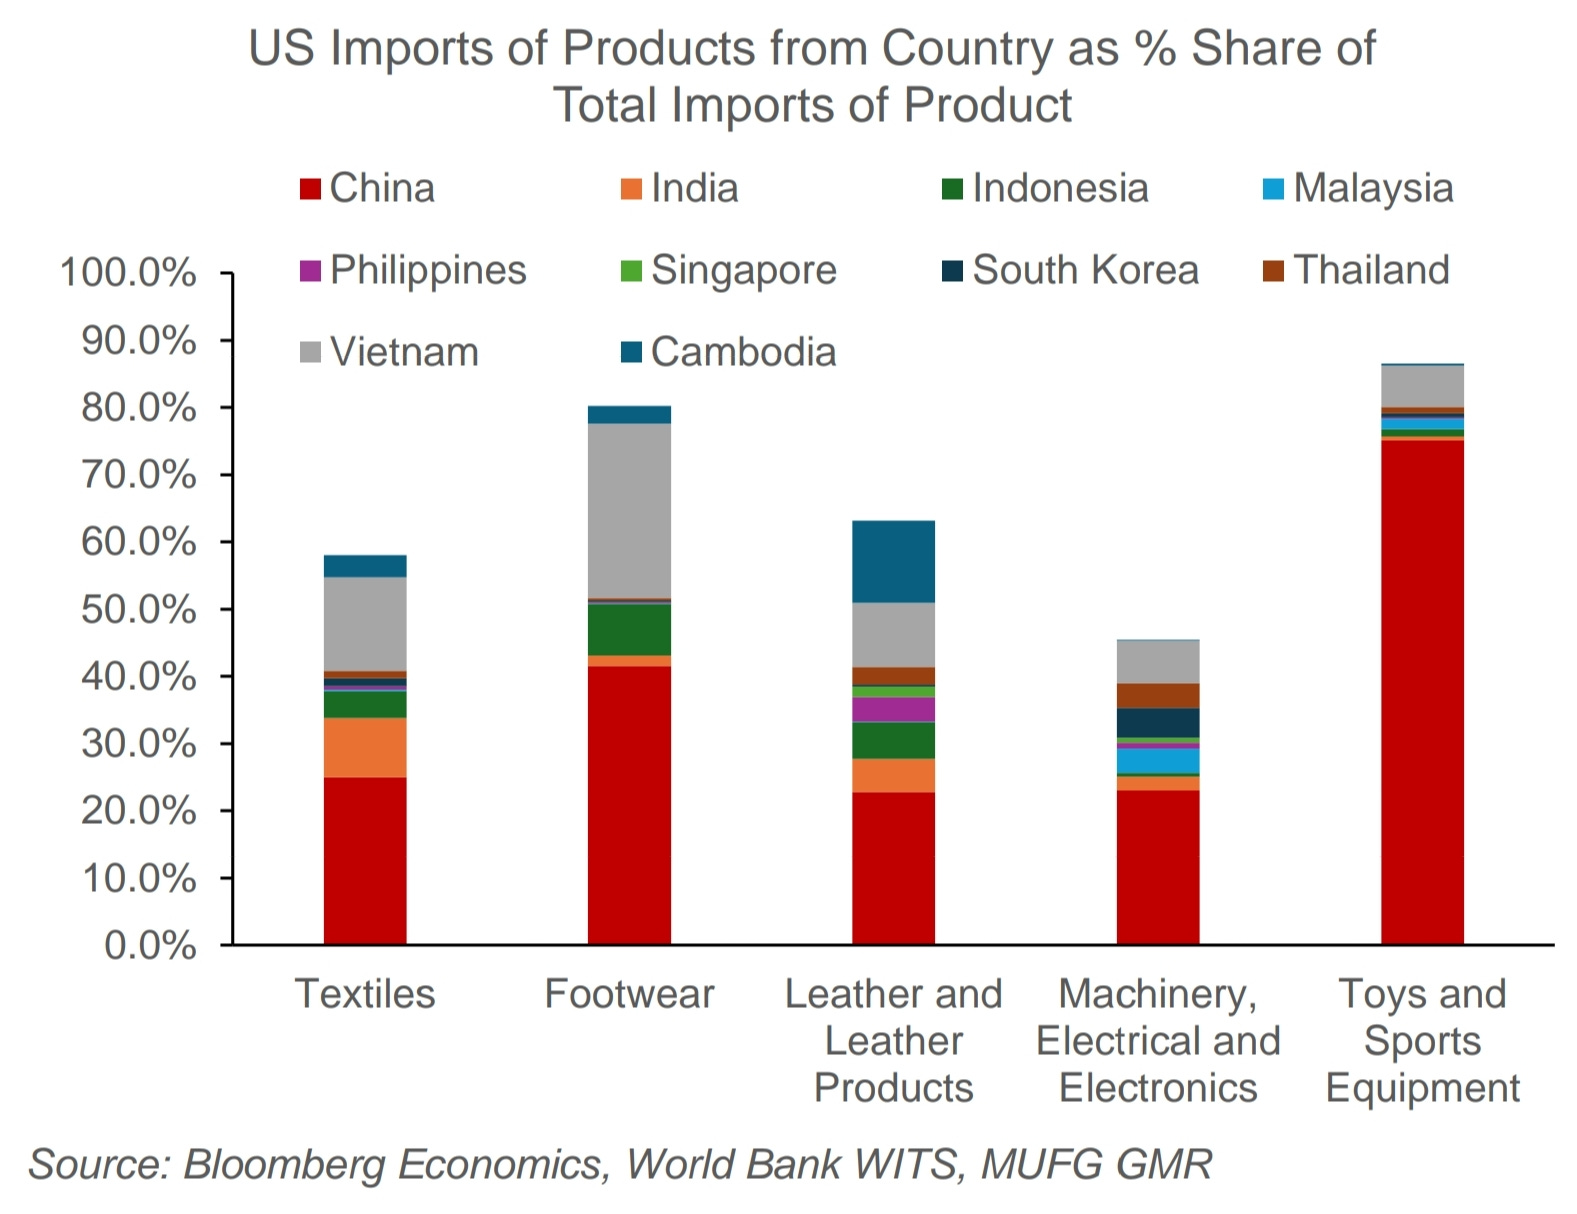
A broader view of hard to reshore industries are provided above.
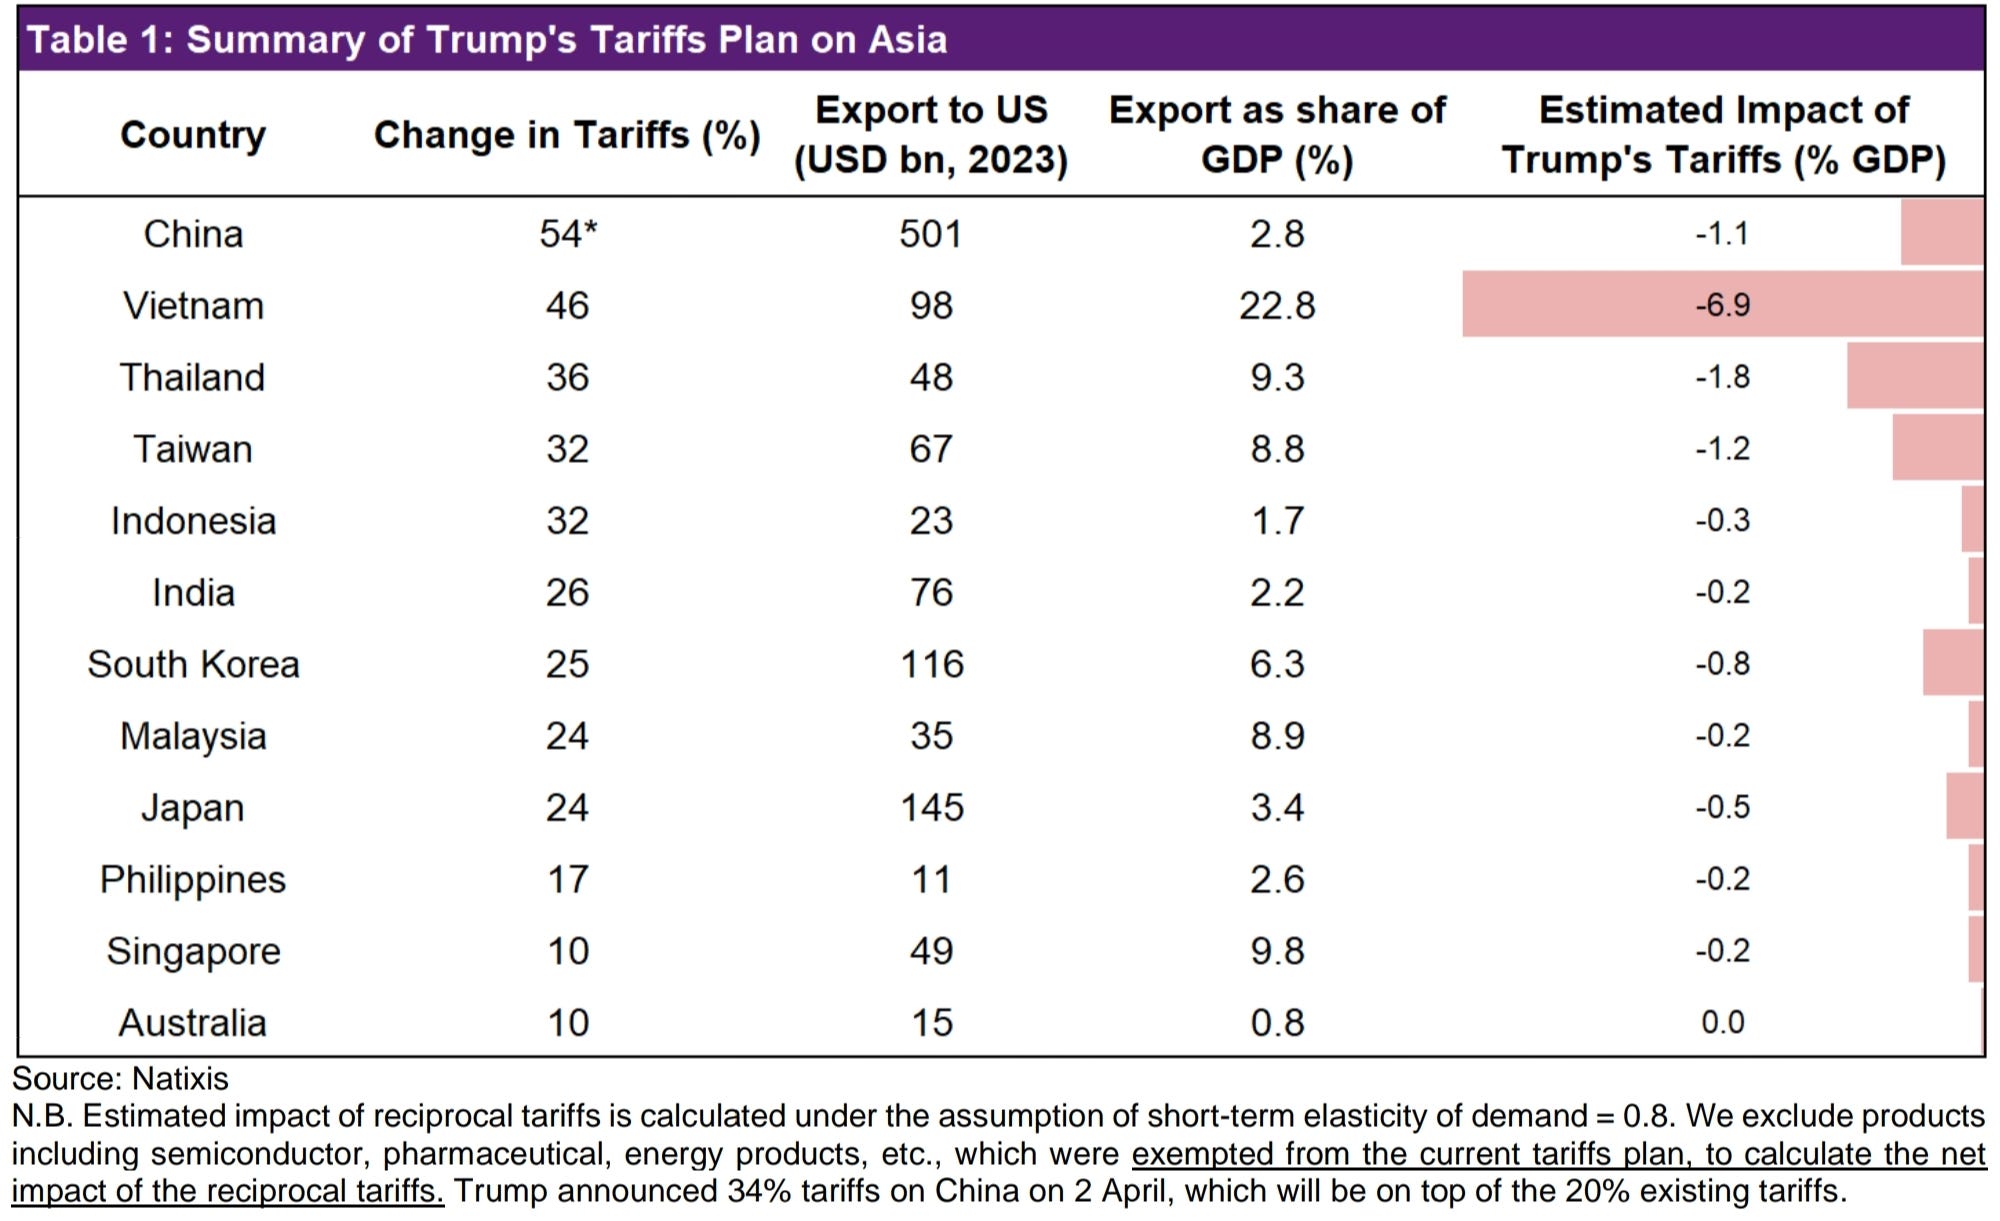
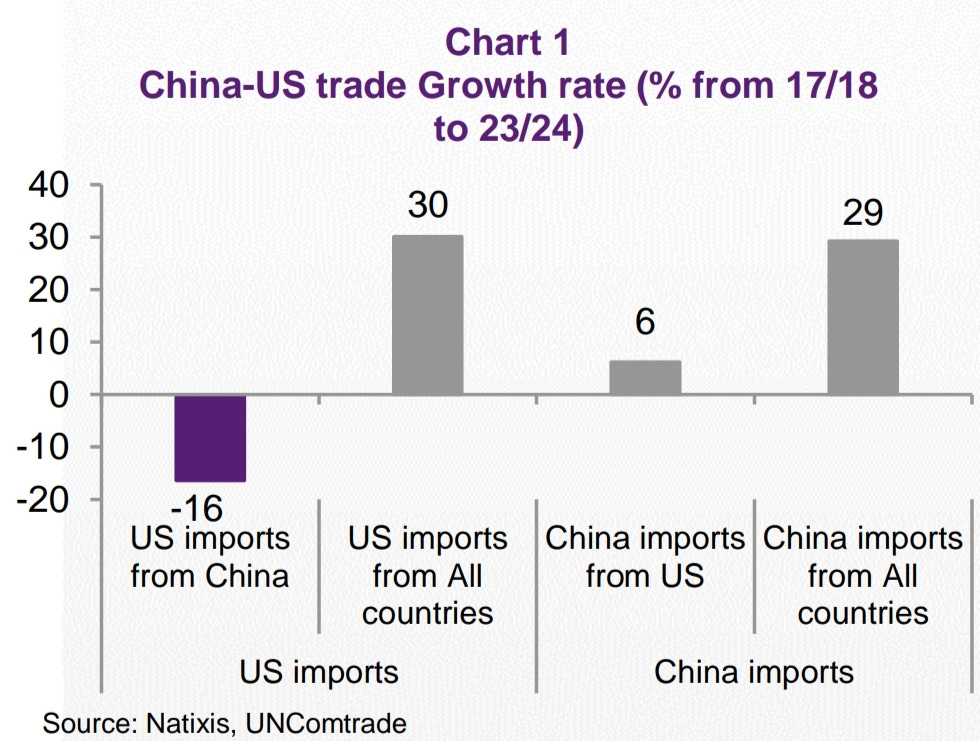
Further forecasted effects on the Chinese economy from TSLombard above and Natixis below.
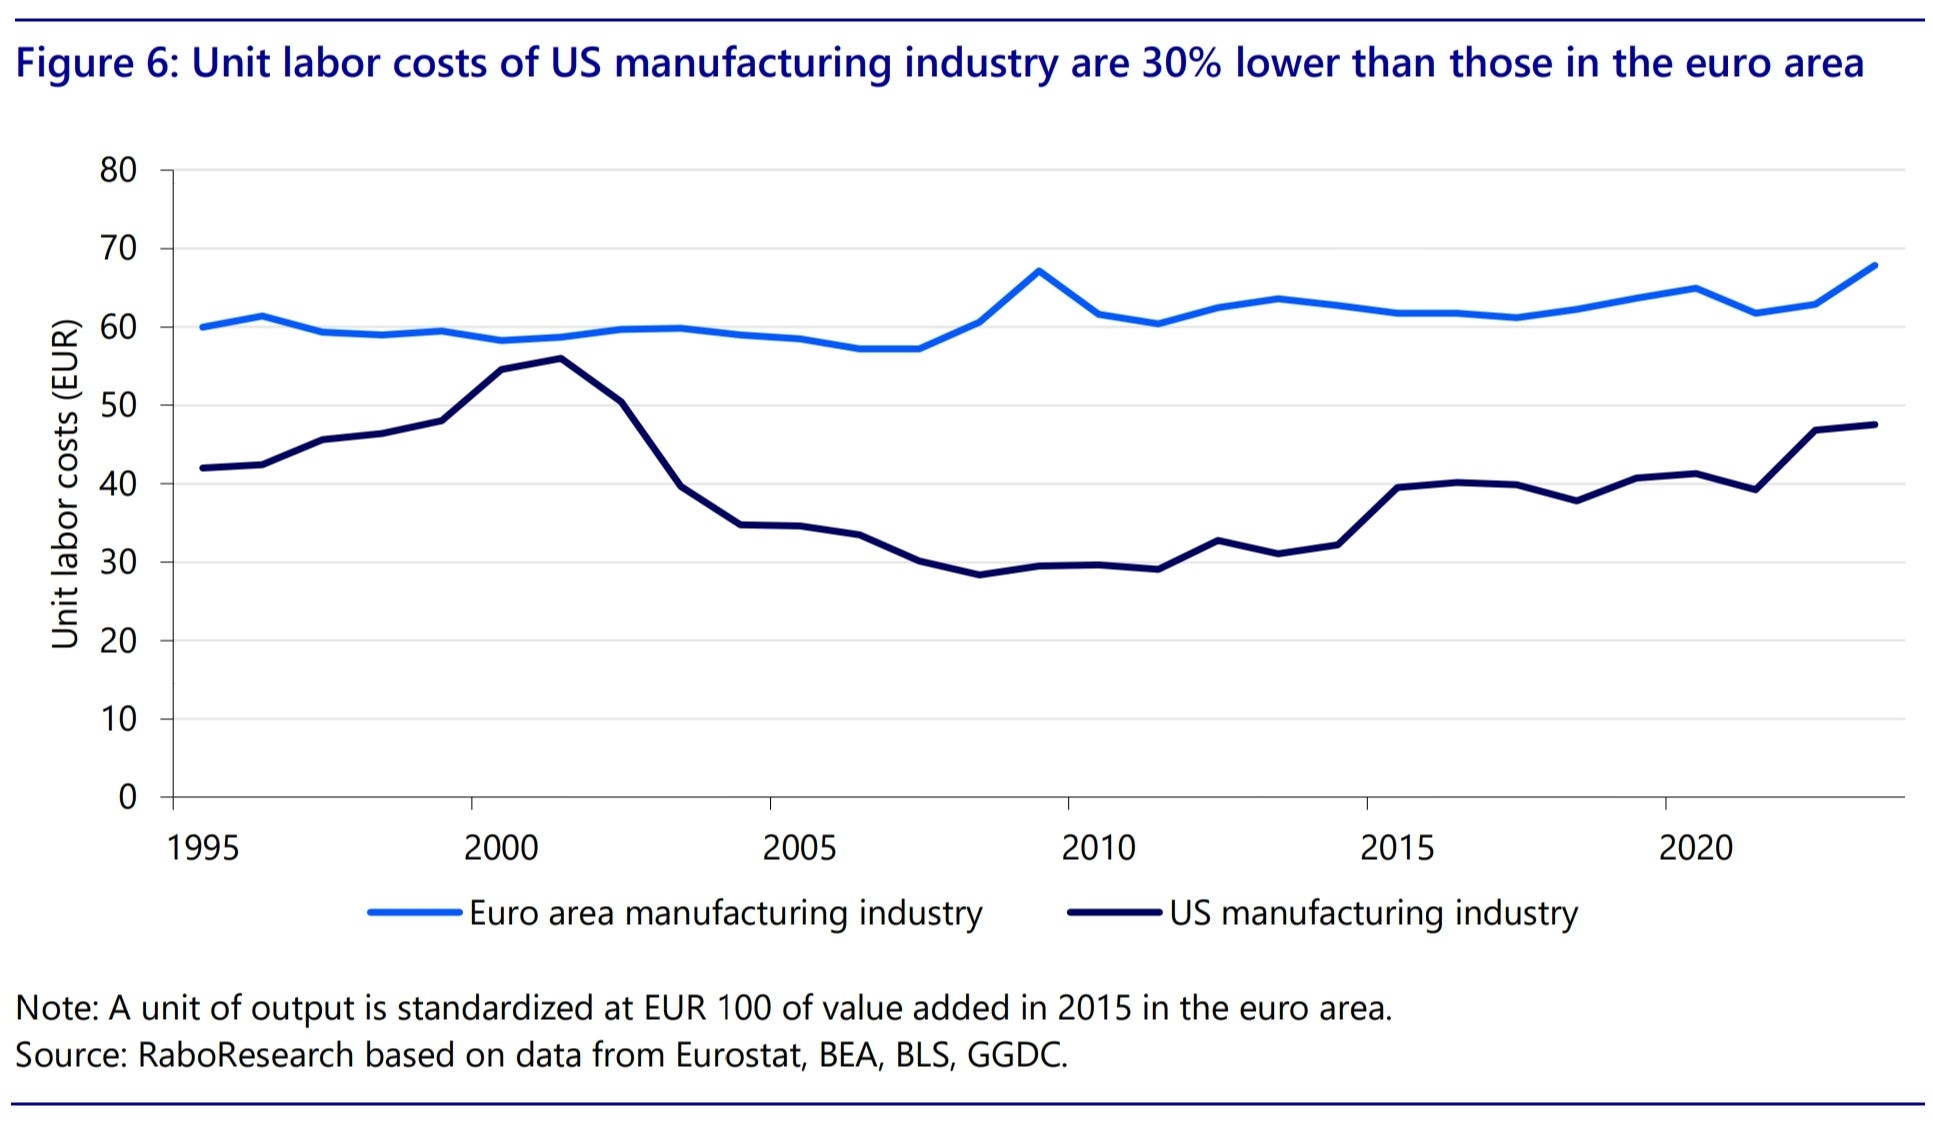
Europe faces a tougher problem when it comes to labour competitiveness…
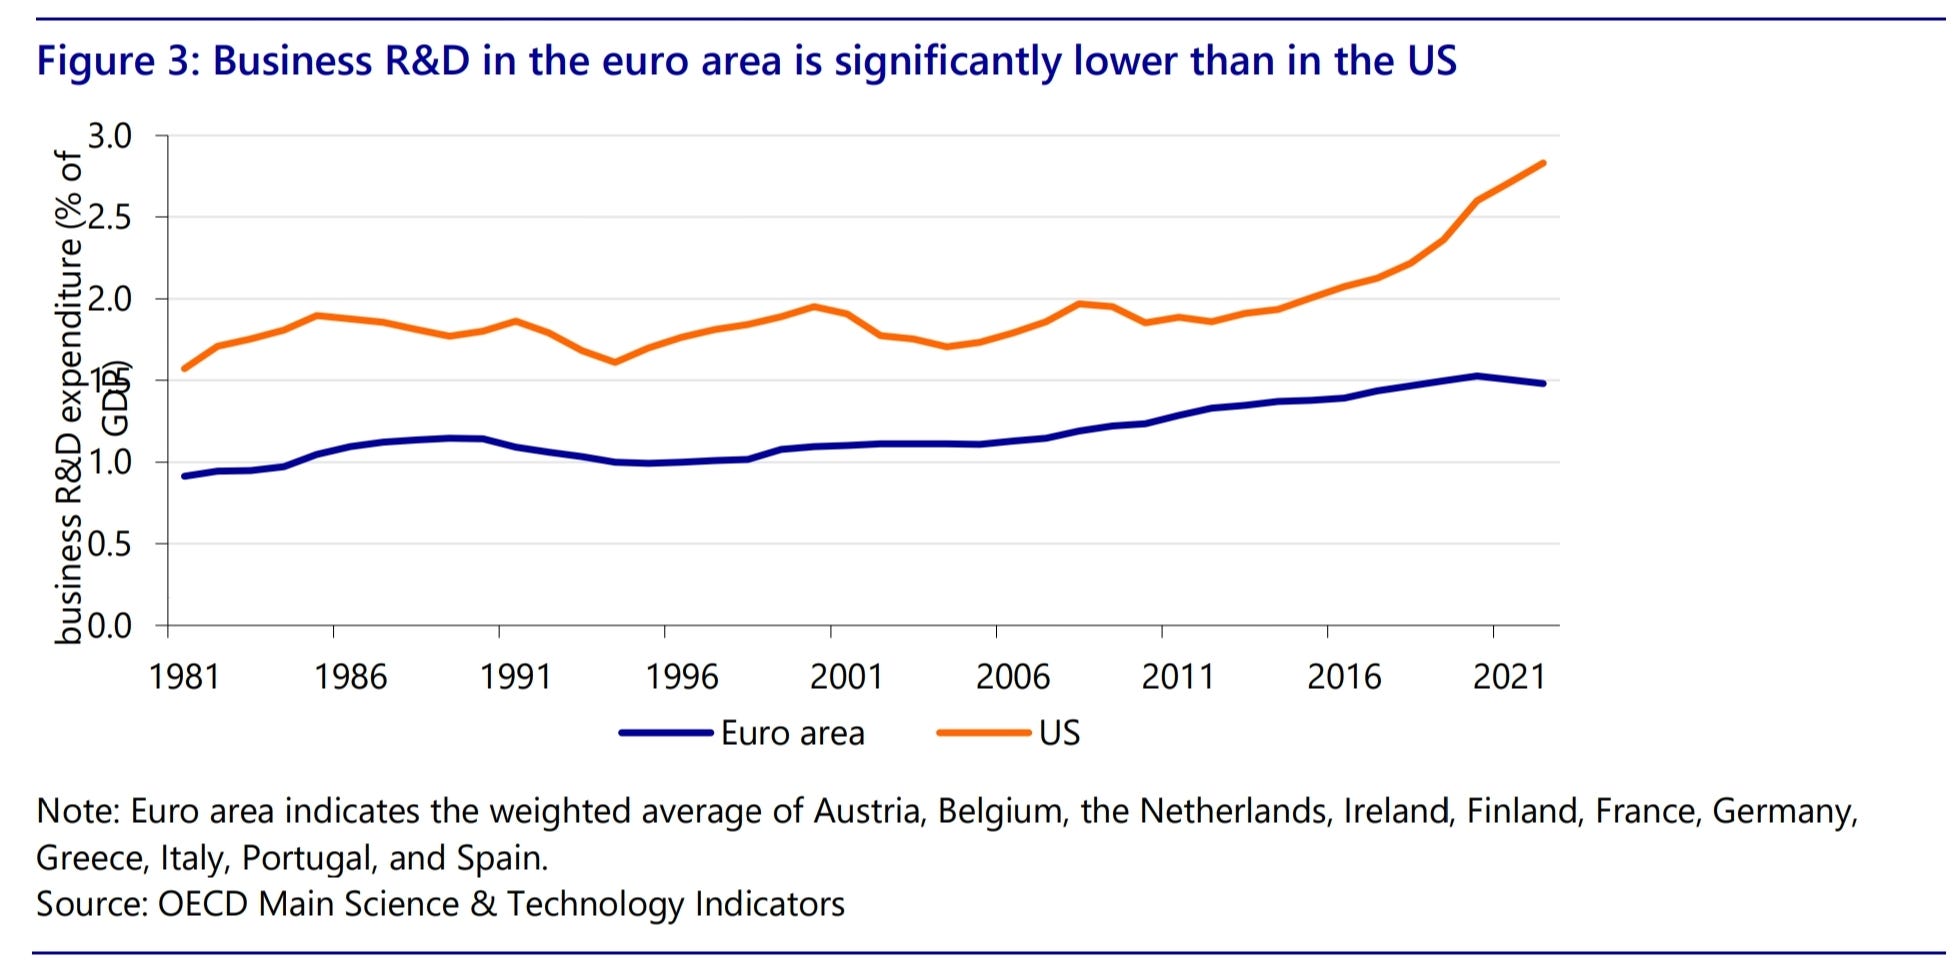
…and R&D lags significantly, although a lot of this can be explained by the divide in tech, a sector fully exposed to retaliation from Europe.
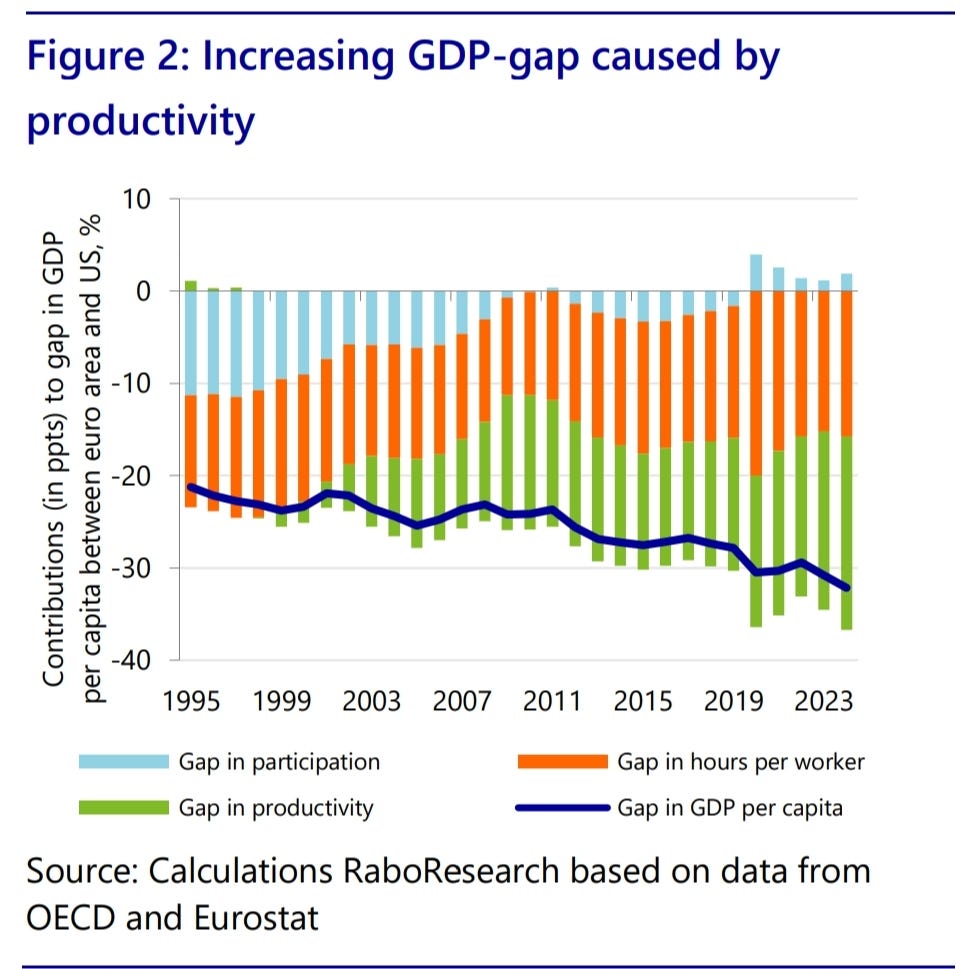
Poor European productivity can explain a lot of these trends. I’ve written about it below.

Equities
Moving onto analysis of tariffs on equity markets.
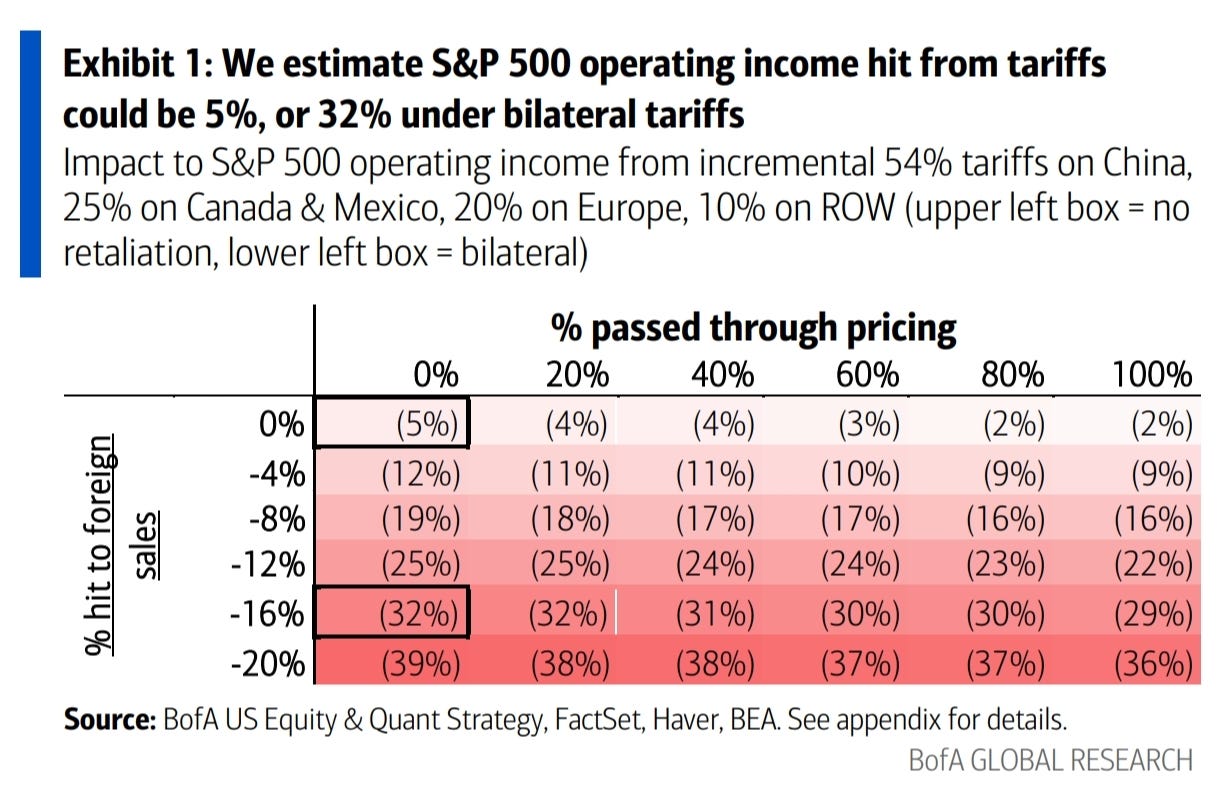
BofA provide the table above. Depending on the amount passed through and the amount that retaliation affects foreign sales, SPX earnings could be hit hard.
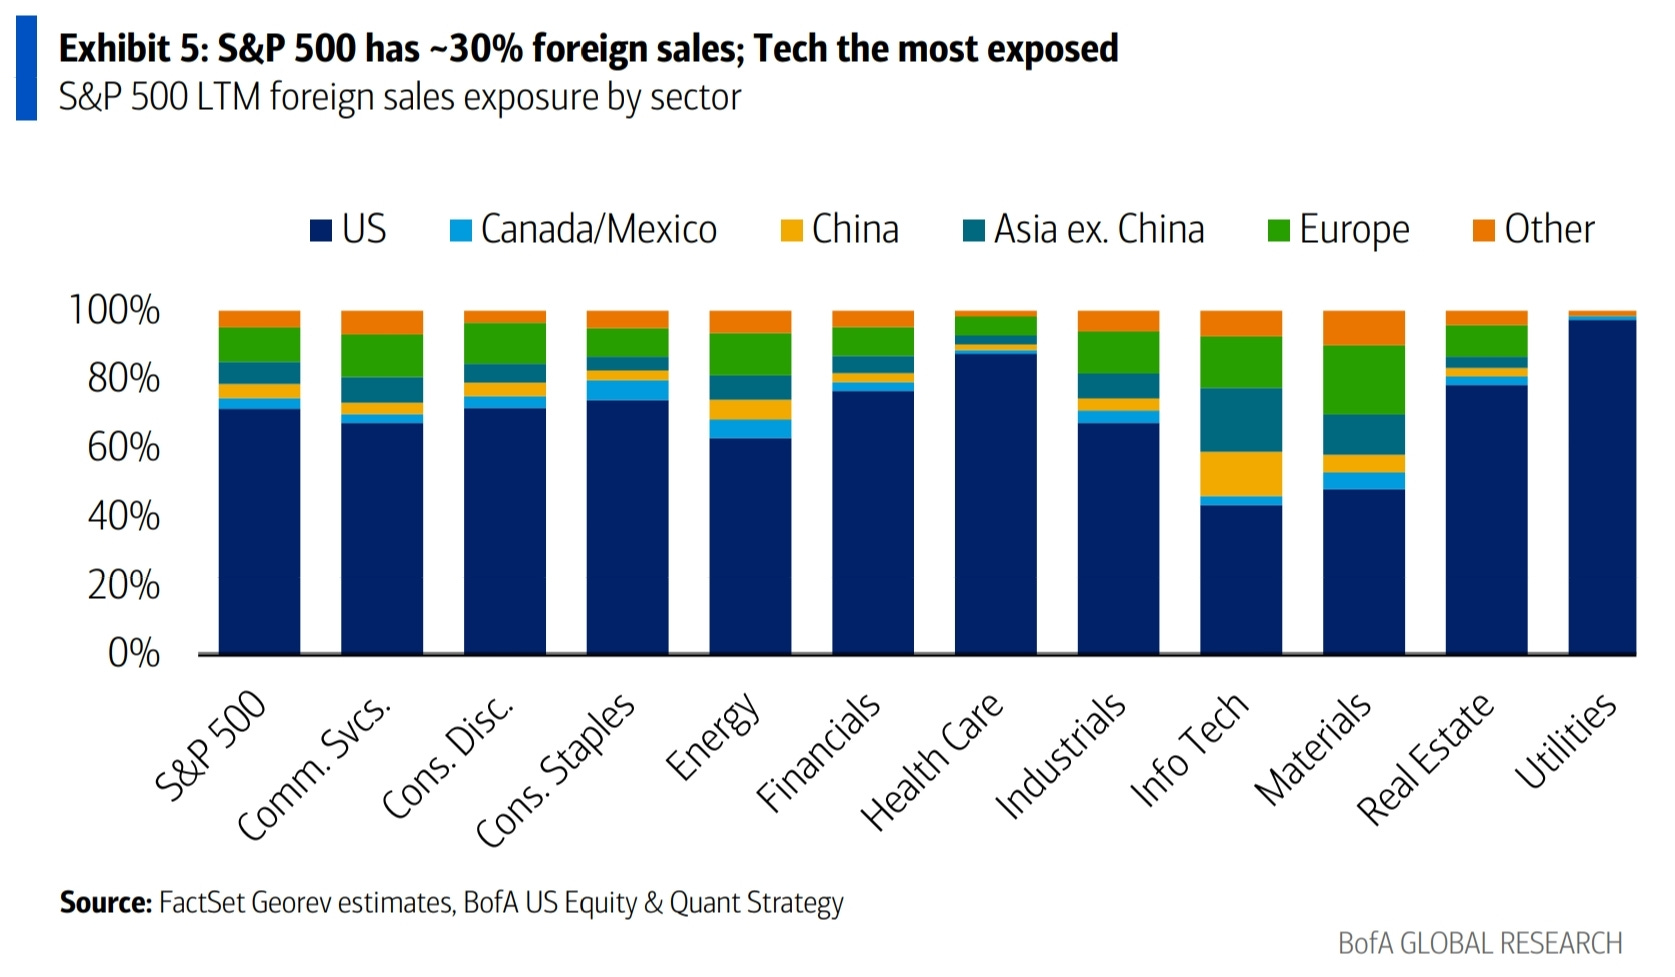
Tech is most exposed to declining foreign sales.
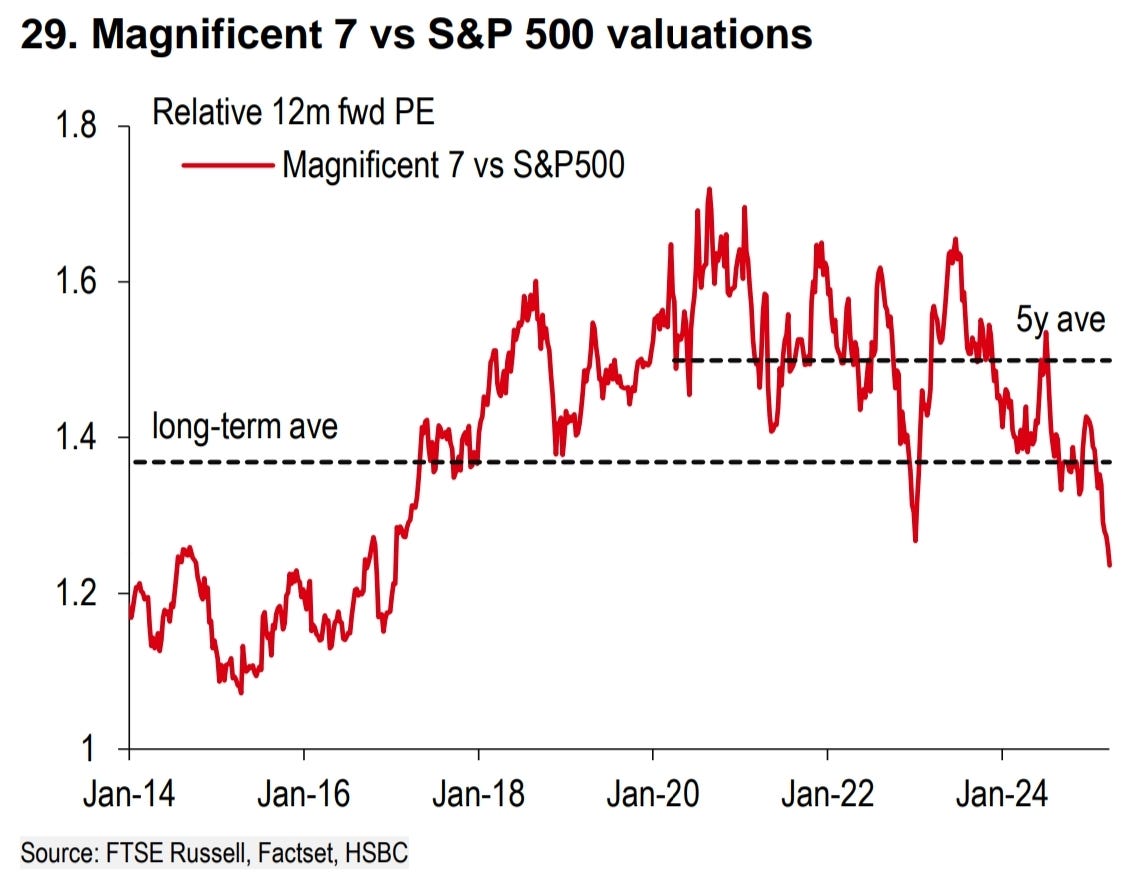
This compounds on the existing problems the sector faces of high multiples and aggressive earnings expectations.
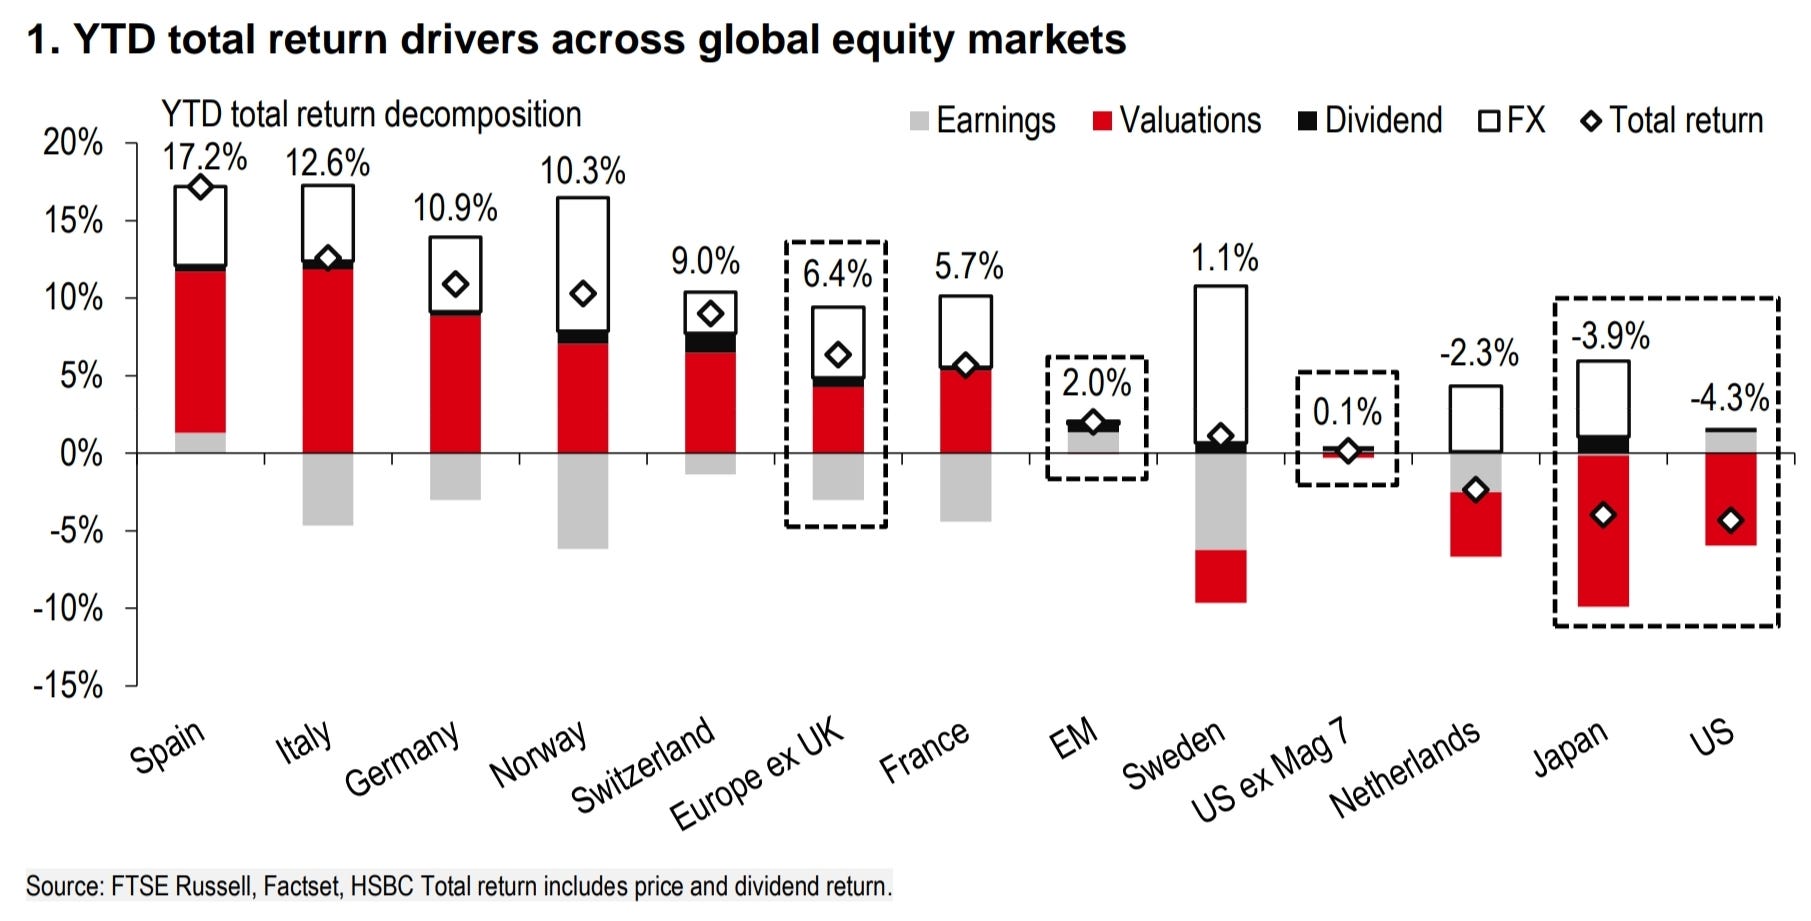
Ex-Mag7 the SPX was flat on the year before the last few days.
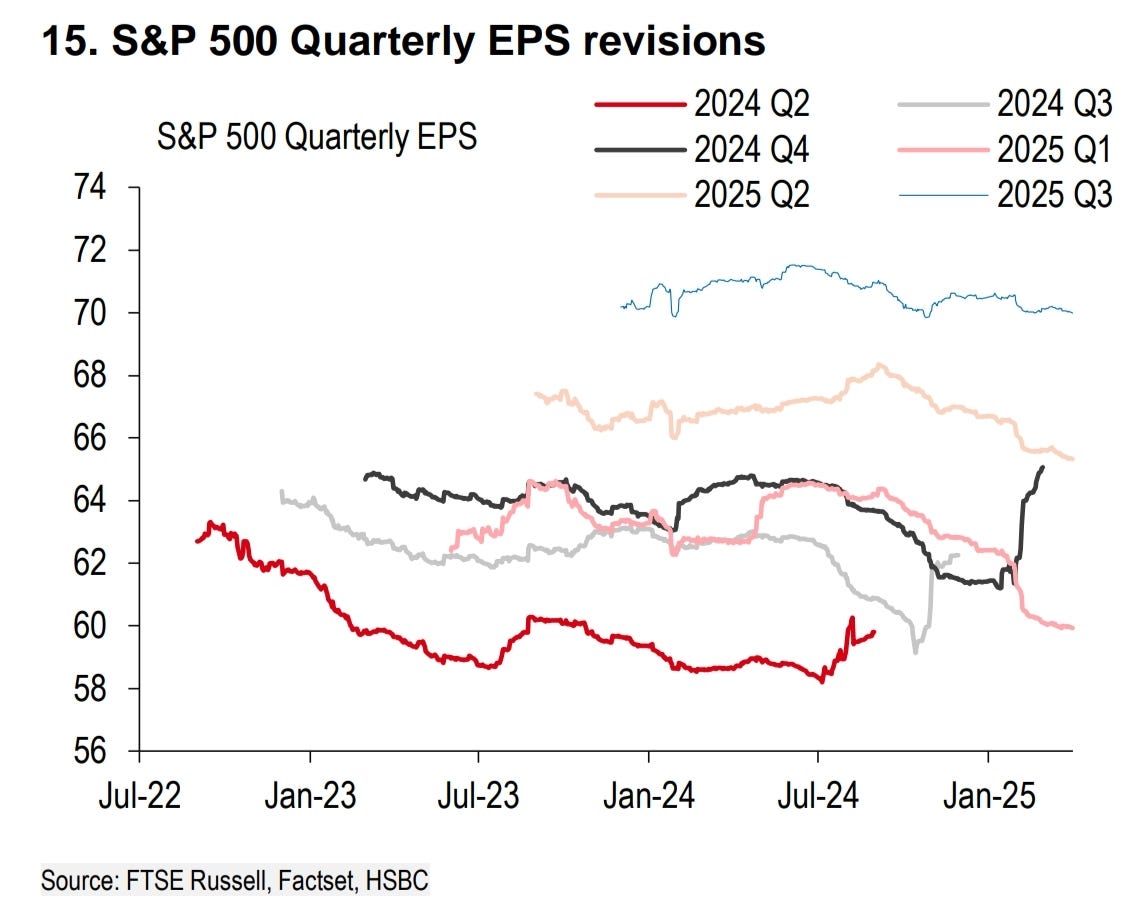
The market has been busy unwinding that big pickup in earnings expectations from Q4, 2024. These upgrades matched foreign inflows into US equities, which was the expected outperformer only a few months ago.
This is quite a chart to unwind.
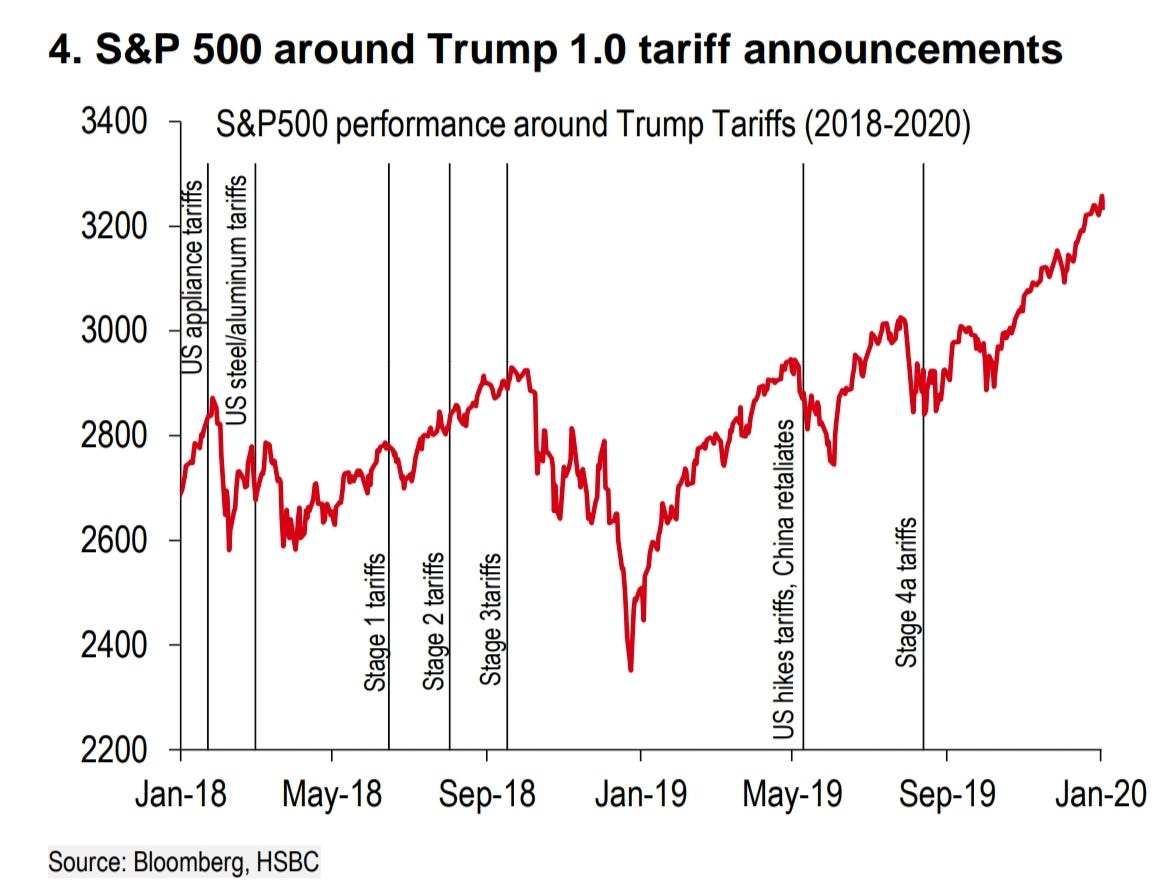
It took 3 stages of tariffs to crack the SPX last time around…but a lot more was happening at the end of 2018 globally, a narrative the market seems unwilling to jump onto (yet).
Credit

Finally, some movement in credit. Closer to matching equity vol now.
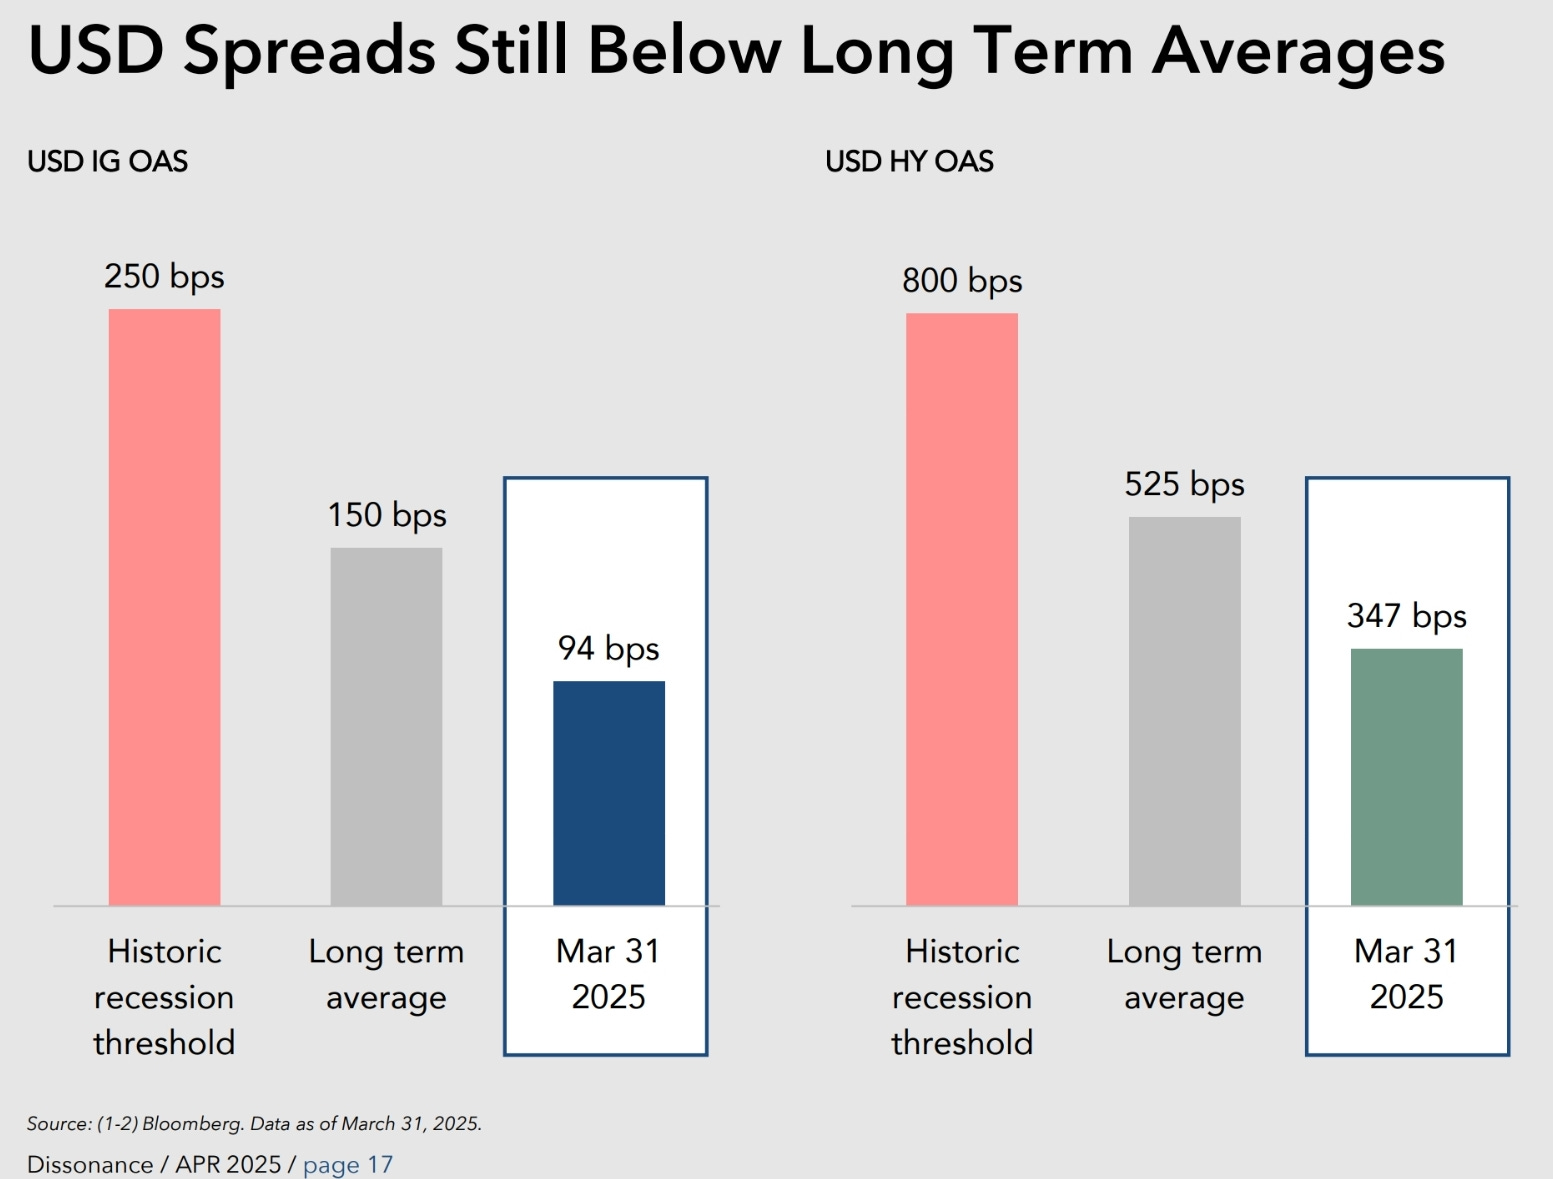
Still more room to move wider relative to history. Again, with tech as the leader of earnings downgrades, we may not have the same reason to widen as much as previous episodes now, although the retail heavy HY index could eventually make up for the difference.
FX
The USD has sold off around 3% since the tariff announcements, confounding most who expected tariffs to be offset by a rising USD as has happened in the past.
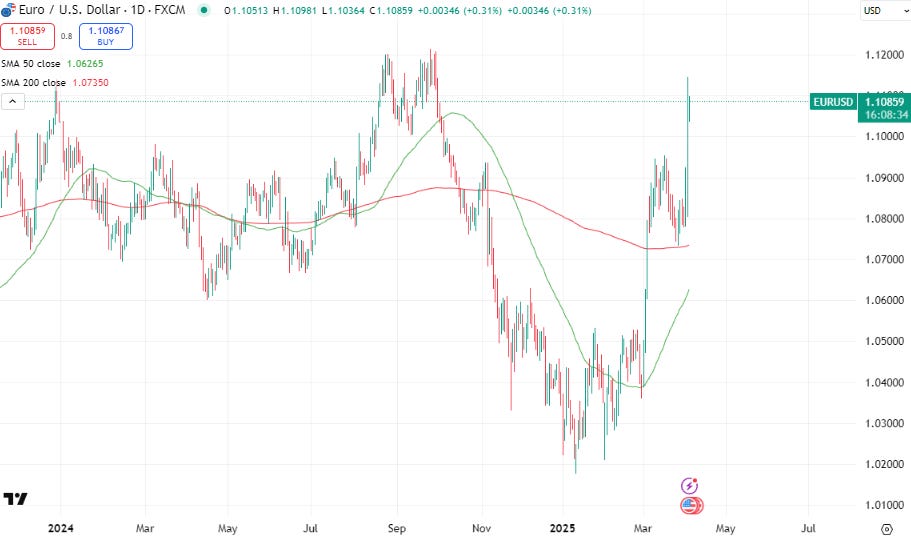
A big move higher in the EUR is probably worse for Europe than for the US, and compounds on the competitiveness issues I highlighted above. This might be what’s needed to shift the ECB more dovish after sitting on the fence for the last few months.

Little reaction in Asian currencies is even more confounding. While most have some sort of peg in place, the market hasn’t even attempted to test them.
The potential growth impact on Asian EM from tariffs would put thoughts of an EM crisis front of mind in the past…but like most other topics talked about today it is all forgotten about in preference of a monster unwind of ownership of US assets. This will eventually slow, and they, along with Europe, will then move to front of mind.
If a Chinese devaluation of the CNY in retaliation comes to fruition, I recommend you hold onto your hat.
Love the way you break things down for non-maths/economics students - Thanks!
I like your new weekly posts a lot, thank you!
I think found an error: "Core goods inflation, which supressed inflation in the 2010s ..."
After a sell-off and economic slowdown in the US, a ROW crises would follow - with a rising USD as save haven, US equities should then also find their bottom along with ROW equities i guess? After a (partial) redistrubtion of trade deficits, it will be interesting if global equity markets will rise more equally or the US will outperforme again, even if to a lesser extend?