

New format highlighting the most interesting charts I’ve seen over the past week (with a few notes along the way).
Central banking week
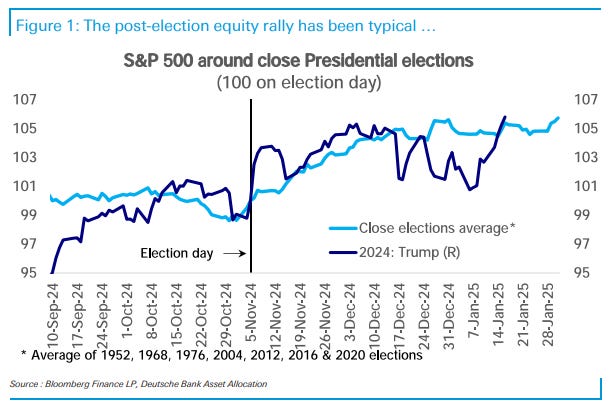
FOMC and the ECB were this week. The outcomes were mostly in line with expectations as they elicited little market reaction (and just encouraged the unloved markets from last year to just keep rallying, I’m looking at you small caps, value and Euro equities)
The ECB saw a doomer-like Lagarde strongly expressing the issues with the European (cough, German) economy while ignoring still elevated services inflation. Weak employment composition should drag this down.

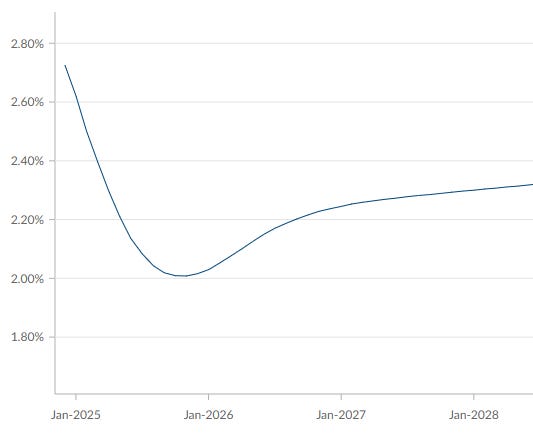
Some discussion about the “neutral rate” at the press conference revealed little…

…but the market is still betting on a nadir at 2%, with one more “easy cut” soon to deliver before the ECB has to start making some harder decisions.
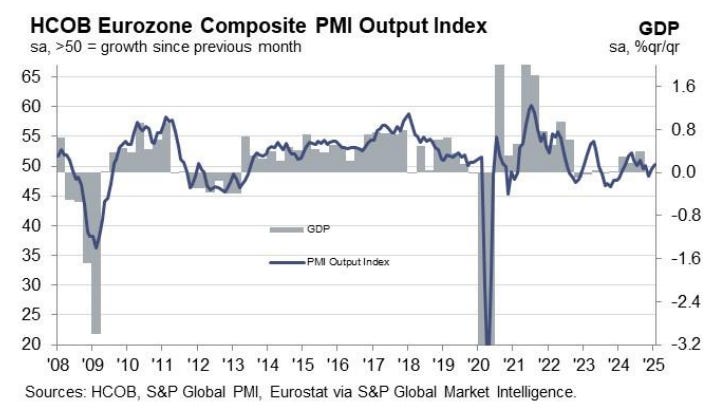
Some better news on Euro PMIs with a slight turn upwards. Will need to see a lot more to repair fall in activity though.
The Fed made their statement more hawkish by changing language about inflation but then countered this in the press conference with some confusing statements about restrictiveness. Unch.

A huge miss on trade numbers in GDP (presumably from pull forward imports to avoid tariffs) saw GDP come in at 2.3%, but the draw on inventories and net trade hid a HUGE 4.2% consumption number. Difficult to question the robustness of the economy here.

Bank of Japan hiked 25bp, with more to come given inflation forecasting from inside the BoJ.

Random charts
US equities
US outperforms because of better return on equity and less weighting to “old” cyclicals…
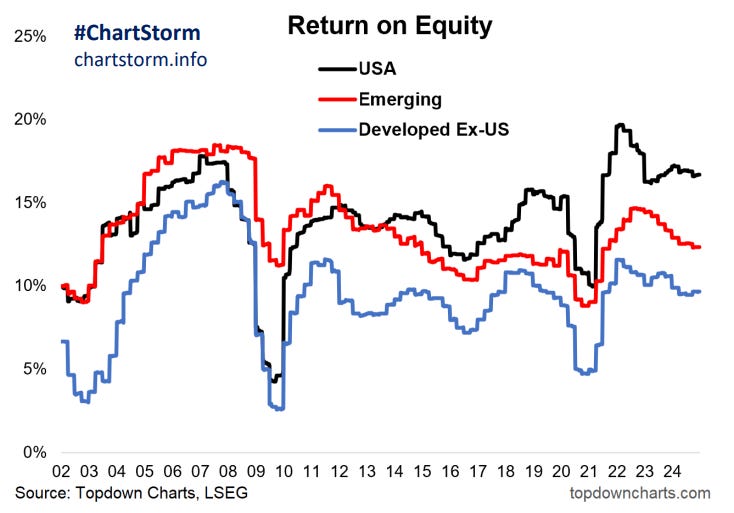

Can the pendulum move towards investment and away from buybacks?

Tariffs & Trade
China tariffs have been successful to an extent


The market is still about broad based effects on inflation

There’s a survey for every view, but this one is interesting. Max long bonds for funds.

Finally, a chart I really hate.

Great wrap up!! Two follow-up questions: (1) the market is pricing ECB cutting another 85bps in 2025, but you expect ECB cutting more or less than that? (2) why do you hate that inflation chart? because you expect inflation will be higher? Thanks!
Nice round-up, thanks!