
When forecasting doom goes wrong
The apparent ease of the oil bull call teaches many valuable lessons about commodities markets and forecasting in general

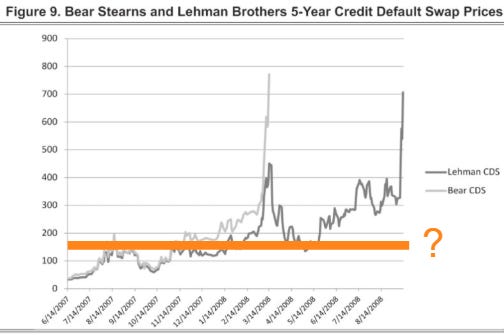
If Donald Trump and Scott Bessent were President and Treasury Secretary in 2008, would Lehman Brothers CDS have ever traded over 150bp?
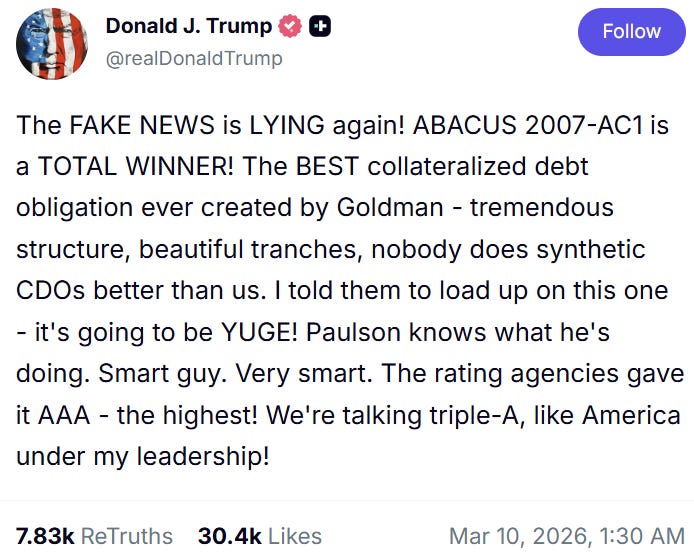
It isn’t hard to imagine a Truth Social post like the above. While I’m picking a particularly egregious synthetic CDO, the point stands. If there was always a “deal” that was “two to three days away” to recapitalise any problematic bank throughout the entirety of the GFC, it’s hard to see how any CDS could’ve traded points up front when the possibility of a merger or acquisition by a healthier bank was always on the horizon.
What Trump’s messaging combined with Bessent’s direct intervention in the market has done for oil has been to discourage speculators from taking any forward-looking view on the availability of oil in the near future. This has left only real users of those contracts, who have little need for oil that ended up being fed from large scale global reserve releases.
An analysis of where this oil is coming from is in the meat of this newsletter. But thinking about how Trump, who has taken the exact opposite approach to Jimmy Carter in totally denying and ignoring any possibility of an oil shortage, has designed a market that is strictly concerned with the availability of oil right now, is just amazing.
It’s so amazing in fact that I think the team could’ve avoided the death spiral of the banking system in 2008 by putting a stop to the retreat of counterparties due to the collapse in confidence from a rapidly deteriorating credit markets.
Speculators can cause enormous damage by exploiting the herd and momentum following mentality of markets. A market without speculators also inhibits price discovery and defeats the forward-looking nature of markets.
If the GFC were prevented by Truth Social posts, no bank would’ve failed because another was unwilling to provide it with liquidity. This alone would’ve prevented much destruction of capital.
This doesn’t come at zero cost, though. The flipside of this is that the losses from years of poor lending that couldn’t be avoided by jawboning would have accumulated and resulted in a constant need for capital raises, likely something that either the public markets or government wouldn’t put up with for too long. This may have just delayed the crisis. There are long term issues from not recognising serious problems now.
In the case of oil today, dissuading speculators has meant less demand destruction, which is good for economic activity…however, preventing demand destruction makes the situation worse when obtaining spot oil is a real problem. Short-term over long-term.
Outside of the jawboning and the market abandoning its forward-looking function, oil analysts have made errors, and it is important to focus on this in reviewing this horrible 3-month period.
Removing speculation from oil markets
While I have respect for commodities markets and have traded them from a quant standpoint for a while, I have never traded them on fundamentals. As a result, the current situation has forced me to try and understand whatever I can about the market and what works and what doesn’t to avoid getting yourself blown up by a short-vol trade in oil, for example.
I’m not an “oil expert”. But the “oil experts” haven’t really been right. Even the bearish “oil experts” haven’t had convincing arguments. Adding to this the general difficulty in getting granular information on oil markets it hard with what appears to be quite big lags in reliable data.
Sell-side analysts can write a 30-page report on a bank’s quarterly results but can hardly string together more than 5 pages on the biggest oil crisis in history, accompanied by some very vague charts and conclusions. Perhaps more assumed knowledge is required but that doesn’t seem to be the case. The reality is that the oil supply chain is so complex I don’t think anyone knows how to summarise it.
The oil bulls were very loud when the Strait first shut. The headlines were filled with $200/bbl+ forecasts along with warnings of super-inflation and even a depression.
Up until this point, they’ve been wrong. But I’m not here to make fun of them. There are lessons to be learnt from what has happened so far and how we should consider forecasting in the future. Forecasting is hard. The scale of the Hormuz crisis made that task look easy, and many fell for the bait.
Something to always keep in mind is that the easier that it seems to arrive at a bearish forecast, the harder the trade will inevitably be. This is something that is always forgotten.
The base facts of the closure of the Strait of Hormuz were dire. Roughly 13.5mbbl/day of production lost. Interruption to global supply chains from issues with urea, fertilizer and feedstocks for the petrochem industry. There has never been demand destruction big enough in history to offset this sort of disruption.
There is no getting around these numbers. But these ultra-bearish base numbers have also led to a combination of analytical laziness due to the sheer scale of the problem.
I am still worried about the Strait. But I also know where my worry stems from and it is based on your specific ideological view on how each of the players in the saga might act and react rather than any particular issue with how the oil market is trading.
Game theory was difficult to apply because the desire to win the war’s “prize” (regional hegemony) is of a unknown value to Trump. How much weight do you put on that? Does Trump care or not about US hegemony? Does Iran care enough about it to drain the world of its fuel reserves and put it in an energy crisis?
Ultimately, the differing views people have over whether there is a crisis or not will come down to the weights you ascribe to calculating the Nash equilibrium. If hegemony is all important to both sides, then we have the crisis so many warned of.
Trump’s reluctance to escalate any further militarily could indicate that he is unwilling to bear the costs that regional dominance would require. But he can change his mind.
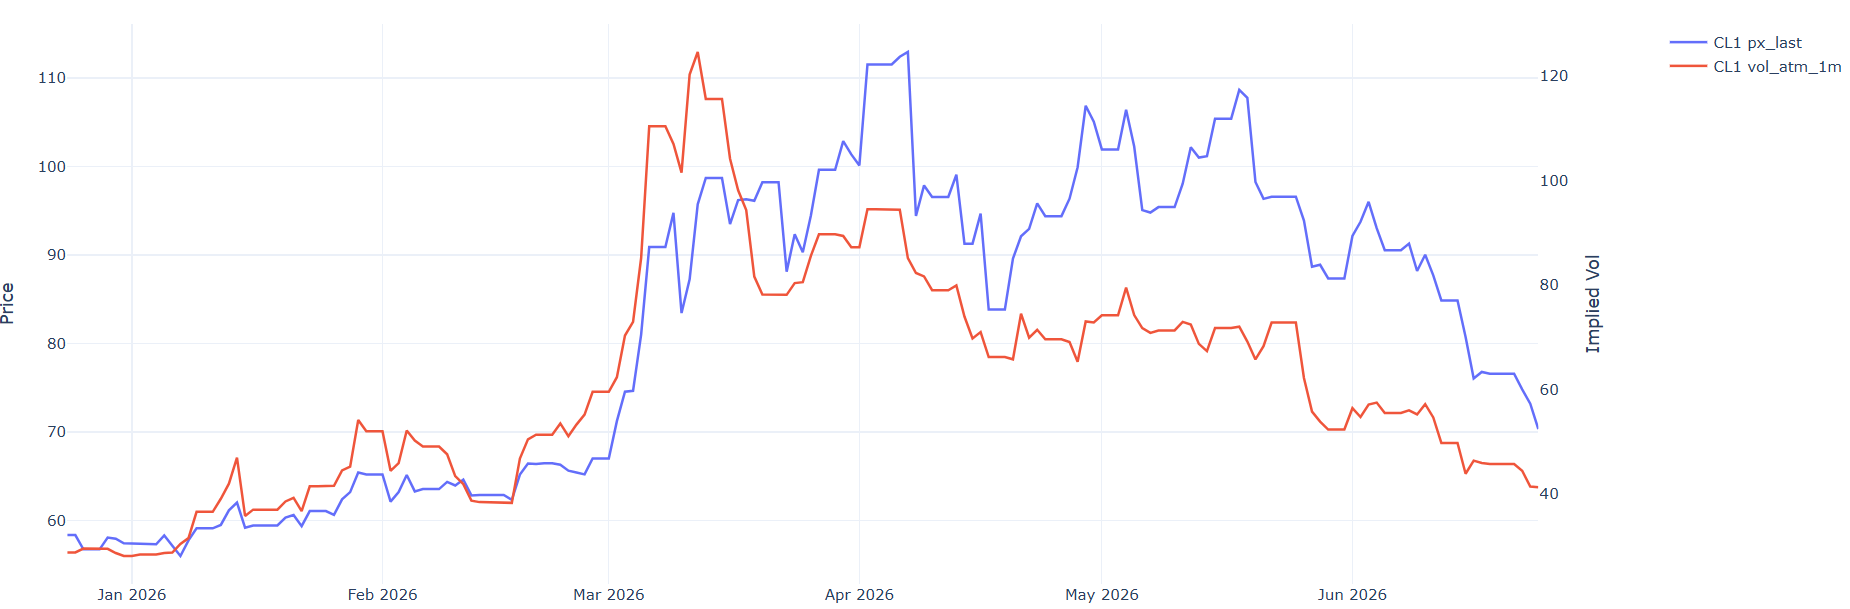
The strong correction in oil implied volatility is entirely due to the reduced possibility of escalation leading to further destruction of oil infrastructure in the middle east. The market has perceived the chance of extreme upside to oil prices to be diminished, and as such has reduced skew and at-the-money pricing for volatility in option markets.
The game theory approach for the endgame of the war ignores the main argument for bulls which was that we are well beyond the point of no-return for oil supply, given the lags in restarting production, and prices should’ve risen to levels that would cause destruction of demand for energy.
On this they’ve been wrong, and there is no denying that. Some will deflect by saying its due to jawboning and manipulation (although this does sound like cope, it has some truth to it).
At the technical level, the core reasons I can identify for the failure of this trade so far have been:
Strategic reserves (SPRs) have been drawn down globally at record levels before commercial inventories have been allowed to deplete
The US allowing mass export of its oil and product reserves
Included within this is China that has also chosen to deplete inventories (and not compete for seaborne cargo against her Asian neighbours)
Mitigation by refiners to run for longer and targeting the fuels that were most impacted.
Some of these aspects were more predictable than others. However, as a group, they teach us a valuable lesson about forecasting.
Oil analysts haven’t also in my opinion haven’t been honest with the constant slippage of their forecasts and the reasons behind them. This has been particularly disappointing, and it probably cover some analysts you would know from X and Substack.
First though, onto the underlying reasoning.
Why the trade has failed (so far)
Good data on commodities markets is hard to come by for the tourist. As mentioned earlier, relying on spotty sell-side research has been difficult.
Their conclusions have been just as weak. All the big banks came to the same conclusion, being that they expect the Strait to reopen by June 1st and there would be no problem if that happened. The Strait welcomed its first day of somewhat full transit on the 22nd of June.

Nearly every oil analyst in April was expected disaster if a reopen happened by the end of June.

Goldman’s supplied the chart above. Diesel (along with jet fuel) was one of the most at-risk fuel types when this all started in March. Currently, most of the world has enough Diesel when it wants it and the charts above attest to that.
This research, only released in early June, has effectively invalidated their previous forecast deadline of June 1, with little explanation. If there was an explanation given, it is handwaved away with vague statements.

Same goes for JPM above. That slight change in the steepness of the forecast line between April (yellow) and red (early June) was enough to collapse oil prices to $90/bbl. Certainty around opening pushed it to $70.
This isn’t to insult them, however. Forecasting, especially in commodity markets, is tough. The banks will also be hamstrung to write anything too bearish as it’s not in their best interests…but for a novice it sure makes it hard to learn where things have gone wrong.
The chart dump below mainly consists of commodity analysts and traders from X who are kind enough to share some very expensive data.
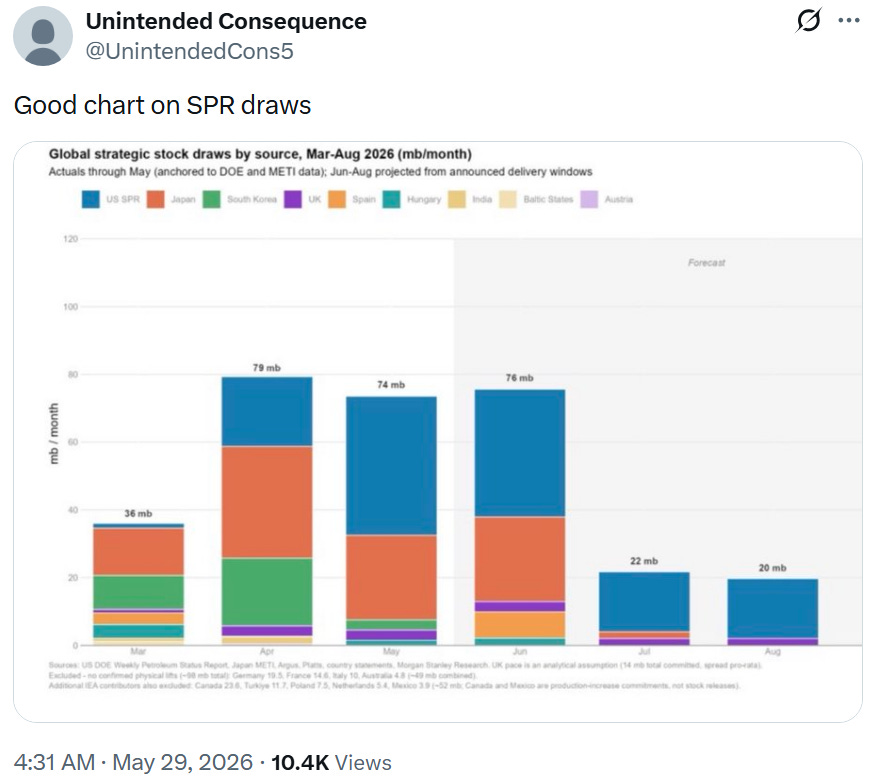
No better chart above to show the scale of SPR releases, with a breakdown by country (for those who report). The scale of draws is record breaking, and for the US, the SPR will reach a level not seen since it was first filled in the early 80s.
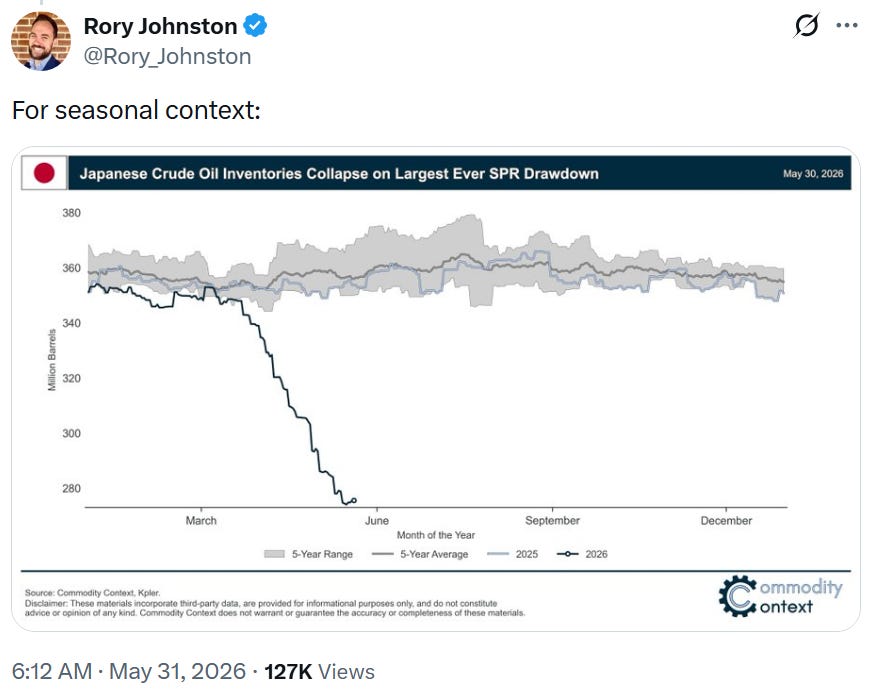
Japan stopped reporting inventory levels on refined product in March which probably means that it looks even worse than the chart above.
There is low visibility on China’s reserves, which are the biggest in the world. This means most charts you see exclude them. China has been a core reason for the failure of the oil trade, with more on this later.
This sharp release of strategic reserves was done before commercial reserves were drawn down and give the resultant charts above.
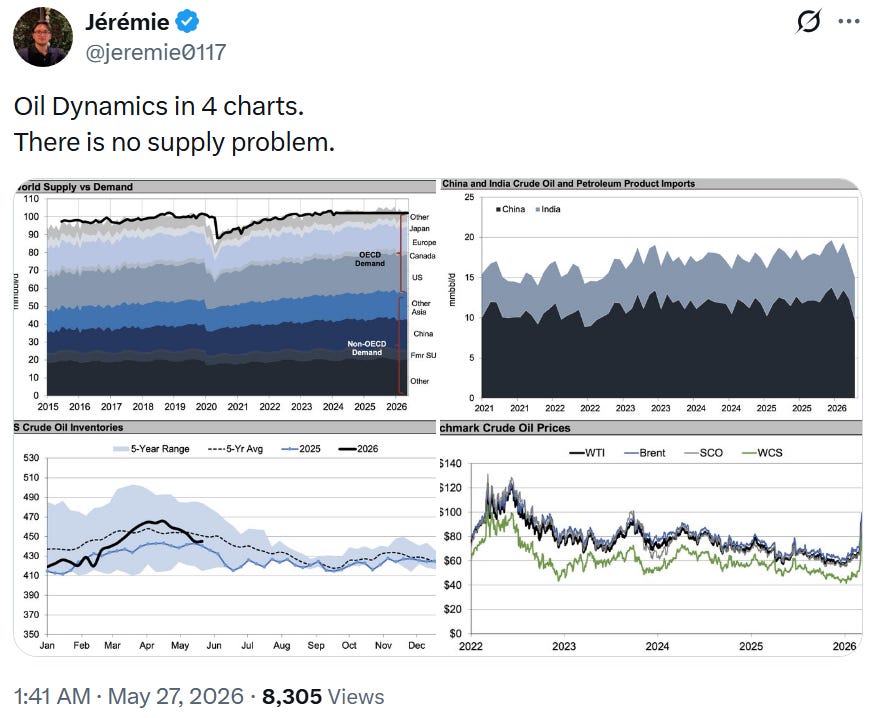
This is the best bear argument for oil that I have seen. Commercial inventories are broadly unchanged, therefore there is no supply problem.
This may seem crazy since we know that the supply of this crude and product is coming from strategic reserves. This is not how oil generally trades on fundamentals. It trades on the tightness/looseness of commercial inventories because that is where the marginal buyer or seller originates from.
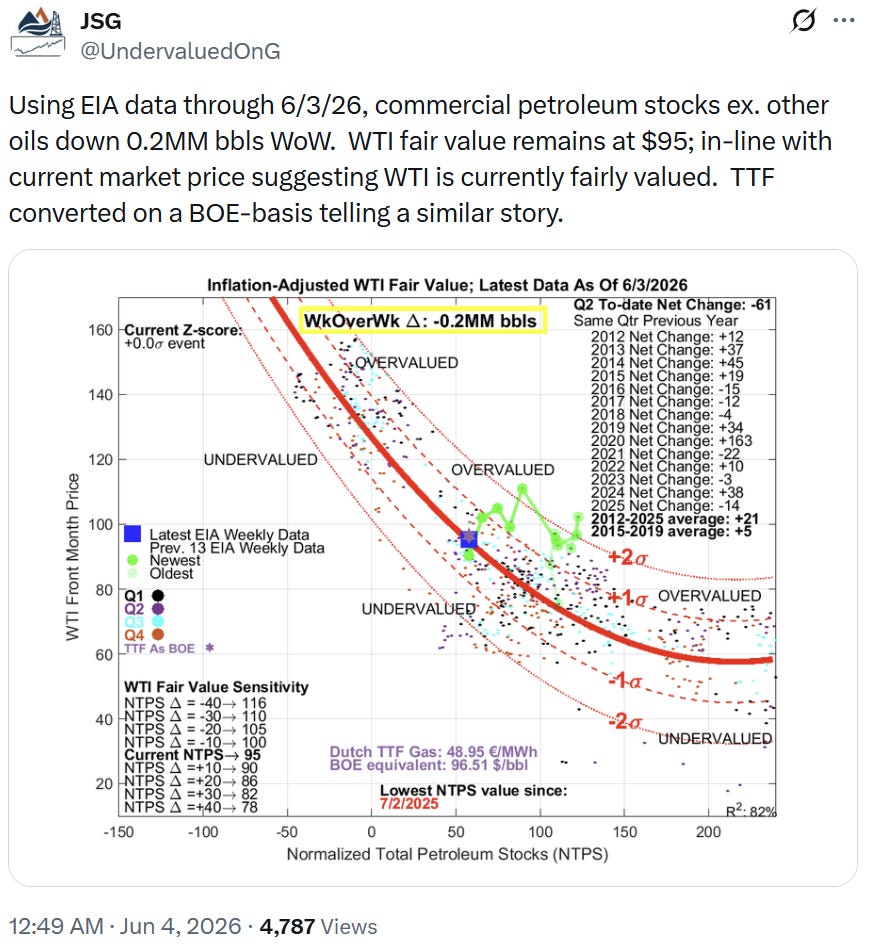
Above is a valuation model that works exactly in this fashion. It takes the change in normalised stocks and plots them against the oil price. Easy. The price has moved from overvalued to fairly valued at snapshot time. (follow the green snail trail in the middle of the chart). The price today ($69) would lead it to be undervalued.
It is important to mention that the fair value from this model is currently moving up by $4 a week. If there’s a takeaway, that’s the most important one.
Interestingly the “look at inventories, there is no supply problem” guys have the valuation models to support current pricing.
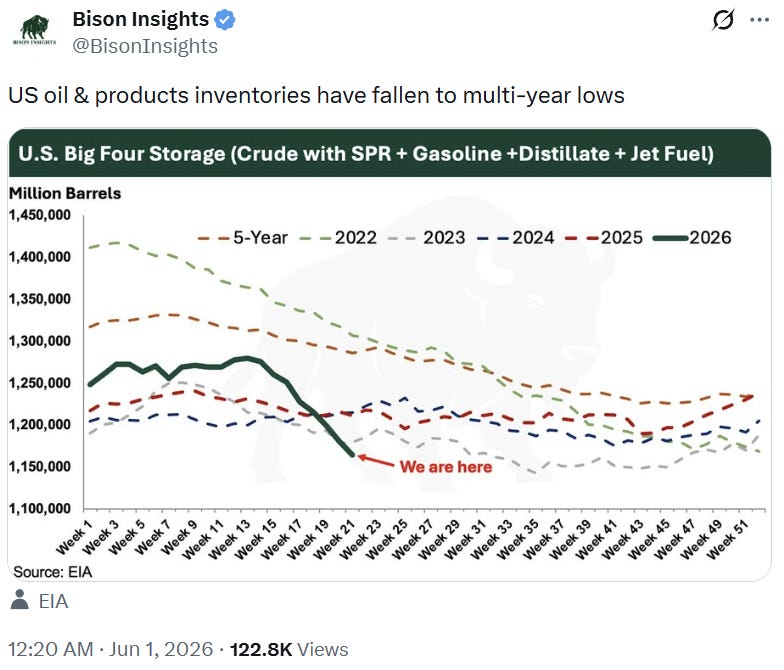
The bulls said that the imminent end of supply from reserves should factor into pricing. Having an SPR sell to empty its reserves is supply just like any other oil field is. Where the argument arises is when you get close to the point where there aren’t any more reserves to be released. Include the SPR and the chart looks worrisome.

This is the same chart including a comparison with and without China.
This effect worked in the other direction before the crisis. China was diligently filling its SPR for years, absorbing surplus production. Typical models based on commercial inventories weren’t taking this into account which is why the “oil glut” of the last few years never resulted in tumbling prices.

That oil glut can be seen in the chart above in the form of rising inventories over the year before the war. We are in sharp drawdown now; however, this is an old chart from JPM. It is possible the timing of hitting “operational stress” has moved out now, as have all forecasts.
Most analysts align with JPMs numbers on “operational stress” inventory levels with an example below (X: @tleilax___) :
2.8bn crude line-fill and tank bottom
1.3bn crude and products on water (in transit)
2.4bn products line-fill and distribution channel
On the other hand, these numbers are so big picture that I lost confidence in them. Stress levels obviously exist for an individual installation, but as a general number across most countries and types of fuel? That’s a little more doubtful. If you are wrong by 0.1bn (100 million barrels), that means another 20 or so days before anyone feels any stress. Error here matters if you’re trying to time puts on the S&P500!
Then you have the question of how fast we get there. In the same JPM chart the footnote indicates 5.6mbbl/day of demand destruction.
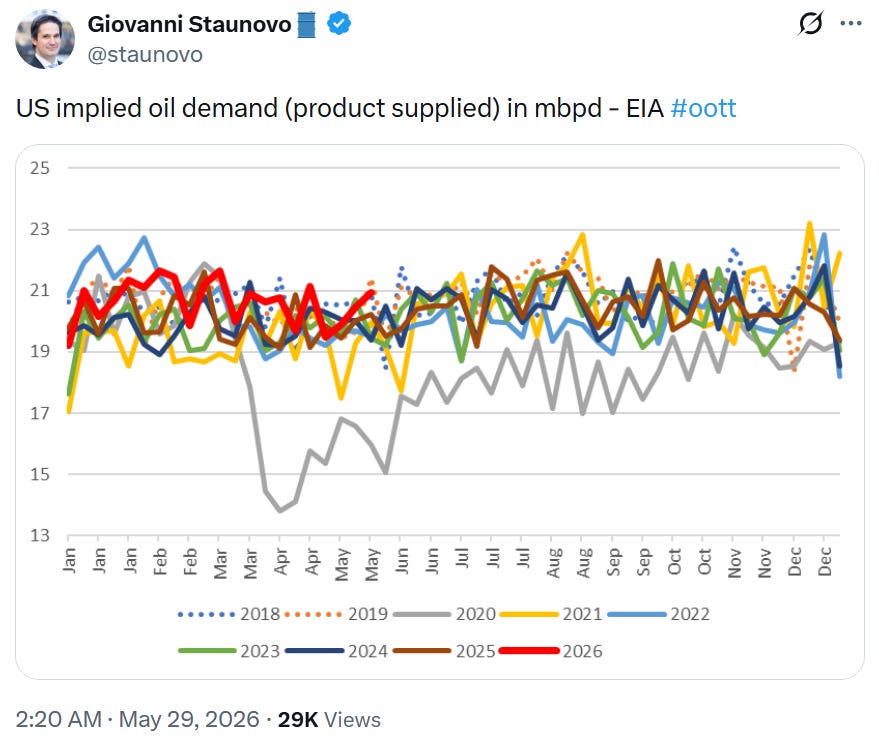
The EIA says there has been no demand destruction in the US. There have been flight cancellations and total flights flown is definitely down this year. Outside of this, developed nations have little demand destruction at this point as prices have moderated greatly. Emerging markets are a different story. There has been some, but nobody seems to have a real handle on how much it is.
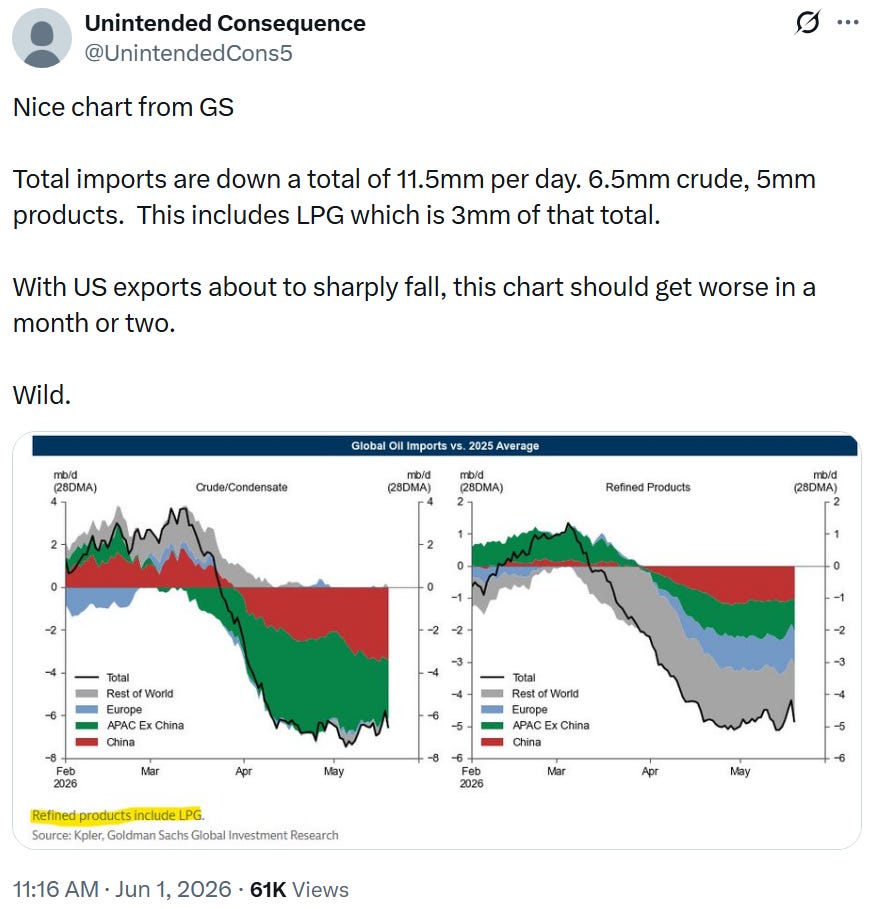
Since the US didn’t import much previously, and demand is stable, where is this huge SPR release going? Out through exports!
The charts above show the magnitude. At 6mbbl/day it goes a long way to solving the Hormuz gap.
The next puzzle piece is China.
China’s “charity”
I’ve been writing about how exposed China is to the Hormuz problem and how they are incentivised to resolve the crisis purely because of their economic exposure to trade through export growth. Their neighbours in ASEAN are about 20% of China’s total exports which has been growing at 13-15% p.a. Take this away and China’s GDP growth is severely impaired.
I expected them to help diplomatically. I didn’t expect them to help in the simplest way imaginable.

China decided to start drawing on inventories while disincentivising Chinese refineries from operating through price caps and export bans. This choice made oil available to their neighbours to buy at elevated prices while they drew on more cheaply sourced reserve barrels.
Whether this was done intentionally or not is unclear. A portion would’ve had to have been forced due to the blockade of Iranian oil of which China was the main buyer. Either way it took a lot of pressure off the market and eliminated the chase for physical barrels that reached a panic state around mid-April.

Morgan Stanley presents the argument above for the return of Chinese buyers of cargo buy late June. There certainly won’t be a shortage of traders paying to attention to what they’re doing.
China’s import deficit is probably around 3mbbl/day making the chart above a bit light. This sort of draw makes short work of that year-long inventory build.
Keeping it simple for us novices
China curbing and US pumping.
These are the only 2 numbers that really matter when trying to understand while the oil trade failed.
2-3mbbl/day inventory Chinese inventory draw and 6-8mbbl/day export growth in the US is more than enough to cover most estimates of the Hormuz gap (when including reasonable demand destruction). No physical buying pressure.
Add-in all the stop-gap measures such as missing refinery maintenance to keep them running and tilting output mix to diesel and jet fuel over gasoline and there appears to be fuel everywhere, outside of some emerging economies which haven’t had their issues spread anywhere else.
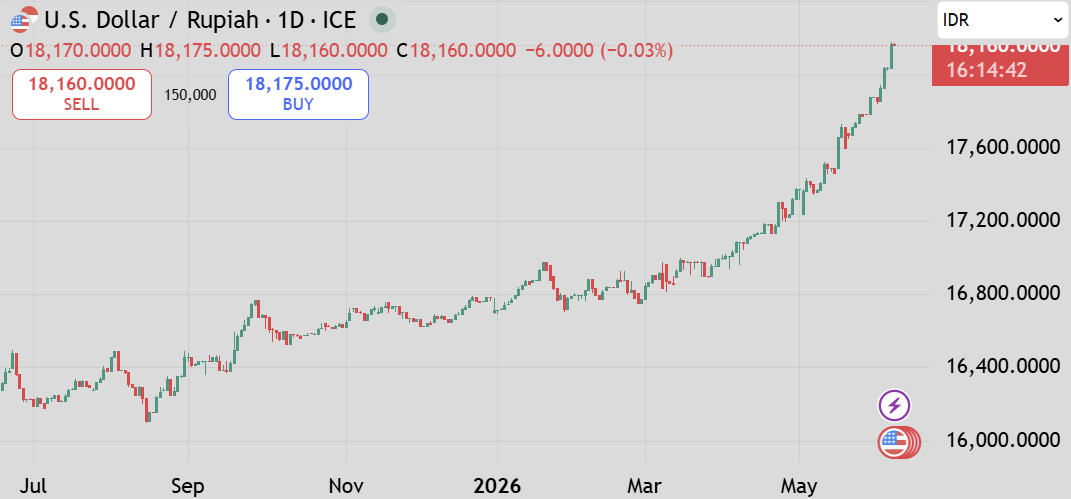
This might be changing with the devaluation of some EM Asian currencies. The Indonesian Rupiah is collapsing as hard currency reserves fall as a result of elevated oil pricing.

Singapore, a hub for Asian refined product, experienced large drawdowns last week. This is volatile data so could reverse but is still a concern for EM Asia.
However, without real physical buyers the game of speculation and manipulation ebbs back and forth. In real markets, like those for commodities, only real-world buyers and sellers matter in the end.
If we were to learn a lesson from what’s gone wrong so far, it’s that the stop-gap measures will be pushed further than most expect. They’ll find ways to stretch things out more than any forecaster would think possible.
Where they are right is that the reserves will run out one day and what we have won’t be able to be stretched any further.
But not to worry because…
The government will save us!
Those that say they have no interest in the Strait or the war fall back on the understanding that the government of the world will not create a situation where a global depression would be a possible outcome. Those days died with the actions congress took after Lehman Brothers was allowed to fail.
I wrote a piece in April outlining that it was either no deal, or capitulation. We got a deal that was essentially capitulation. Government did what it needed to do to avoid collapse, at what could be a great cost. Trump himself said so, commenting “what was I meant to do” when he was well away that everyone was weeks away from running out of oil.
We’ve been shown that western governments have no stomach for economic discomfort, so much so that certain taboos have forever been broken in the years after the pandemic. A politician running on fiscal responsibility will be slaughtered these days, where it was once the default position.
I’m not sure if those with the “no worries” approach to the Strait have concluded this by logic or just really don’t care. Good on them if they don’t care I suppose.
I generally have this approach (and have written many pieces about the omnipotence of government) but got caught out with the “closure to disaster” timelines.
Once I started to see timelines slipping from the bulls that was the first indicator that something wasn’t right. Then it moved to the attacking replies from certain analysts when asking about those missed dates.
That’s the point where you have to start asking if these people have enough information to make these forecasts. Just “the math” isn’t enough. It may be enough eventually, but that date is could be July or August or September. Until then the world has to keep on spinning.
The oil forecasters have burned so many that it may end up being an example of the boy that cried wolf, which will end up making the actual timeline one that truly shocks markets.
For them, the war continues. It is their job to be aware of the risks, and those are still present. The “opening” of the Strait is currently just another reserve being released with production still shut and hardly any tankers willing to head in. We still watch.
Will any temporary shortages to lags on delivery timelines affect the market? I would doubt it. If it was willing to look through April, then it will surely look through any short disruptions.
War can restart. This would require a significant change in both rhetoric and action from the US for the market to price this. It seems unlikely, but who knows if Iran want to start exerting control.
Forecasting doom is almost impossible even if it looks easy
The key moment before Lehman Brothers fell in September 2008 was when the UK government asked the US government for guarantees for Barclays to acquire and save the investment bank. The US at that point in time were worried about the moral hazard associated with saving another bank and decided not to give those guarantees.
Picking that this would happen in this moment when bailouts were organised for smaller and much less important banks earlier that year would be impossible even if you had all information available to you.
Forecasting the Hormuz effect is similar in a lot of ways. What the US government and the Iranian government choose to do will ultimately determine whether traffic passes through or not with the next 2 months.
Given the forecasting failure of the oil community on the timeline for the closure to have real effects in terms of shortages, there is some doubt that this timeline exists. It’s probably because we don’t know enough about the global supply chains that persist in energy.
The successful intervention and jawboning out of speculation have greatly minimised the problem. It can never remove the physical limitations.
If Trump had jawboned the GFC, he (without a doubt) would’ve been successful in stopping runaway bank failures. However, it is also true that, like with the oil market, physical and financial reality must always push prices to where they need to be.
Governments learned this during the crisis and in some regions acted right away - banning naked shorting of CDS and bank equities. Jawboning is just an extension of this.
Despite the oil experts getting it wrong in April, there is still likely some time until that physical reality can mostly be avoided. Nobody really knows how much time there is.
This is what made this known-unknown so dangerous, and while forecasting doom is futile, being aware of doom doesn’t cost too much.
Never go one-way with your positioning and be OK with opportunity cost if you get it wrong. Your portfolio should be a reflection of the probability of doom. When that probability gets too high, force yourself to put some risk on. This means you can be bearish but live to tell the tale if you are wrong.