Charts & Notes: Those payroll revisions were important
US economy equilibriums and potentials are changing
I ended last week’s note with a point about economic data being at best an estimate of what’s going on in the economy.
Who was to know that the BLS would deliver a monster revision to the last 3 months of US employment data that would bring into question so much about the US economy.
If you’ve read any of my longer essays, I’ve been calling for supercharged nominal growth, firstly here…
…and more recently here.
And to be fair, I’ve been 100% right (sorry for the self-promotion).
The core of the thesis was the expansion of both government and private sector debt driving the nominal expansion of the economy, taking equity markets along with it.
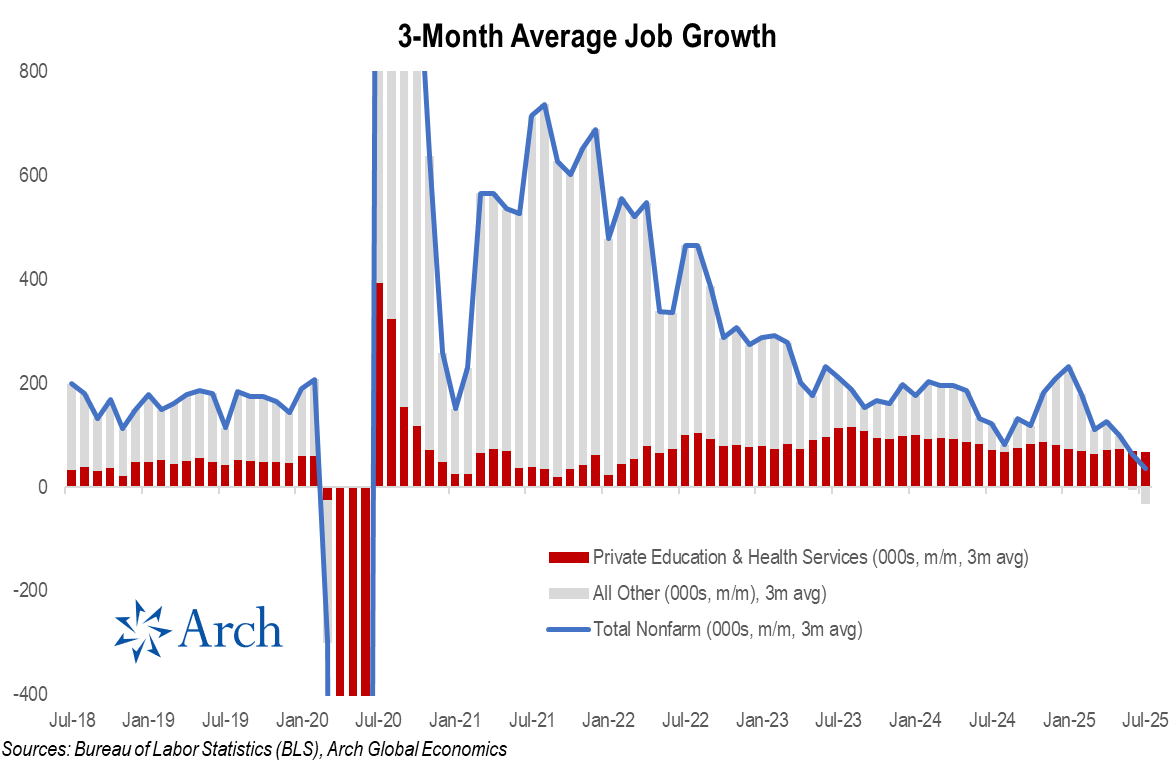
The revised employment data (representing a cumulative delta on payrolls of 258,000, with May revised down 125,000 and June by 133,000) is another piece of the puzzle that slots in beside a lower Q2 nominal GDP print, lower consumption growth and most importantly, a pause in the growth of the Federal budget deficit.
This pause is showing in my “new money” indicator above, a key driver of growth forecasts. It has shown little growth in new debt since the tariffs started.
While private sector credit is growing well, the government has totally disappeared, and it carried about three-quarters of the $200bn/month new debt growth. This is rare for the post-pandemic period, as the “new money” indicator chart shows.
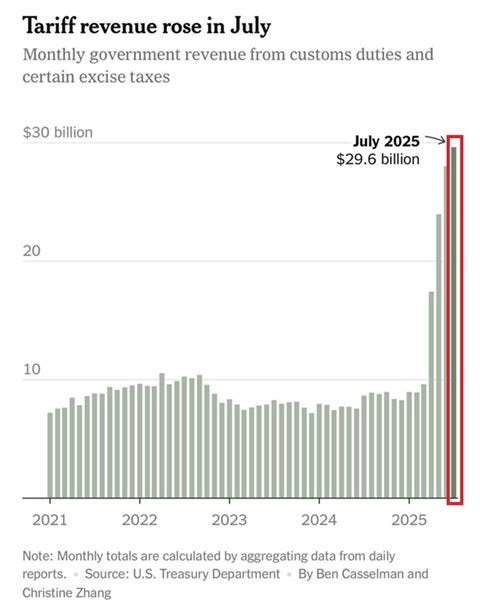
It doesn’t matter who or where the tariff payments originate from - if the budget deficit isn’t growing, nominal growth WILL be affected.
However, this isn’t a call for recession. New employment data suggests that a combination of tariffs and immigration is moving the employment breakeven point lower and with it, lower equilibrium growth for the US economy.
US payrolls and those revisions
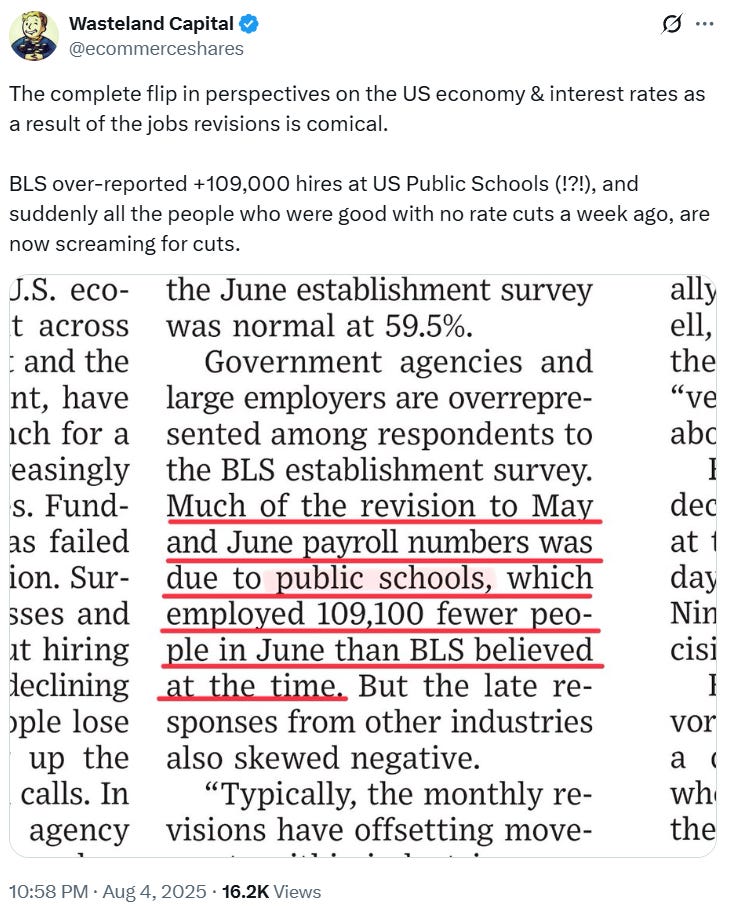
The bulk of the downward revision come from state government hiring, with public schools being a large chunk of that.
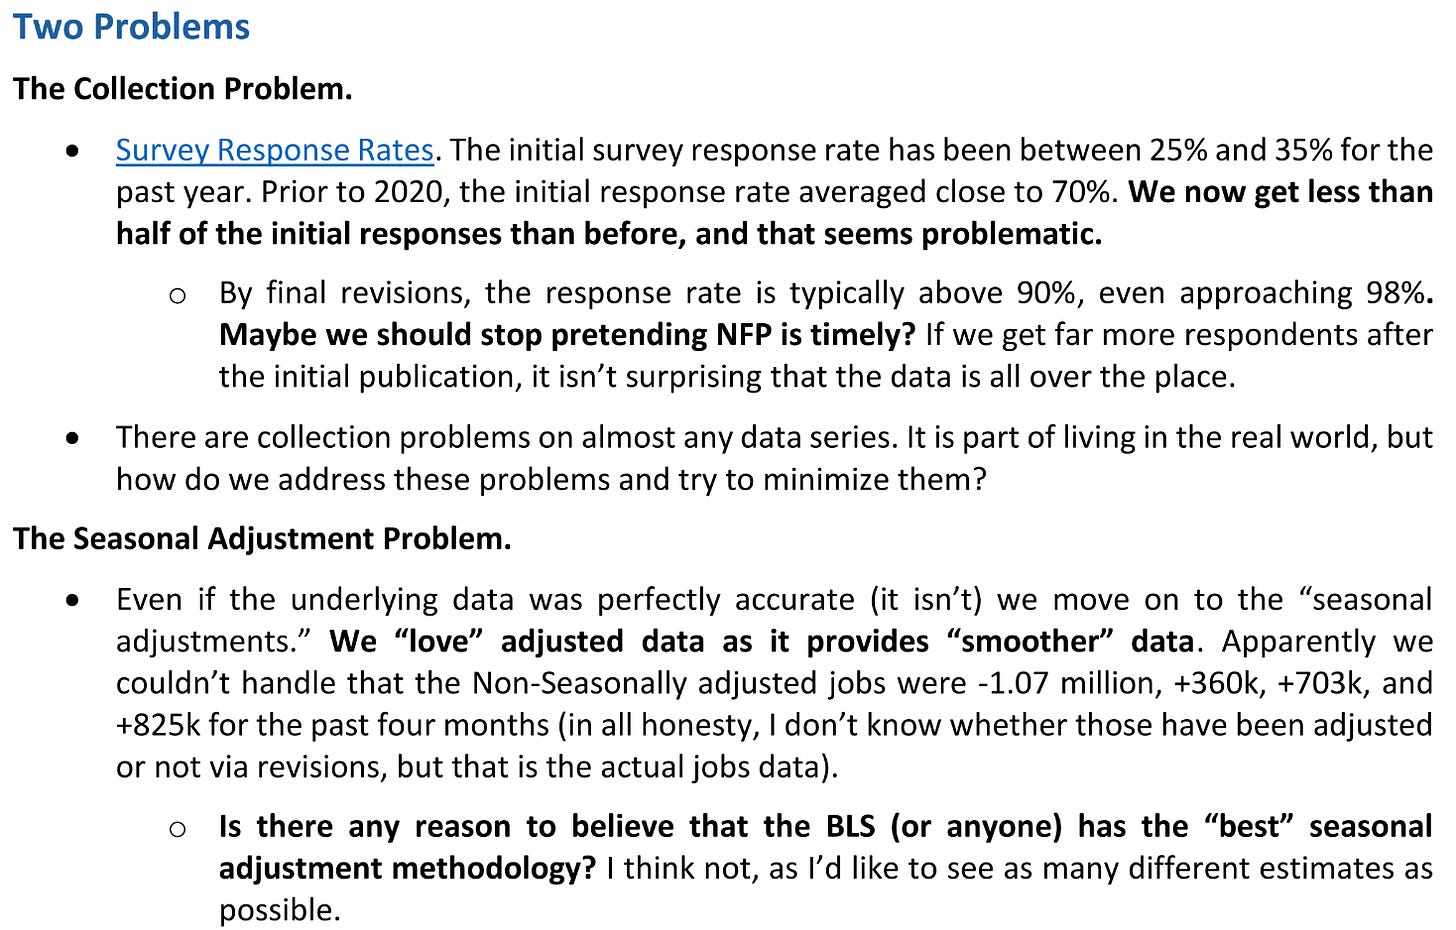
There are clear problems with this part of the employment series, as this cohort experienced huge retrenchments during the pandemic and that might still be affecting any adjustments.
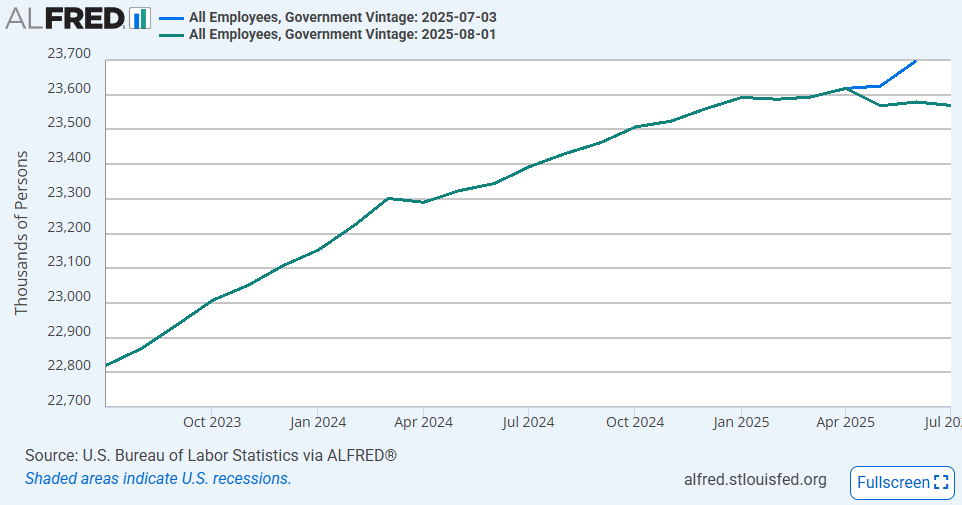
The change in trend on government employment post-revisions is clear.
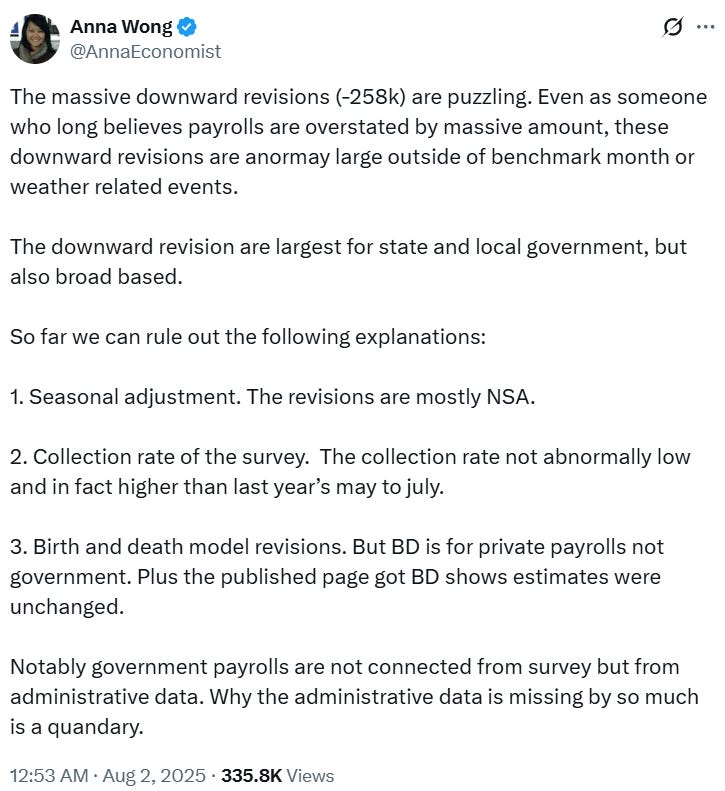
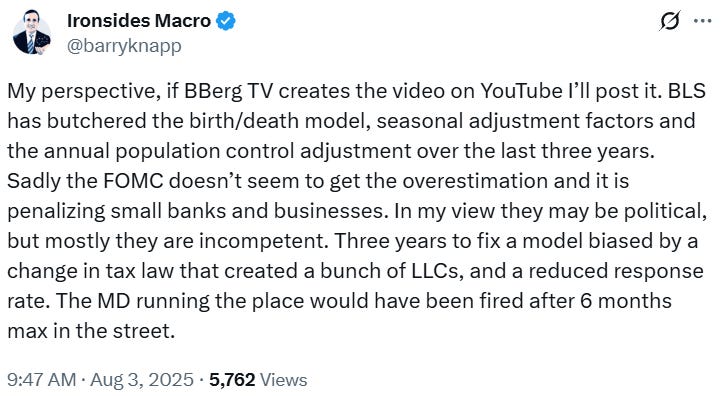
Anna offers some explanations about the revisions in the linked post above. Whatever the answer, it is slightly concerning.
Academy securities offer another view here.
This one is even more fiery.
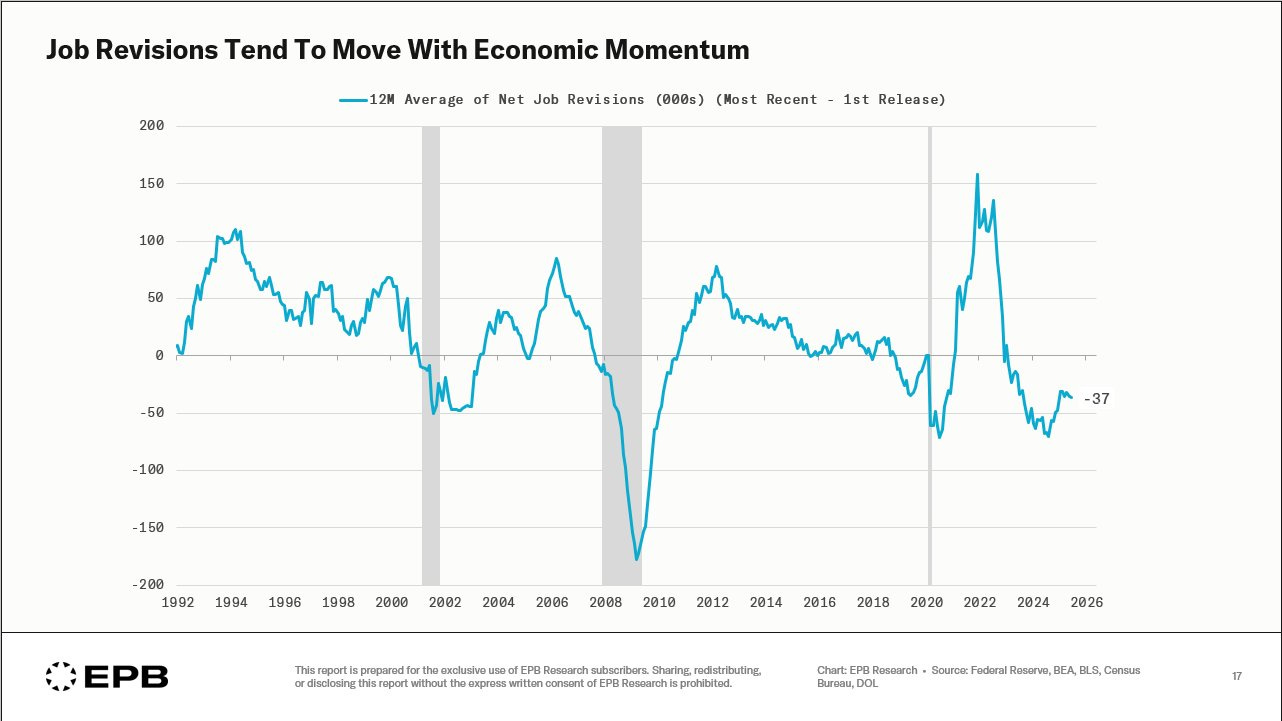
EPB Research (@EPBResearch on X) produced the chart above, highlighting the pro-cyclicality of revisions.
Private payrolls were affected, but not by as much and are the most encouraging part of the data.
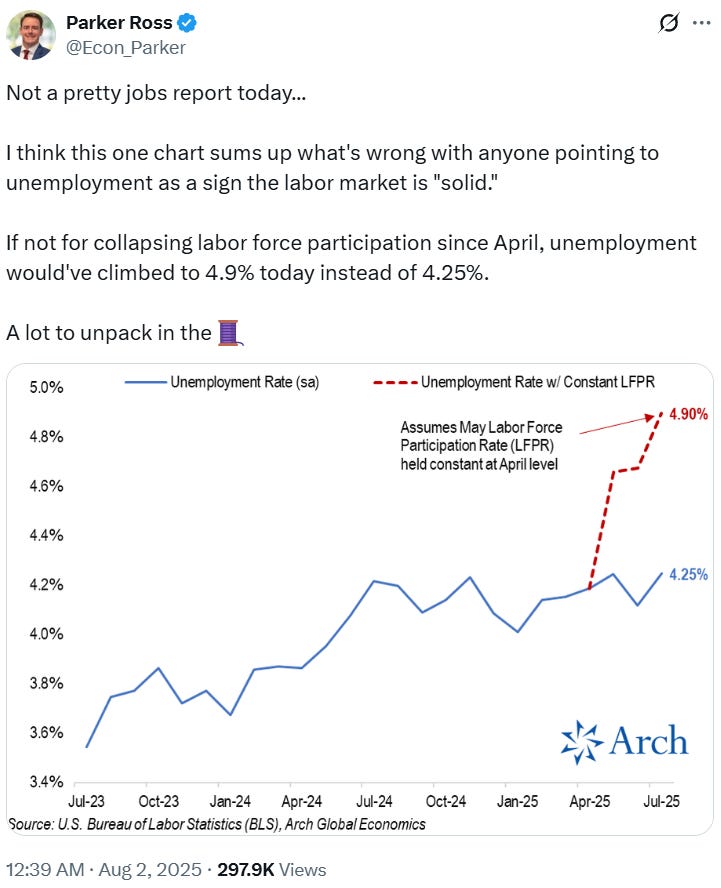
This gets us to the denominator. Despite the slower run-rate of employment, the unemployment rate has hardly budged. Parker’s thread is linked above.
He credits the participation rate falling, but I think rapidly slowing migration is finally biting.
(The CNN clip is linked in the post above).
JD Vance posted about the divergence in the native versus foreign born employment series diverging. Not sure if the divergence is statistically significant yet, but it sure does fit the narrative.
All of this points to a permanent slowing of growth in the working age population. This means:
~80,000 per month is the new breakeven point for employment. This is down from the ~200,000 that has persisted forever.
Nominal GDP growth will have to slow.
Lower equilibrium rates of employment growth will have a helpful effect on tariff affected inflation but may also drive wage growth.
I can’t stress how important this is, and how we will have to change how we think about all the moving parts in the economy.
More on immigration
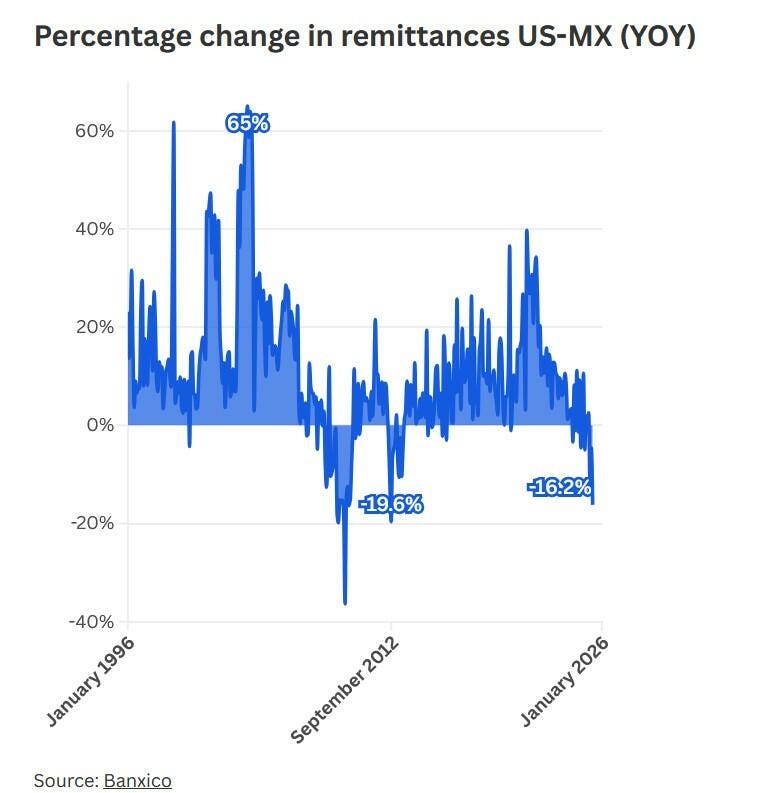
Banxico put out a report on remittances back to Mexico.
The readings suggest a very sudden change that aren’t seen outside of deep recessions.
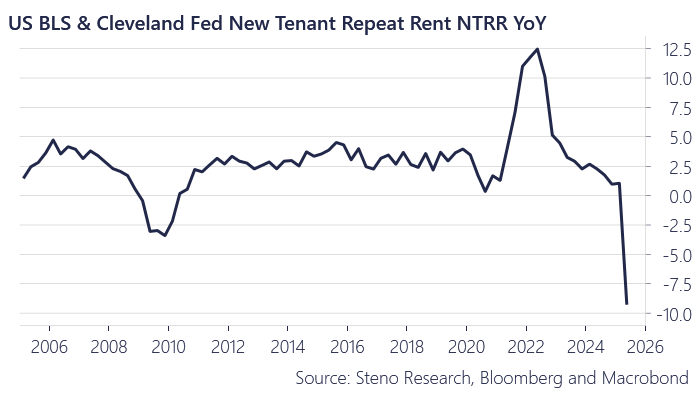
Rents, a key source of disinflation recently in CPI readings, seems to be soft as well which would fit into the immigration narrative.
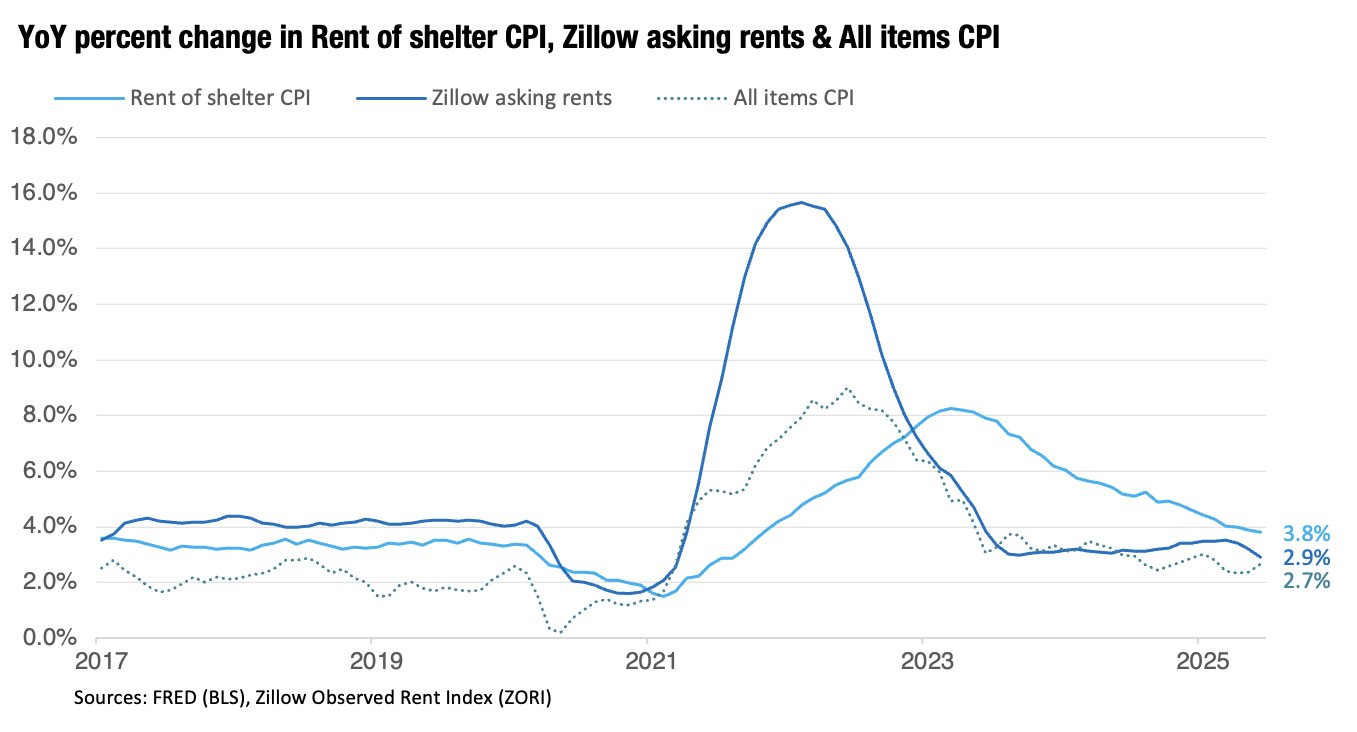
Zillow rents are very soft as well.
A bad ISM as well?
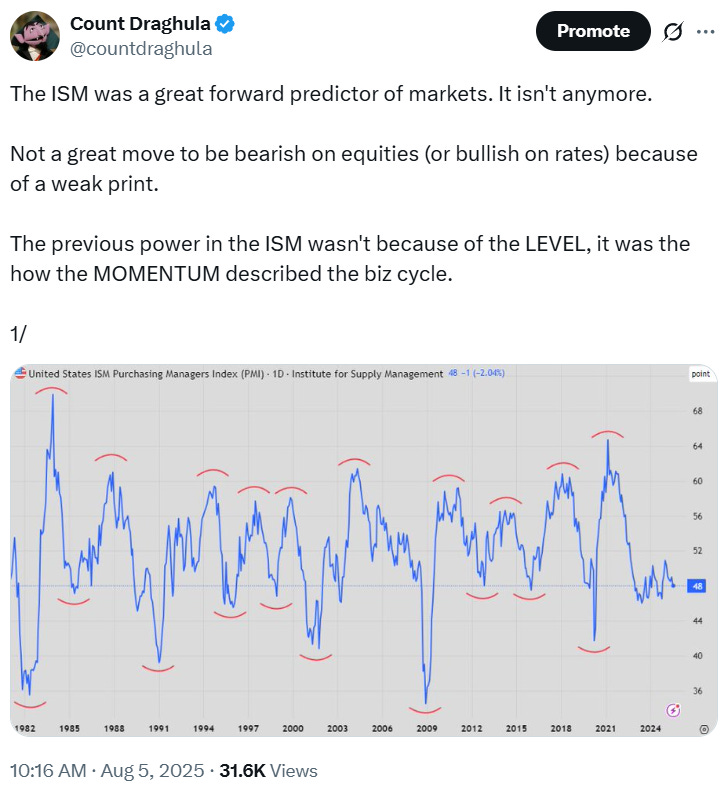
Payroll revisions came along with a poor ISM print on Friday temporarily pushing equities lower.
In the post above I argue why this should be mostly ignored for the time being.
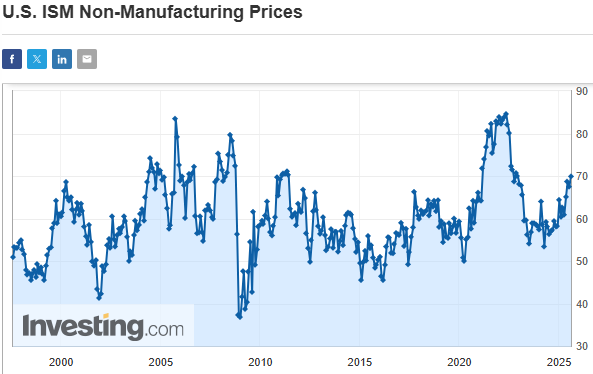
More importantly, prices paid seem to be picking up in the ISM services survey. This series has a good correlation with core CPI, and as such caused many an analyst to scream “stagflation” again.
Ignore this. Outside of tariff effects (which I’ll continue to follow closely) the impulse is for lower inflation at the moment due to the OER component of inflation.
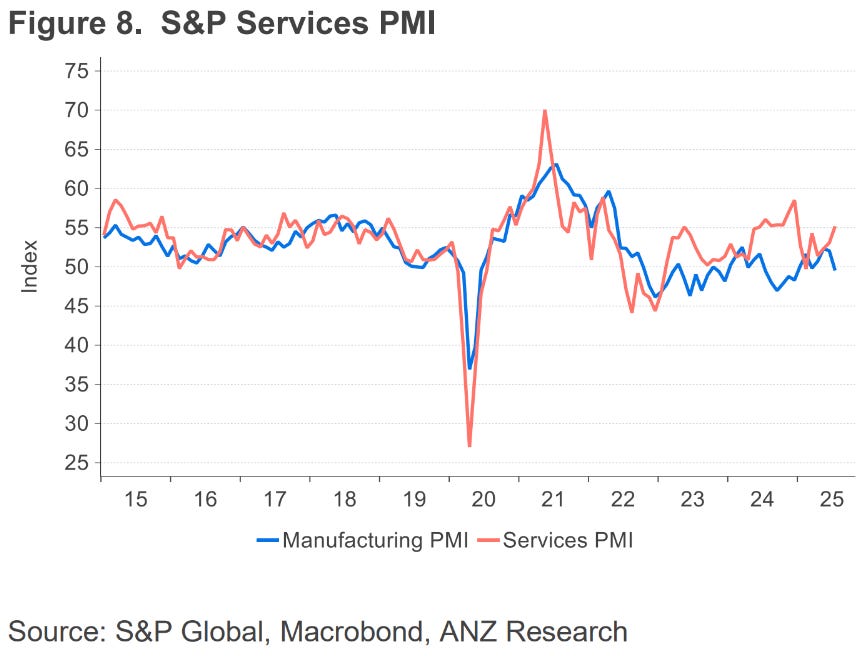
The S&P PMI is showing a similar trend to the ISM survey.
Lower nominal growth is pointing towards a slower pace of gains in equities. To form a full view on this we are going to need more information on tariff’s effects on the trade deficit and how they will affect US capital inflows. There just isn’t enough information at this time.








Excellent post and it connected some dots for me. Namely, one of the unintended consequences of the immigration crackdown could be greater stress on multi-family as vacancy rises and additional supply comes online.
Great post as always!
We are up for an interesting mechanics when there will be less people employed, but UR stays relatively low - which would make Fed cut rates at a lower pace, while economic activity is slowing. That would probably go on until something cracks significantly and then rates drop like a stone
And then we will have a few years of recovery with CPI inflation below actual because of OER and FHA reform, which would force fed to keep rates to low for longer again😂