
Charts & Notes: The myth of seasonality
Also, the "concepts of a plan" are becoming an actual plan

Following on from the CPI covered last week, Fed speakers this week suggest some worried acceptance about core CPI being stuck at 3%. I’m not sure how they can expect core at 2% given the dynamics at play as explained, and this just highlights the lack of direction of the Fed since the pre-election 50bp cut last year.
Ultimately, it will be lower employment equilibrium that will make the Fed more nervous. When you are so close to stagnating employment growth, the Fed will find it easy to cut and impossible to hike.
Peace?


This is quite the shift from where we were only a few months ago. Security guarantees with “boots on the ground” being the key point here, and this may convince Zelensky to agree to let territory go.
In terms of doing business with Russia, not much will likely change.

The tweet above references this Centre for Research on Energy and Clean Air article.
Despite a range of sanctions and the threat posed by dependence on Russian energy, in the third year of Russia’s full-scale invasion of Ukraine, EU imports of Russian fossil fuels in particular remain largely unchanged, totalling EUR 21.9 bn, a 6% year-on-year drop in value but merely a 1% year-on-year drop in volumes.
More specifically on LNG:
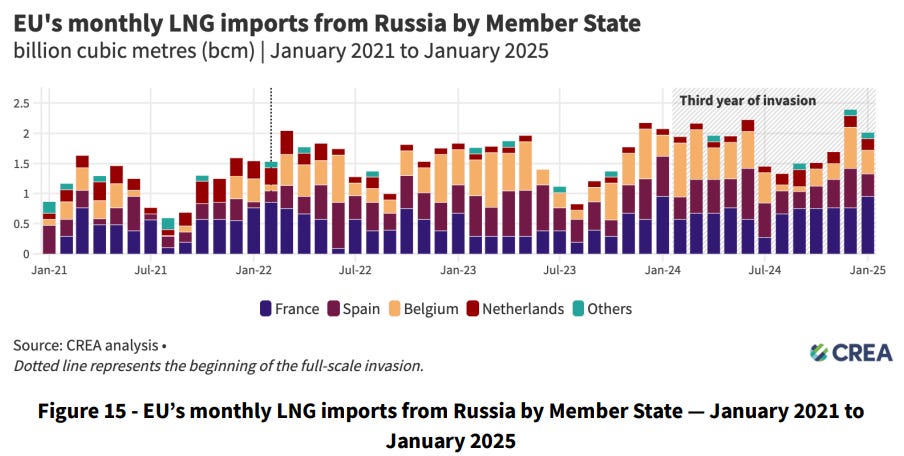
Despite a range of sanctions, EU Member States spent EUR 7 bn on Russian LNG in the third year of the invasion, with volumes rising by 9% year-on-year.
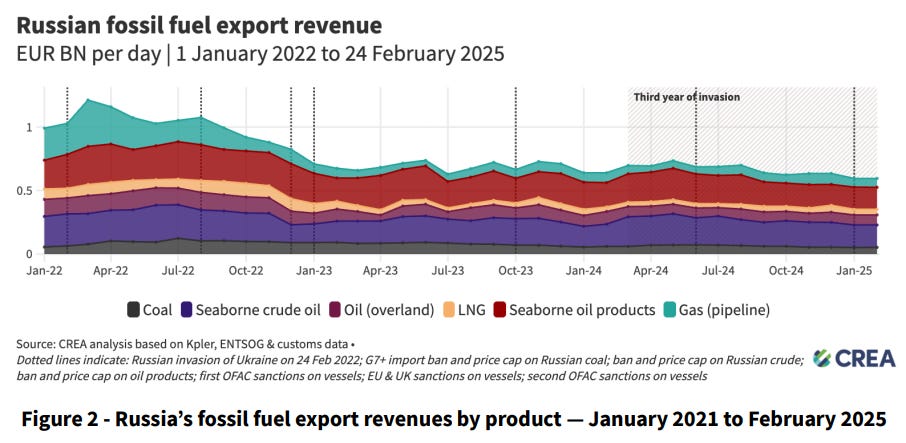
It may seem like sanctions worked initially…
…but exports the year before invasion show little difference to current levels as Russia found other markets.
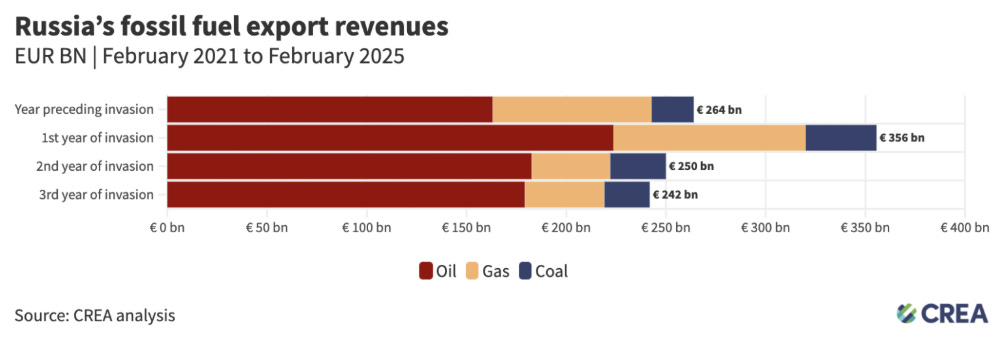
Russia’s stronghold over new markets also solidified in the third year of the invasion. The three biggest buyers of Russian fossil fuels, China (EUR 78 bn), India (EUR 49 bn), and Turkey (EUR 34 bn) were responsible for 74% of Russia’s total revenues from fossil fuels in the third year of the invasion. The value of India and Turkey’s imports saw a year-on-year increase of 8% and 6% respectively.
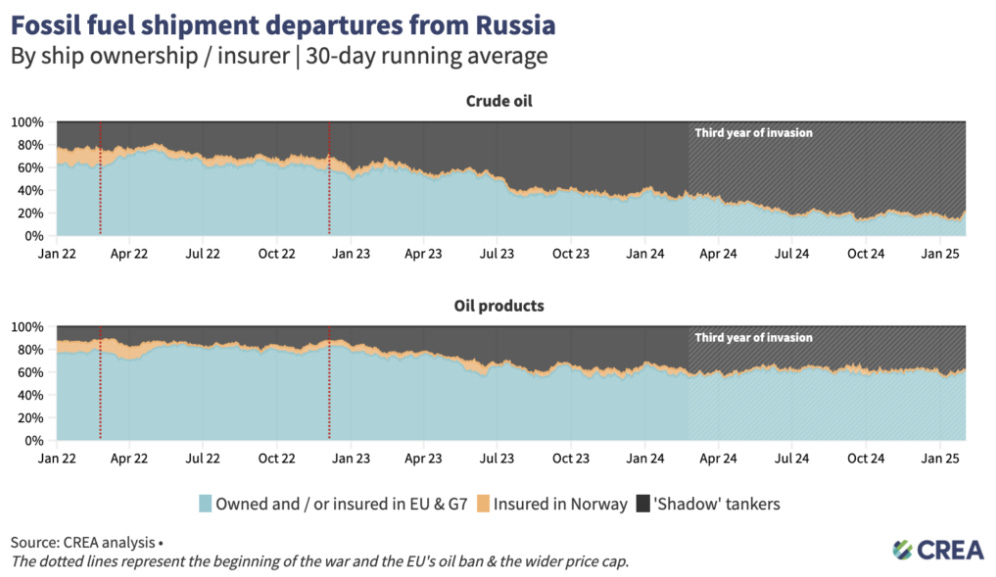
The “shadow” tanker fleet is carrying the weight of this volume.
AI
Morgan Stanley put out a big bullish piece on AI this week.
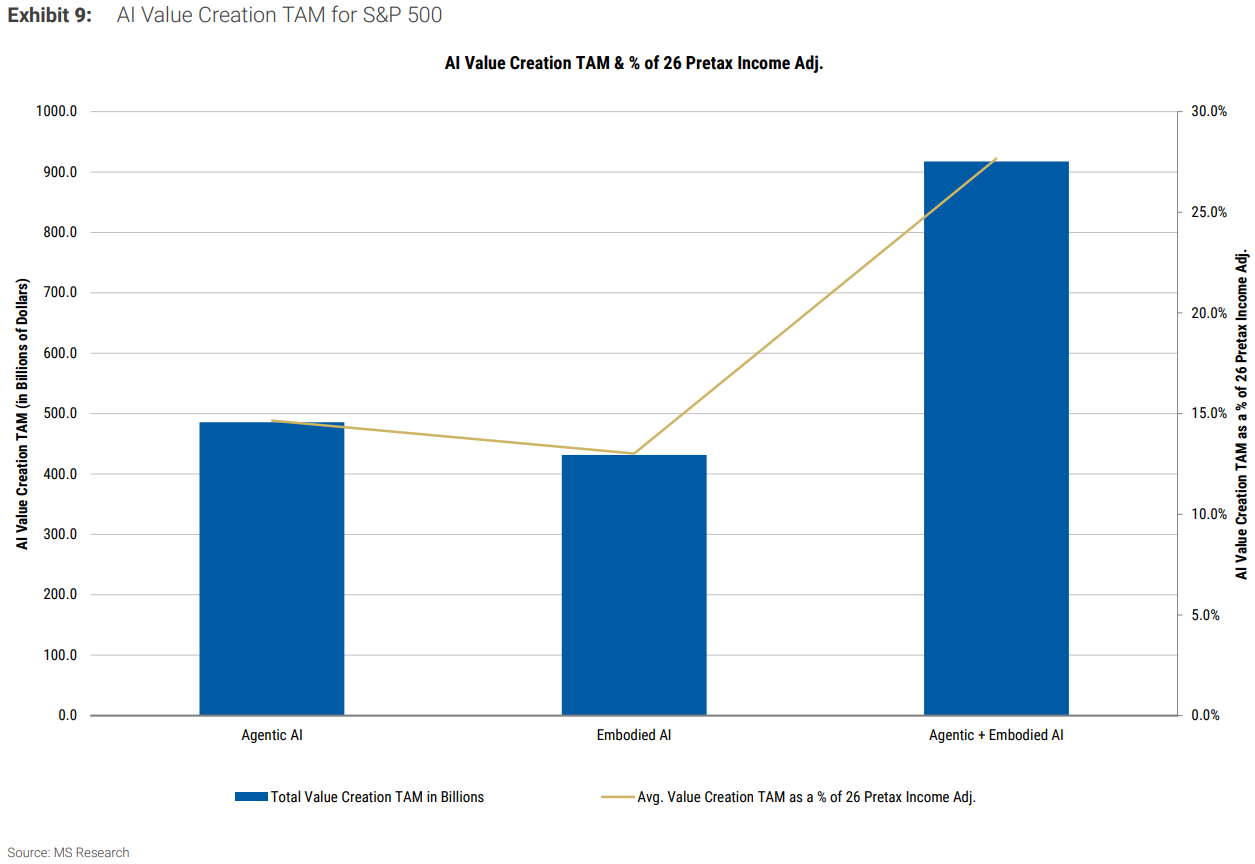
Big gains to be had for S&P500 companies…
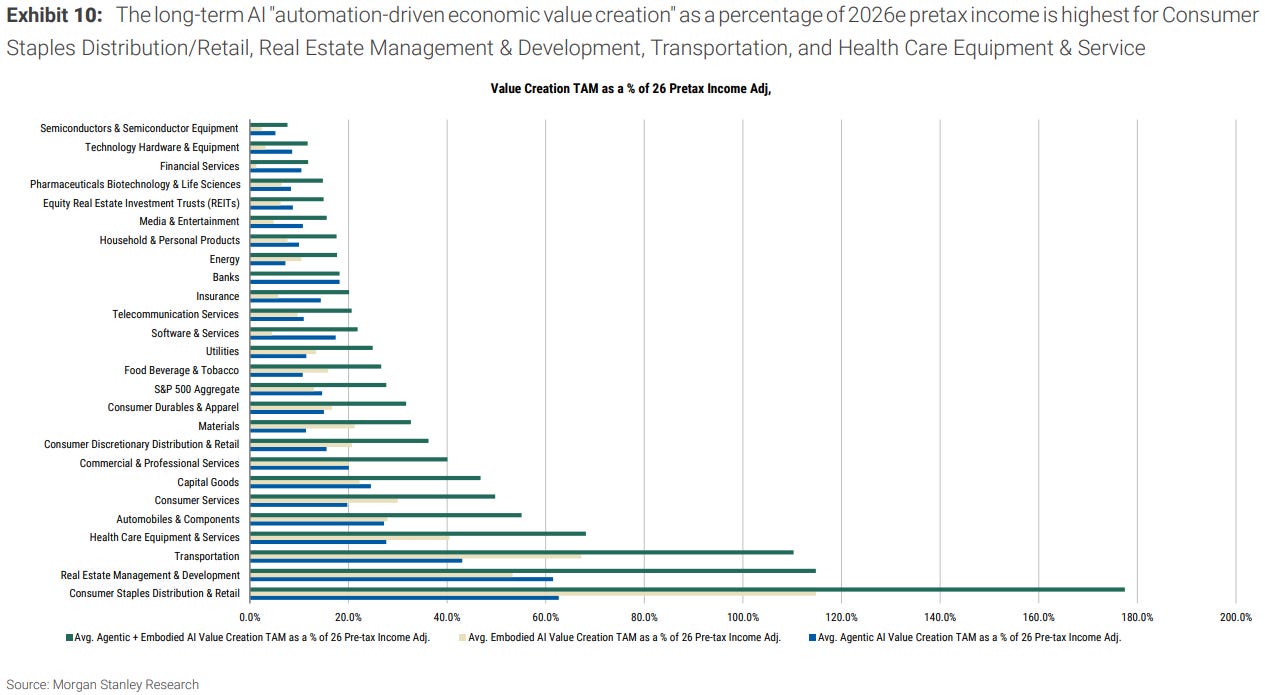
…with breakdowns by sector above.

The Economist put current AI driven investment into context with the dot-com boom.

A breakdown by AI and non-AI investment shows the divide. All-in-all I think these numbers actually mute the effect of this investment somewhat. It’s important, but not that far out of kilter.
September’s alleged seasonality
Lots of chatter around fear of September and October seasonality as we complete 4 months of positive returns for the S&P. Seasonality calculations are mostly just bad statistics.
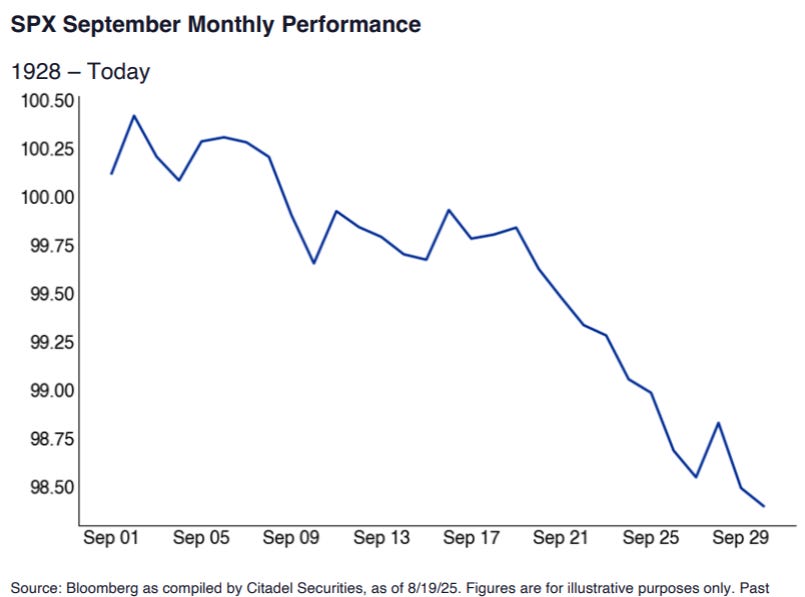
Citadel produced this average daily cumulative return above. Why is it misleading?
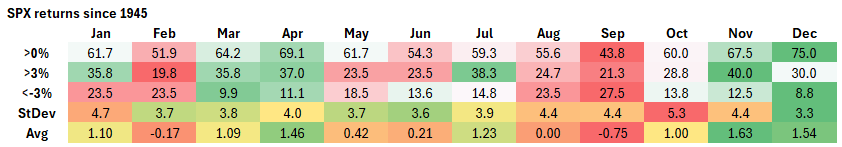
No matter which way you try to measure September seasonality, it regularly performs among the worst months of the year for S&P500 returns along with February, May and August.
It has the lowest average return, only 43.8% of months deliver a positive outcome, the lowest chance of a >3% up month and one of the highest for a result <-3%.
The thing is that none of these results are statistically significant (meaningfully different from 50/50) anywhere near the 0.05 p-value test level. Over 80 years (and depending on the method used), the p-value is ~0.3. Citadel use 100 years of data. I don’t have that but if it held the same proportion over that time, it still wouldn’t be significant.

Warren’s chart above points out the effect of buybacks in this time and their more significant daily impact in the embedded table. The blackout period lasts until late October.
He attributes the strength of this August to these buybacks. Thing is that on my table above August has been more often than not an up month! It just tends to struggle with large negative returns, which I would attribute to summer holiday liquidity.
Picking some of the larger September drawdowns shows that we can explain away some of those moves with anything but it being September. We can’t attribute the -9% in September 2008 to it being September…there were a few other things going on at the time.
What about the other drivers of equity returns?
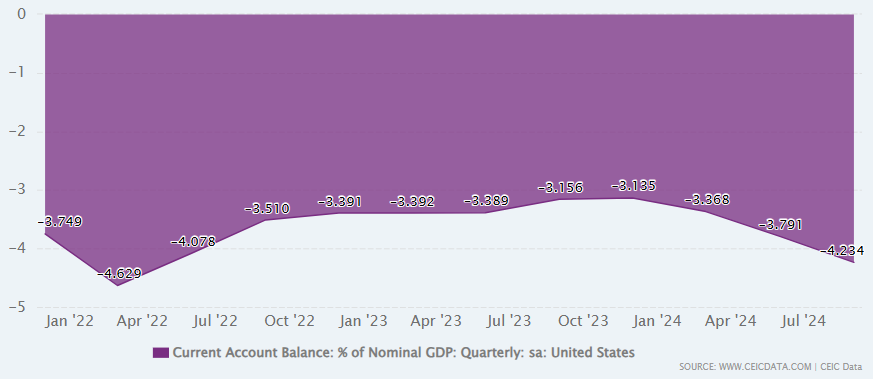
The current account deficit hasn’t shown signs of contraction yet. Capital inflows have to find a home.
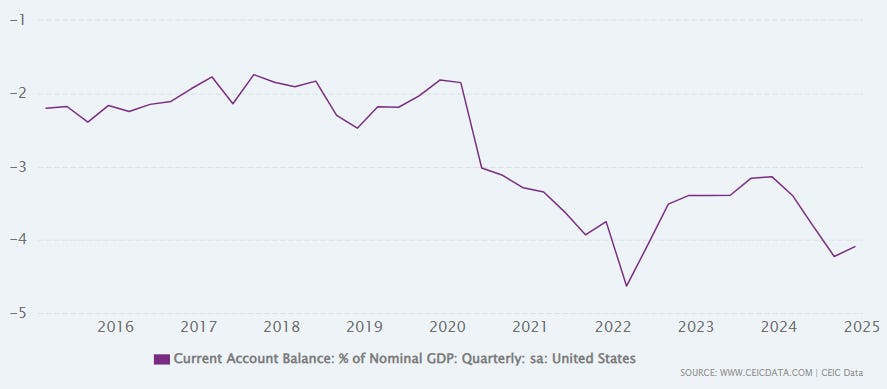
Monthly returns for the S&P500 have averaged roughly 1.3% since the CA opened up. This year is currently running at 1.1%.
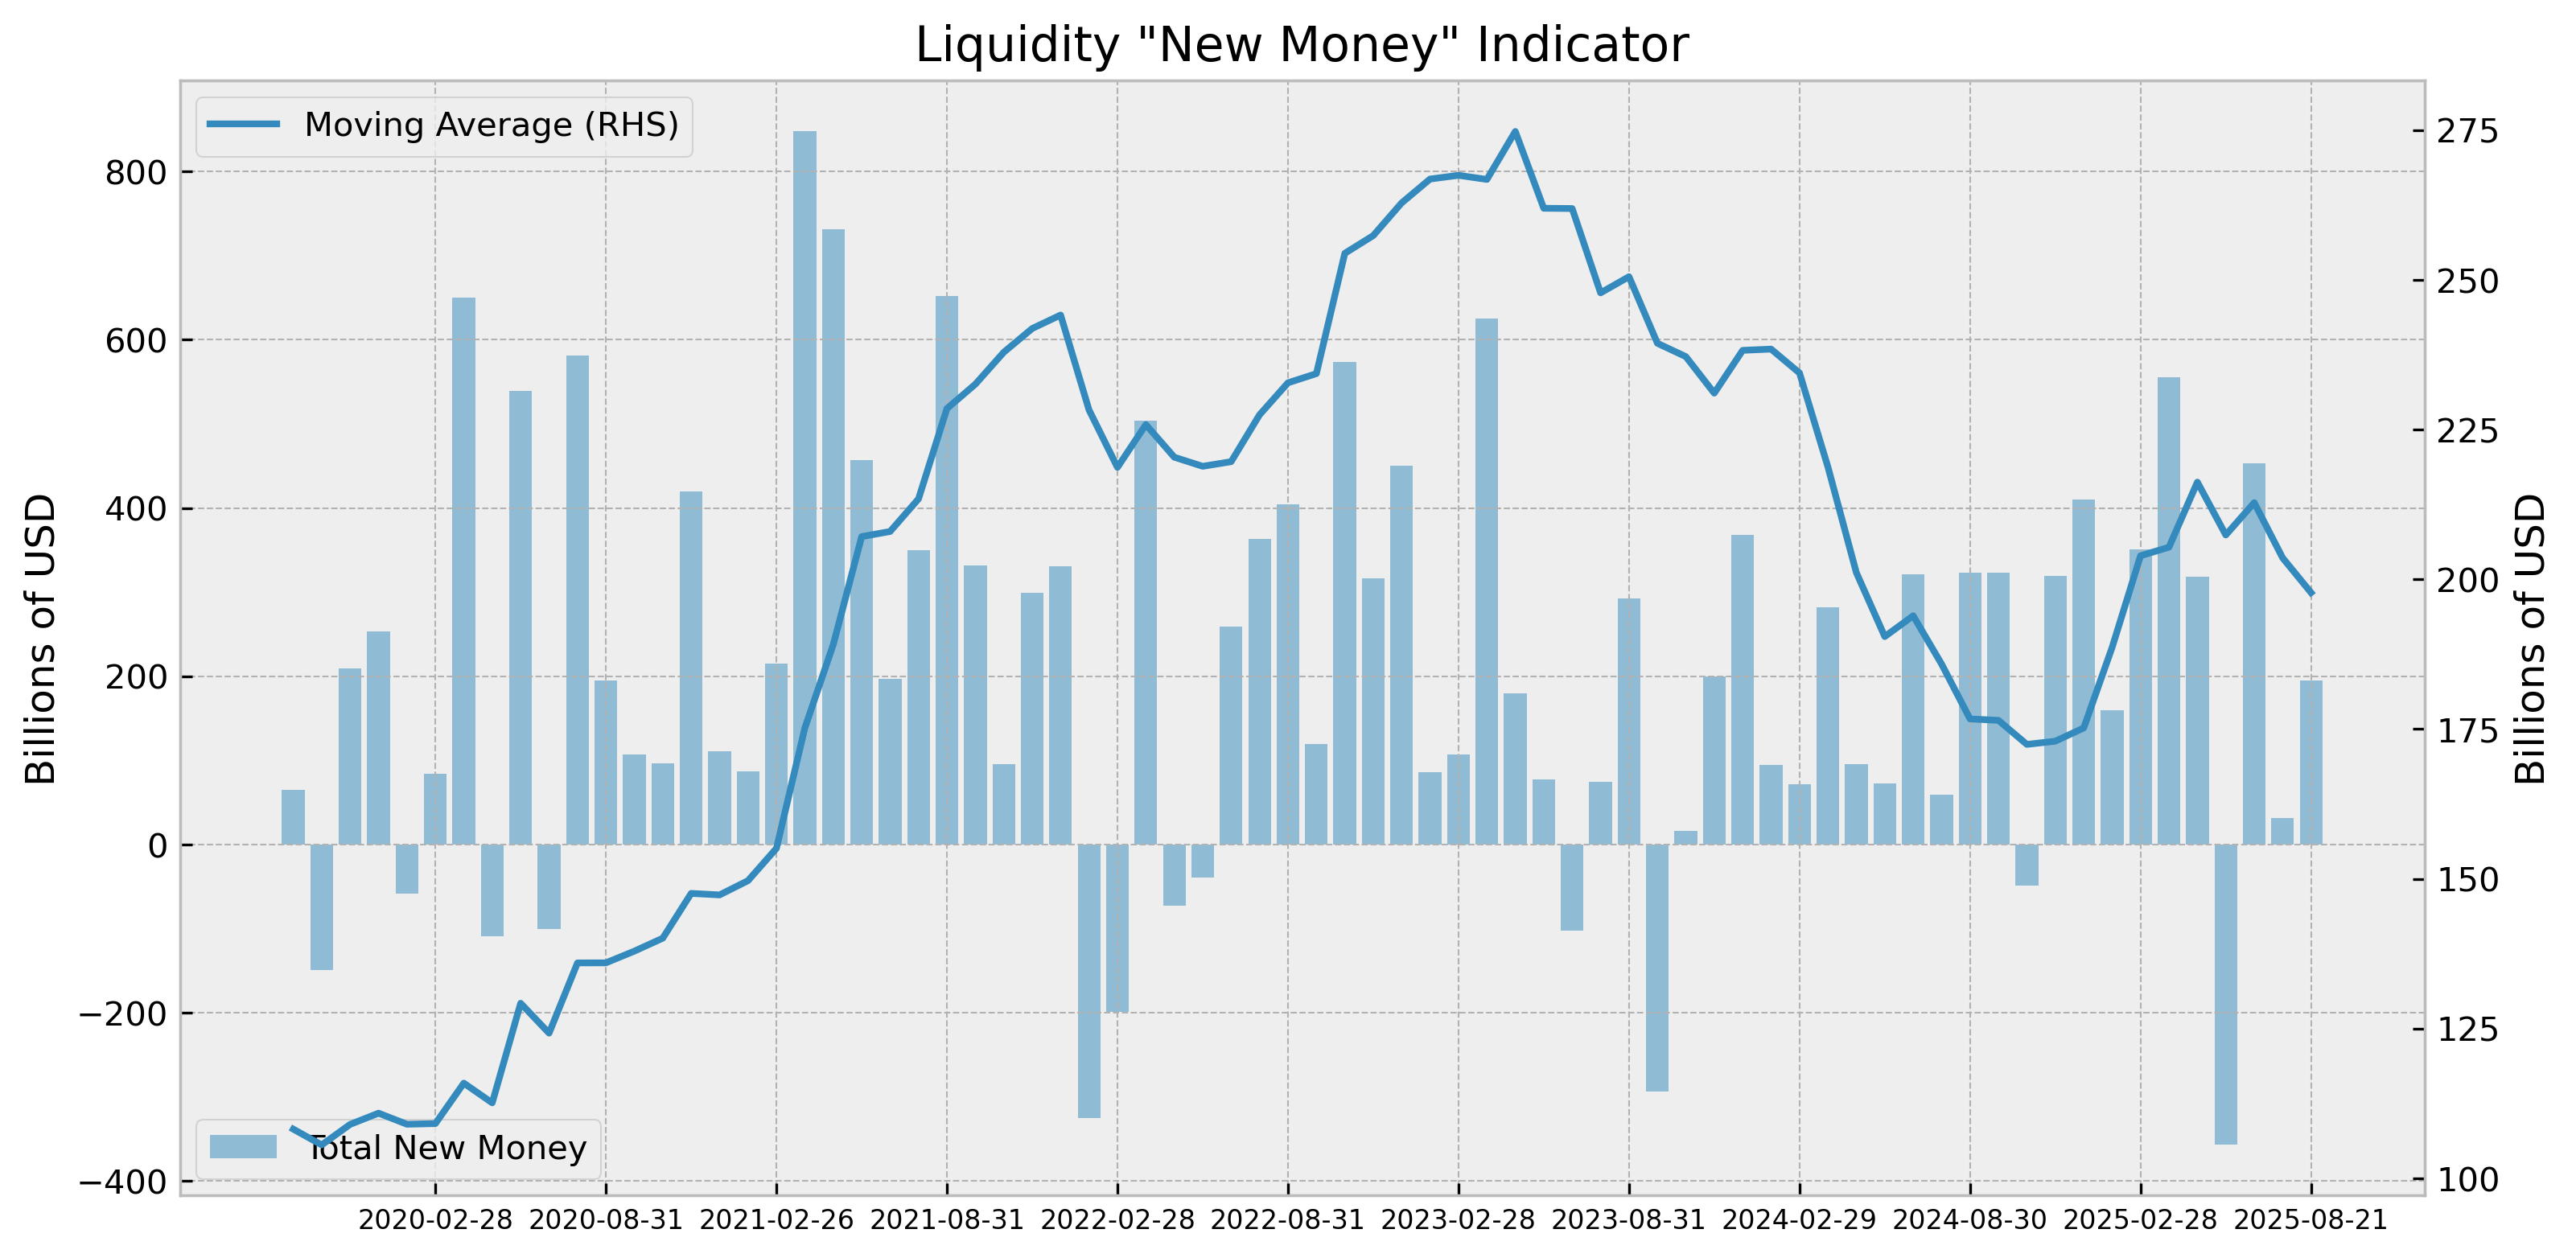
Debt creation started again in August…
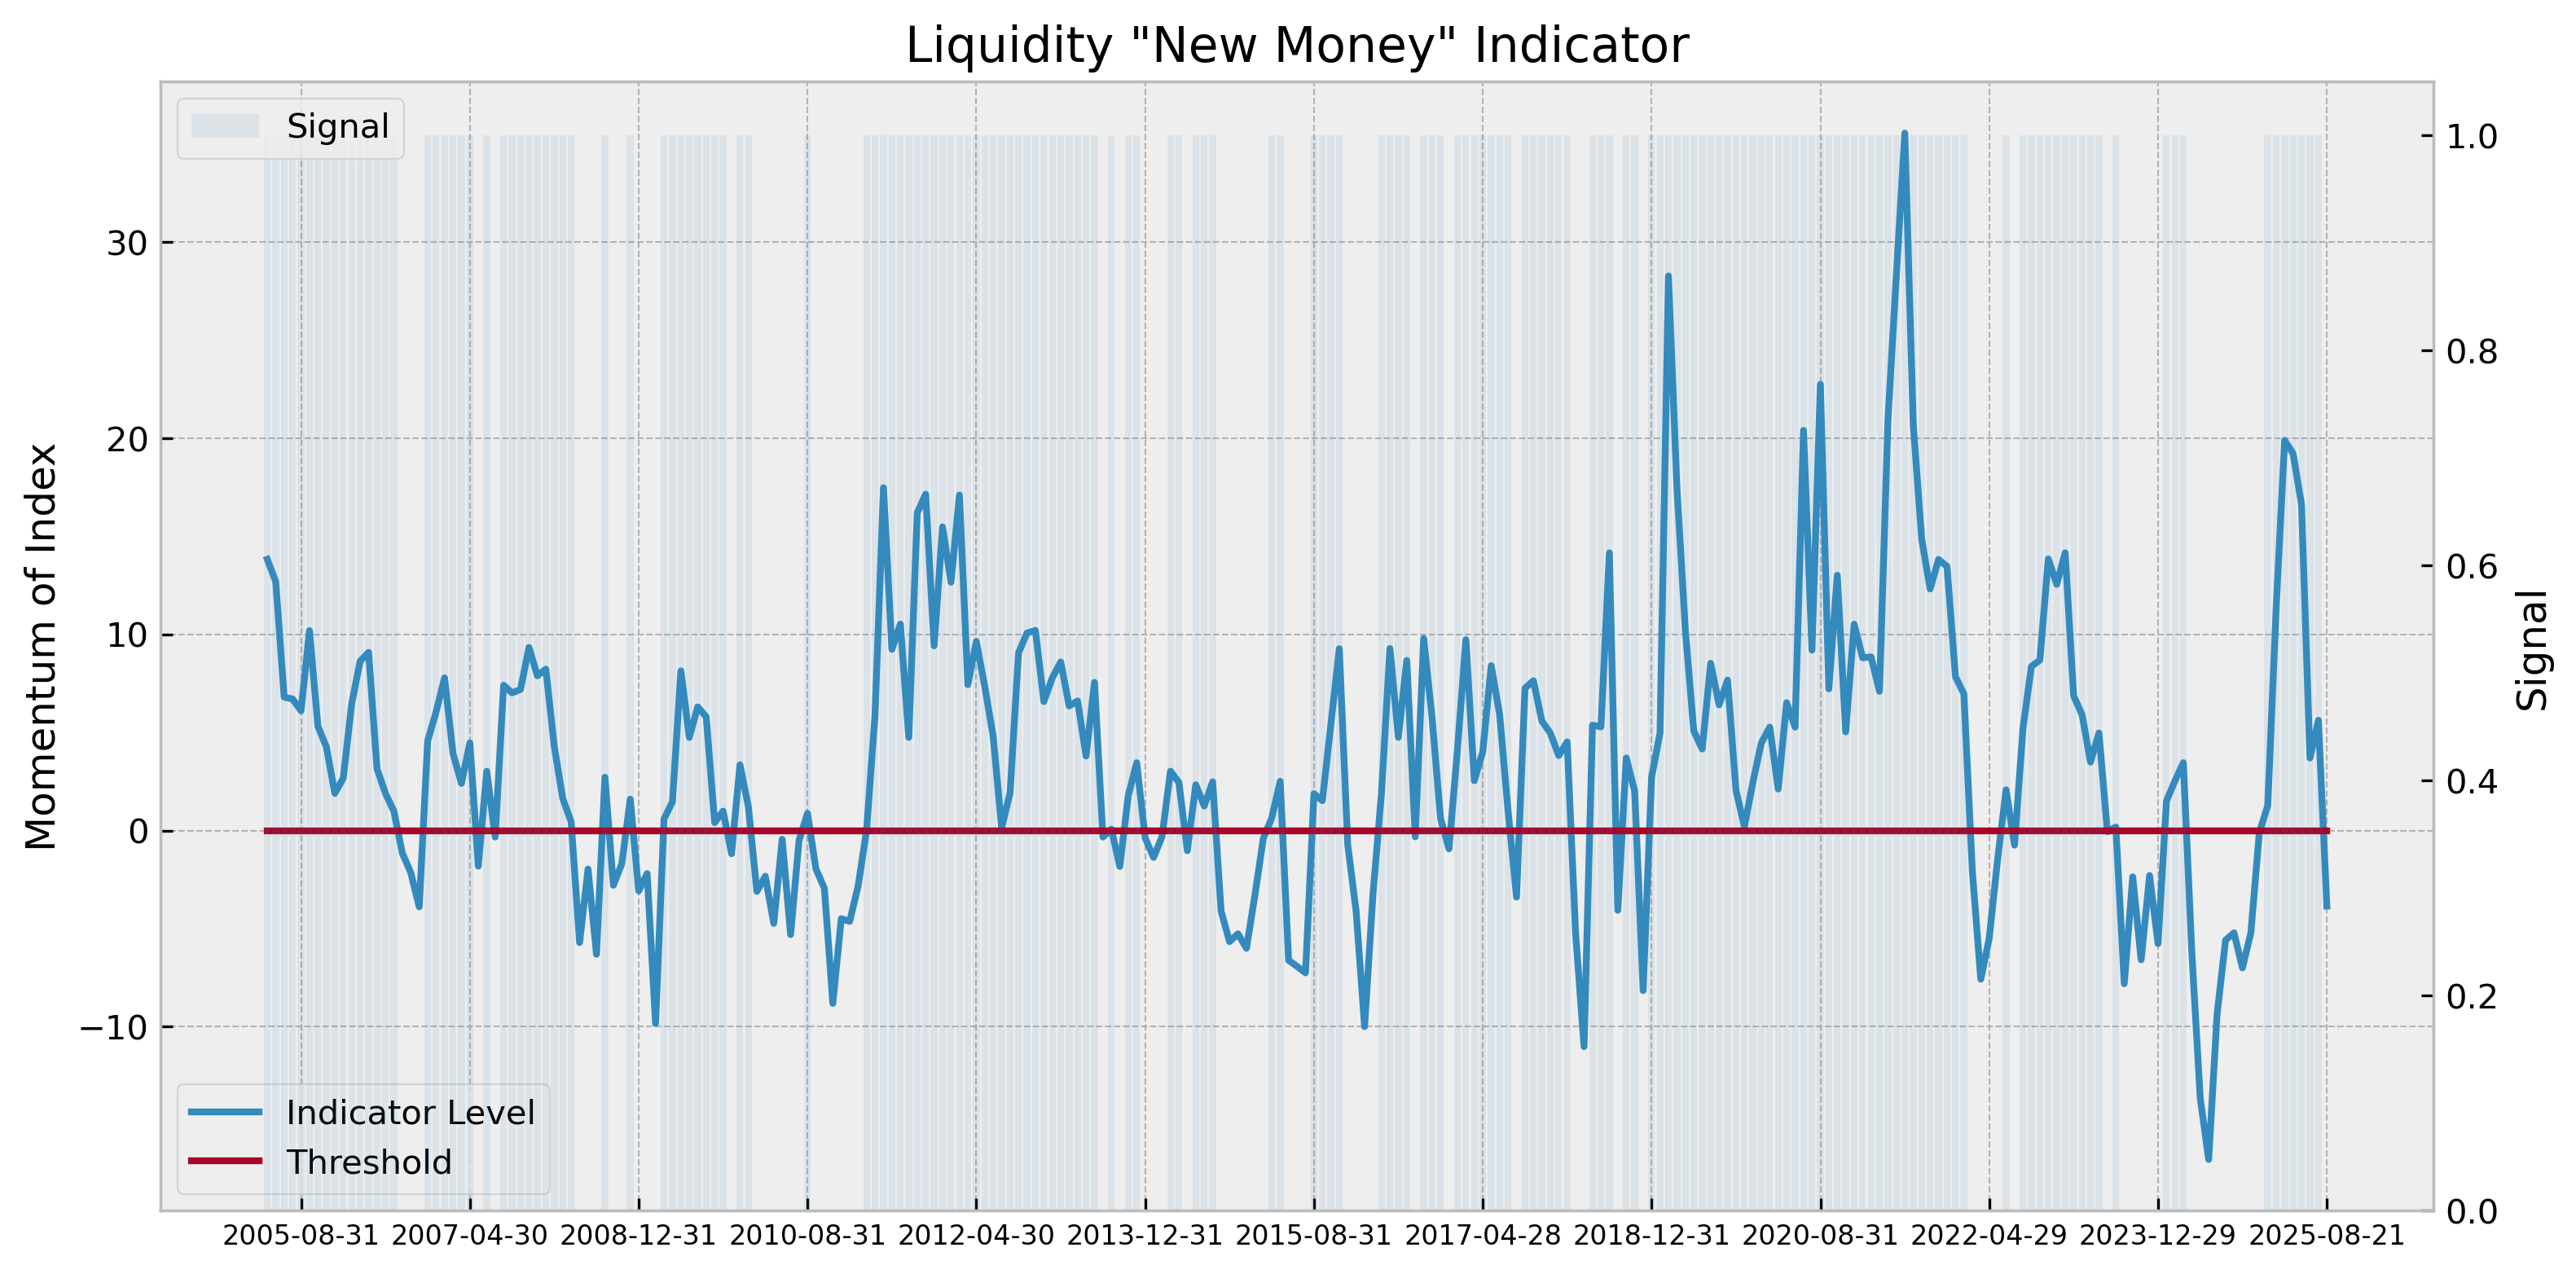
…but the slowing moving average is still showing caution for equities.
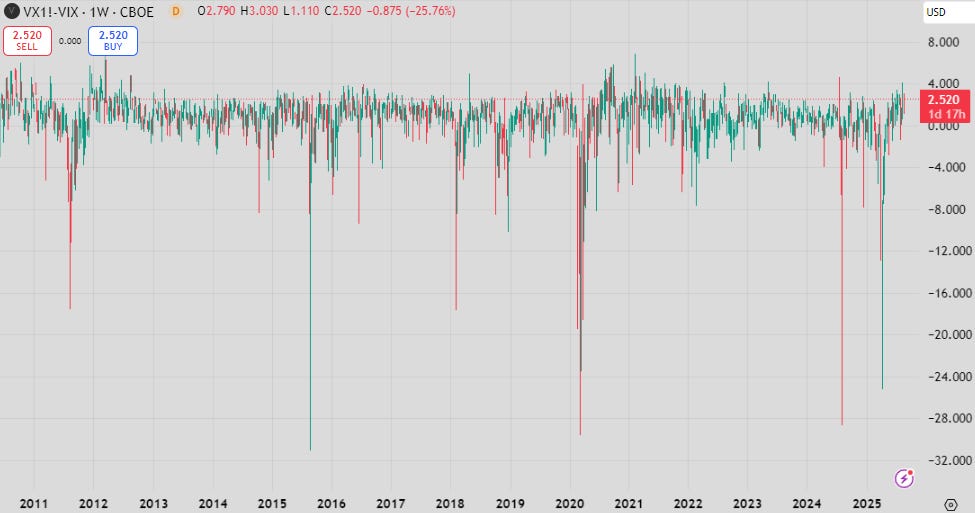
If there are risks in September, the VIX futures term structure is pricing for it. The spread between spot and the first contract (above) is trading at a historically high level. VIX might be low, but there is premium left yet.
What's you view on seasonality being caused by quaterly window dressing in REPO and other interbank transactions?
That would explain that pretty much every crisis happed either around March or around September.
LTCM, Dot Com, Bear Sterns, Lehman, COVID, SVB, 2022 crypto crash and UK debacle. Literally all of them. When was the las time crisis happened in June or December?