
Charts & Notes: The deficit narrative is strong
Deficits are expanding, but they aren't the driver of gold

Developments in France and Japan this week point to one thing only - government budget deficits are only on the increase.
Macro types love a narrative, and the favourite is that this is driving gold though US dollar debasement. This is just good story telling.
Japan
Sanae Takaichi was nominated by Japan’s ruling Liberal Democratic Party as party president on October 4, 2025, making her likely to be the country’s first female prime minister. Takaichi, a hardline conservative and protégé of Shinzo Abe, rose after LDP electoral setbacks and pledges to revive ‘Abenomics’ with aggressive fiscal stimulus, tax cuts, and pro-business reforms.
The market took this development well, to say the least.
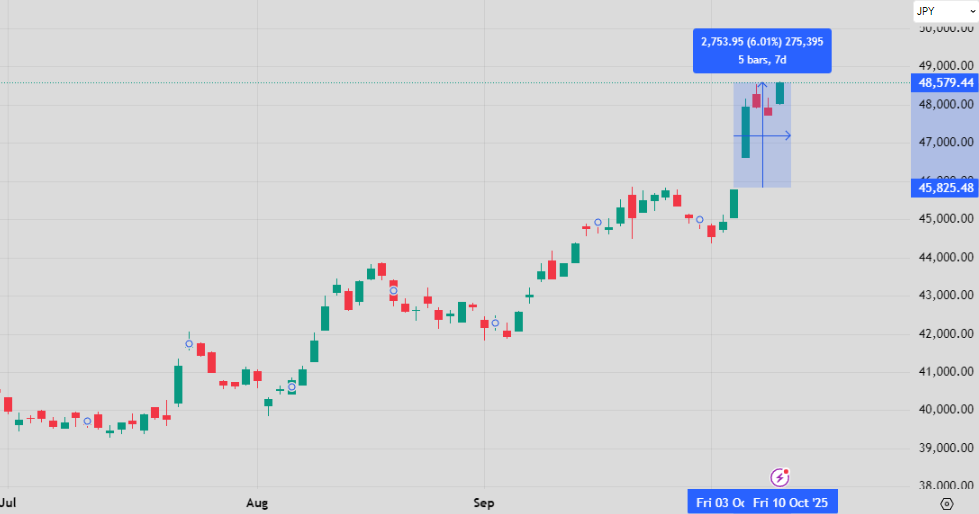
The Nikkei has jumped 6% since Friday…
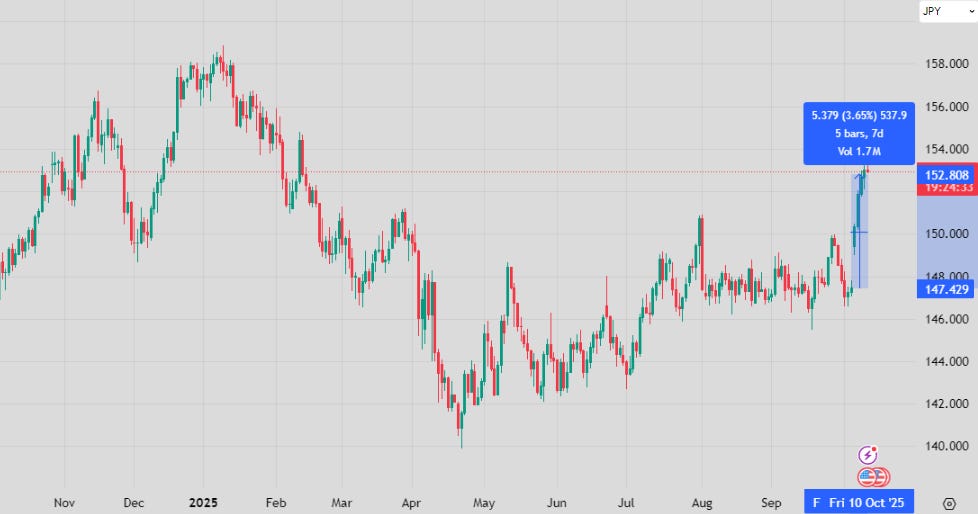
And the Yen is 3.6% cheaper.
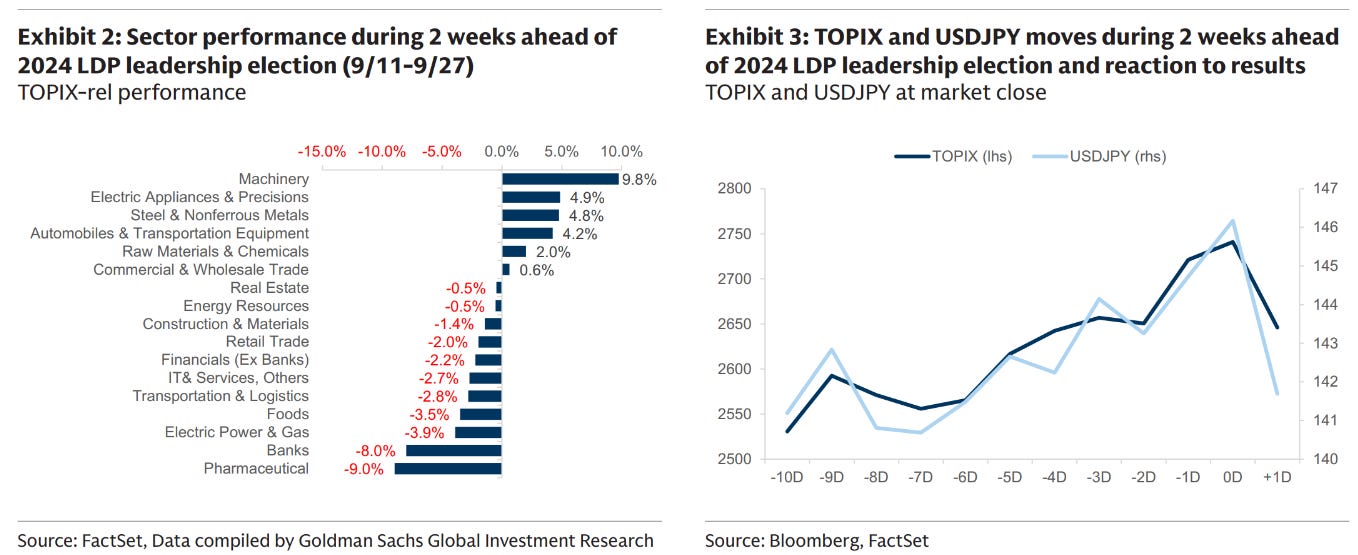
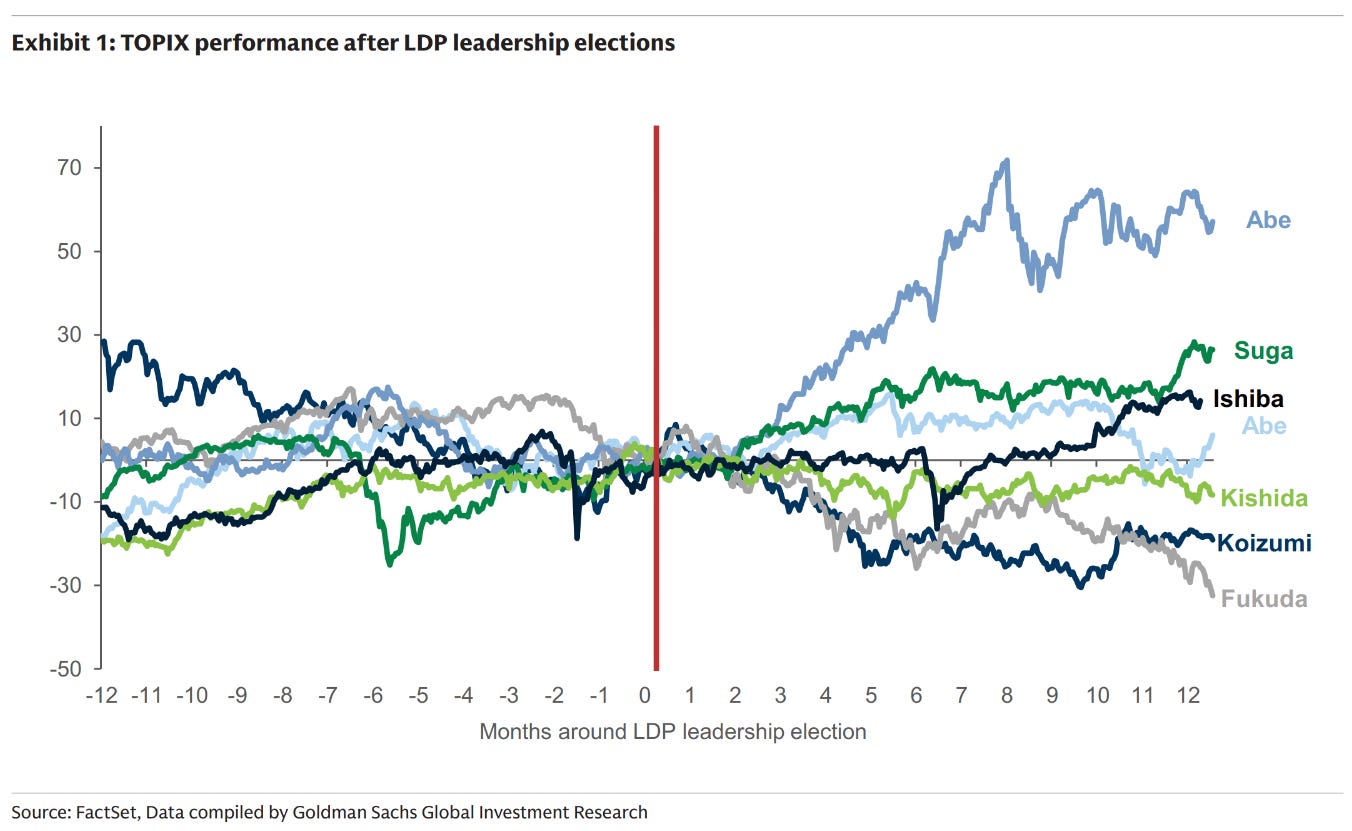
Much of this was the reversal of market moves in last year’s election.
At this point the implications appear to be:
Even closer US-Japan cooperation on Defence and Economic Security
No significant change to US tariff regime
Short-term uncertainty likely on BOJ normalization, but no change expected on current trajectory
‘Crisis management investment’ strategy to benefit multiple Economic Security related industries
The possibility of Abe style fiscal expansion
The fiscal expansionary stance is the most important aspect, but also on what market consensus is split on.
The moves since last Friday were an example of “buy first, ask questions later” given how beneficial Abe-nomics was for the Nikkei.
The doubt around Takaichi’s fiscal expansion lies in debt sustainability and fear of what could happen to the 30-year JGB. I’ve covered JGBs in a few prior editions of Charts & Notes, with the conclusion each time being that there really wasn’t any concern with how long JGBs were trading.


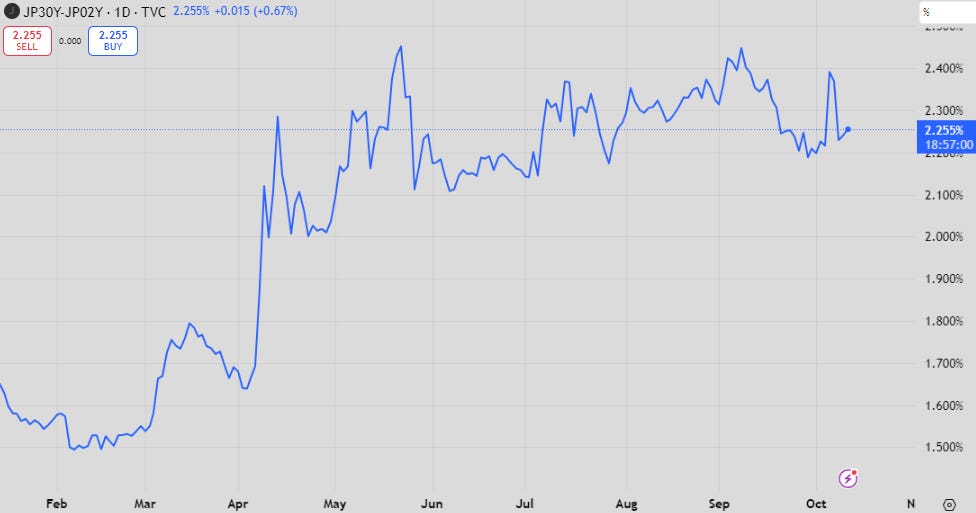
The 2-year/30-year JGB curve did initially pop higher but settled a few sessions after.
Takaichi’s stance on monetary policy also caused BoJ Oct hike odds to 25% vs ~60% priced going into the weekend. While there is no independent central bank, the Bank of Japan is limited in its autonomy by government.
Nevertheless, many banks covering Japan have a disorderly sell-off as a likely consequence of a normalisation of rate hikes. I don’t harbour that fear. Either way, the BoJ were already moving towards slowing rate hikes anyway, as I spoke about here.
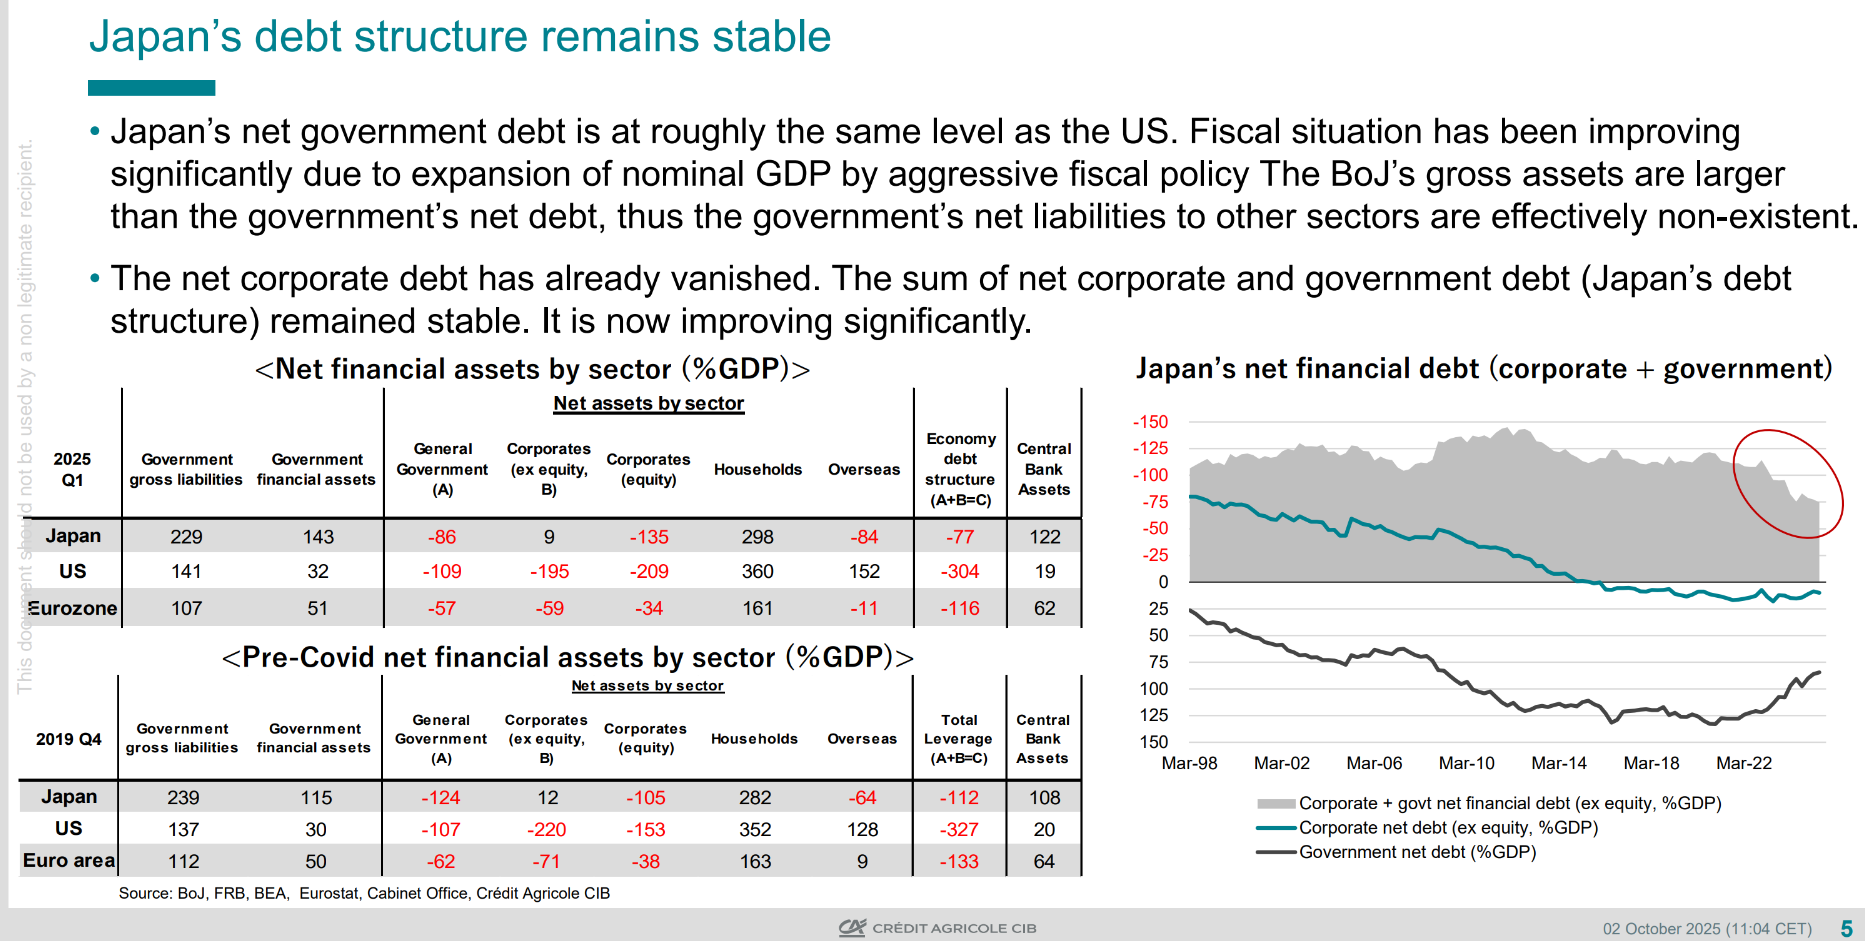
CACIB produced this slide above speaking to debt sustainability. The key here is that better nominal GDP growth has in fact reduced the government debt burden.
This has come at a cost though, and that is the weakening Yen. While things might be better domestically, Japanese citizens are poorer relative to the rest of the world.
The battle between the Yen and the Yuan

The moves in the Japanese Yen over the last few weeks are, on their own, pretty spectacular. A large amount of the move can be described by just pointing to interest rate differentials - which is to be expected with such divergent monetary policy.
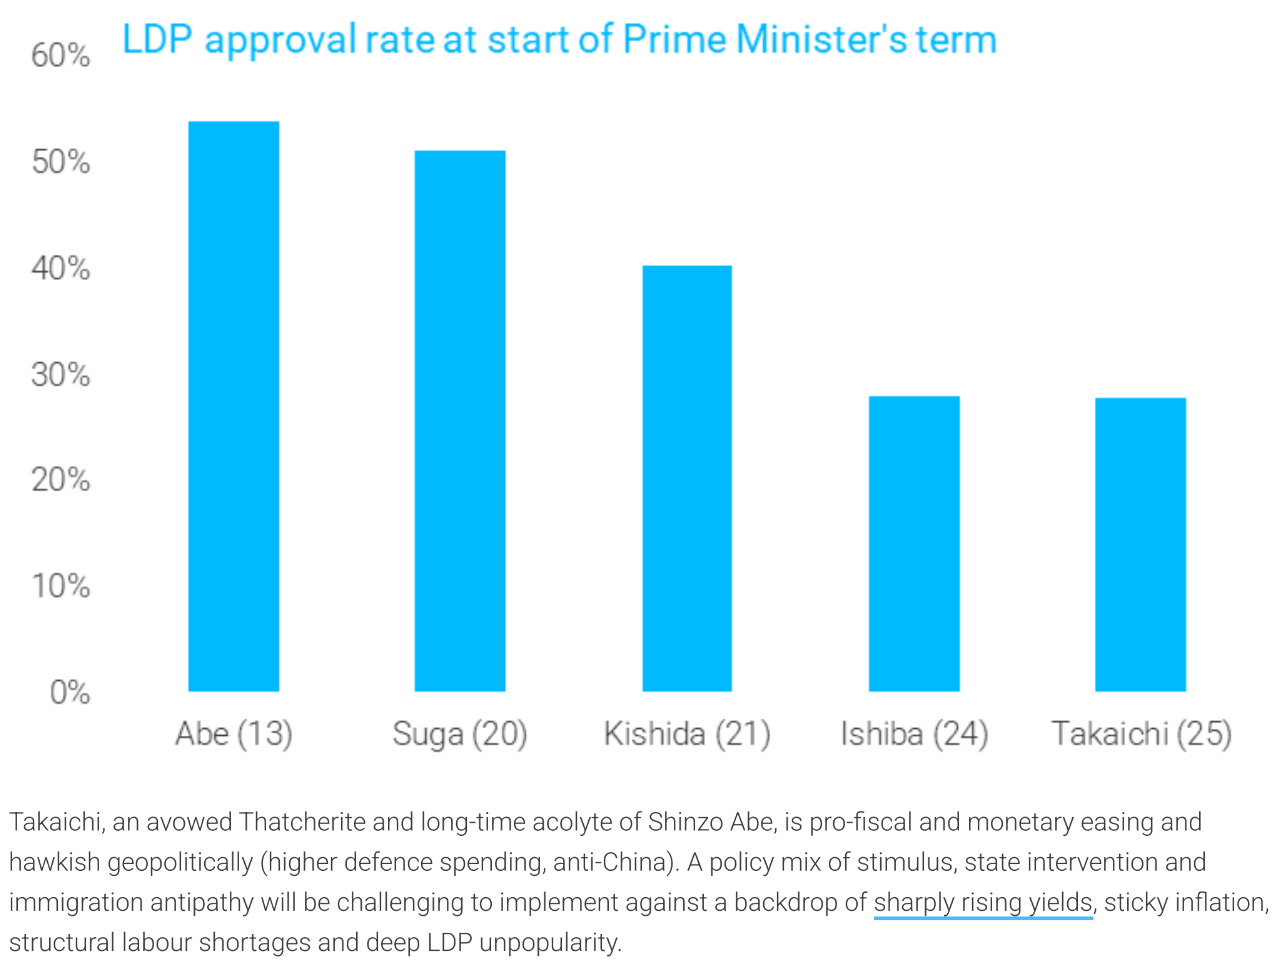
A better argument is Takaichi’s relative approval versus Abe, and other resource constraints in the economy, such as labour.
However, at this point the market wants to feed off the growing deficit narrative. Running with this is the right play.
France
France is once again engulfed in political crisis following the resignation of Prime Minister Lecornu just hours after his cabinet was sworn in. Lecornu lasted less than a month in the job. Lecornu’s is the third French government to collapse in the last 12 months.
Mizuho ascribes the following probabilities to each possible move from here:
Option A – Appoint a new PM (35% probability)
Option B – Dissolve the National Assembly and call for legislative elections (55% probability)
Option C – Resign and call for snap presidential elections (10% probability)
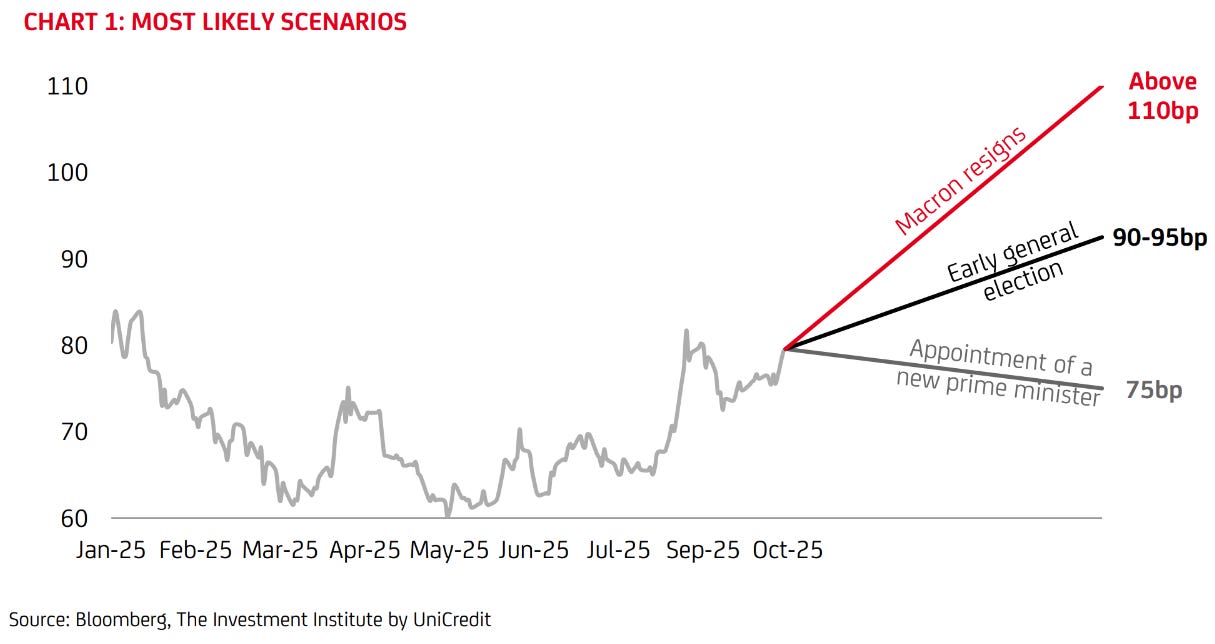
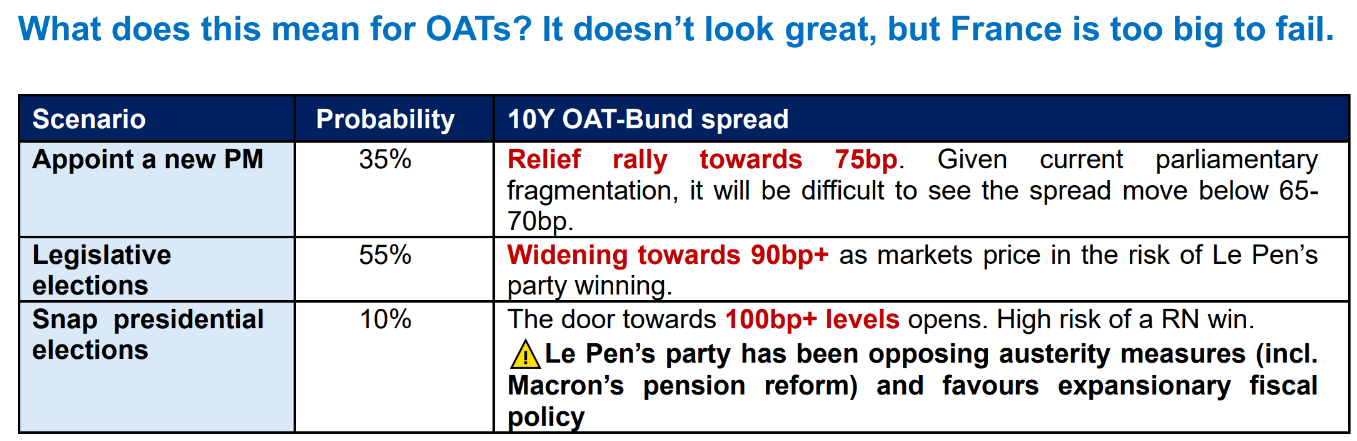
Projections for the OAT-Bund spread are the above in each scenario. The spread has widened a lot already so there isn’t much to happen from here unless the nuclear scenario occurs.
No matter what happens, there is little chance the budget will be passed which is what is causing this situation in the first place.


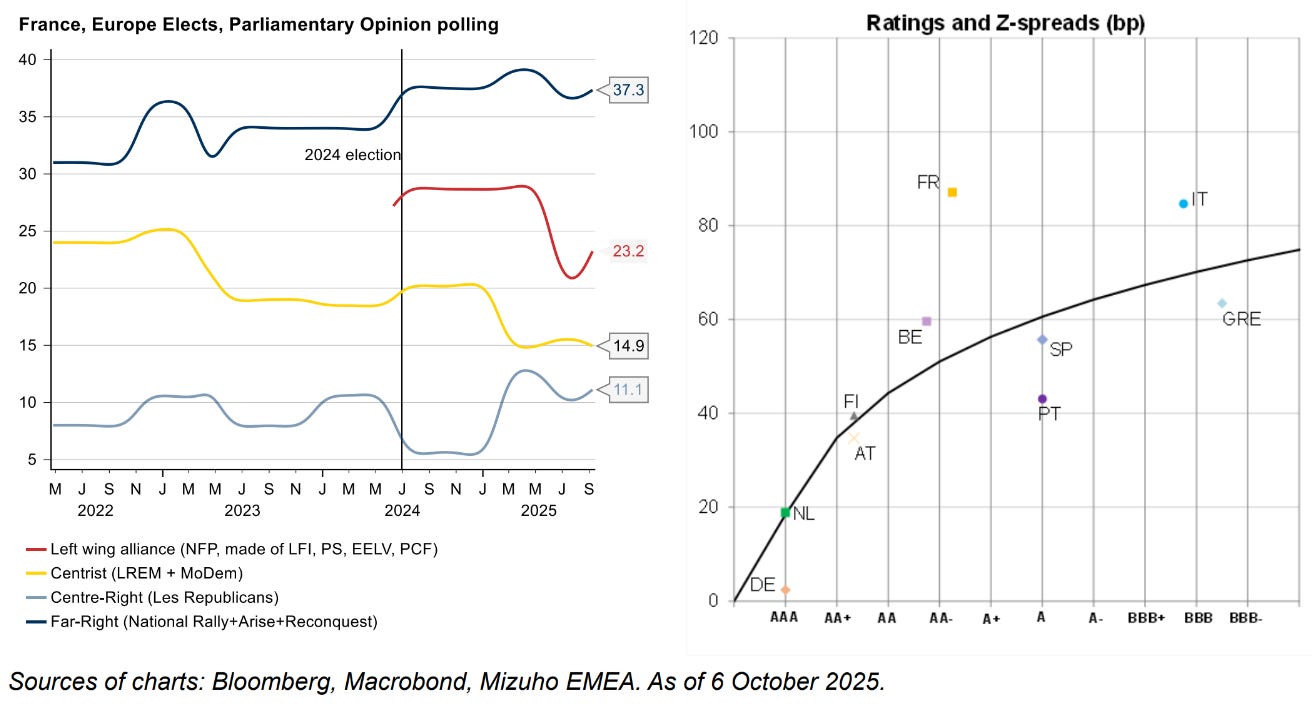
The argument is over pension reform, with the charts above describing the situation France finds itself in. the Socialists continue to position against reform.
So, what has to happen is that the last budget might have to be rolled. If this happens, the deficit stays at the level it is at and doesn’t improve.
A 5.4% GDP deficit is unlikely to be enough for the EU and rating agencies. The current situation poses a big downgrade risk to A+ for France in the coming reviews from Moody’s (24 October) and S&P (28 November).
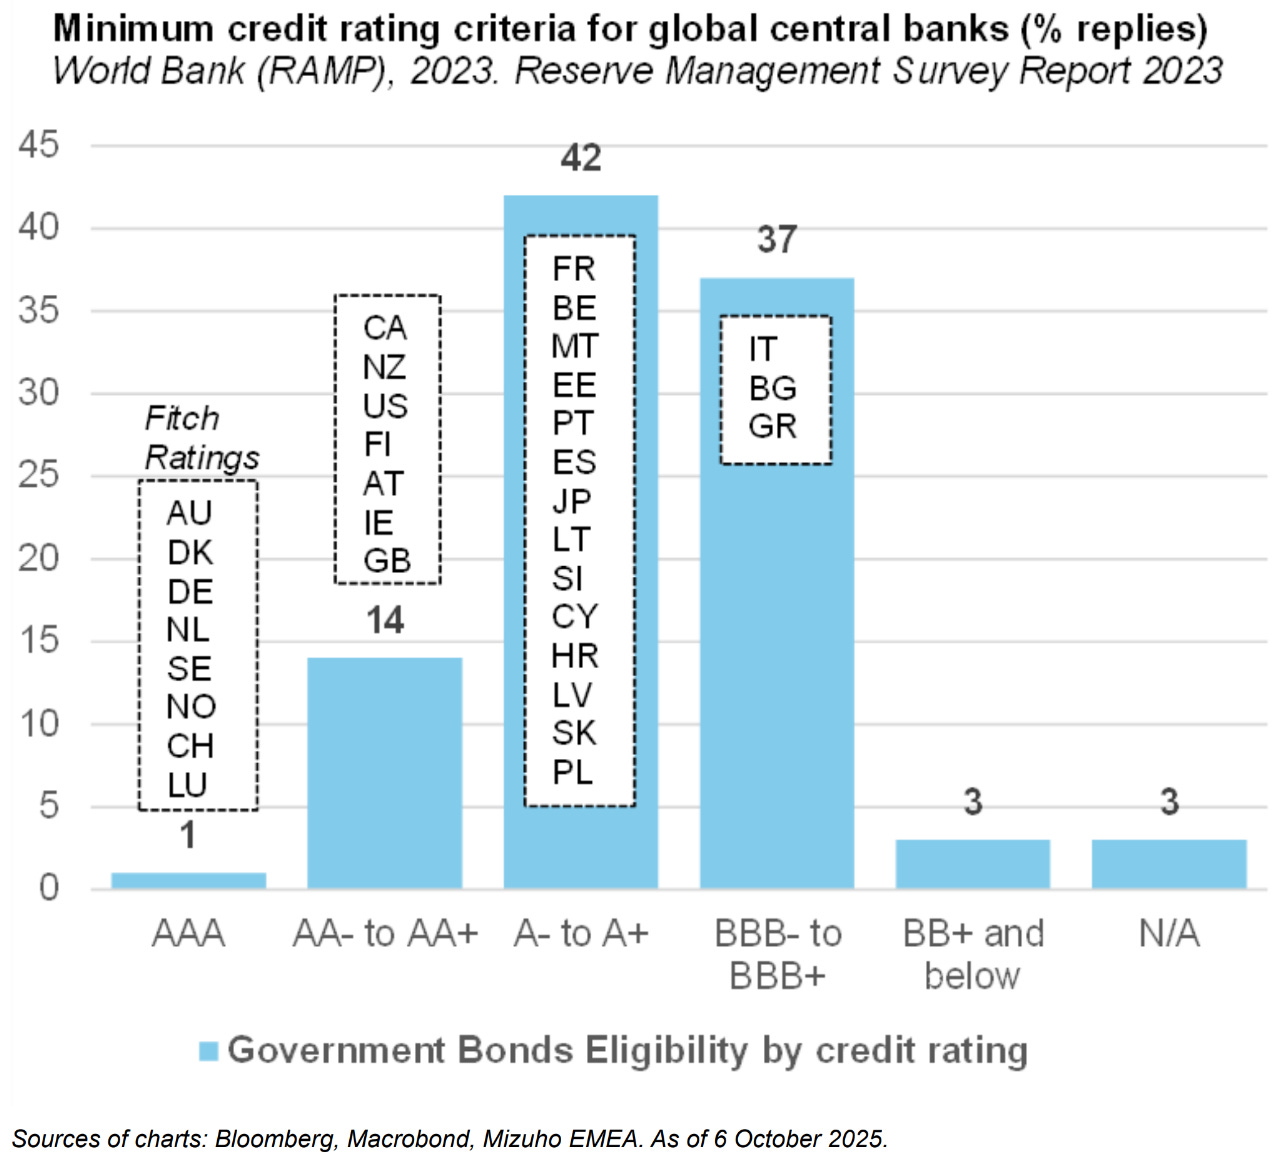
A downgrade will pose an issue for central banks that have floor of AA for purchases, requiring them to sell OATs to comply.
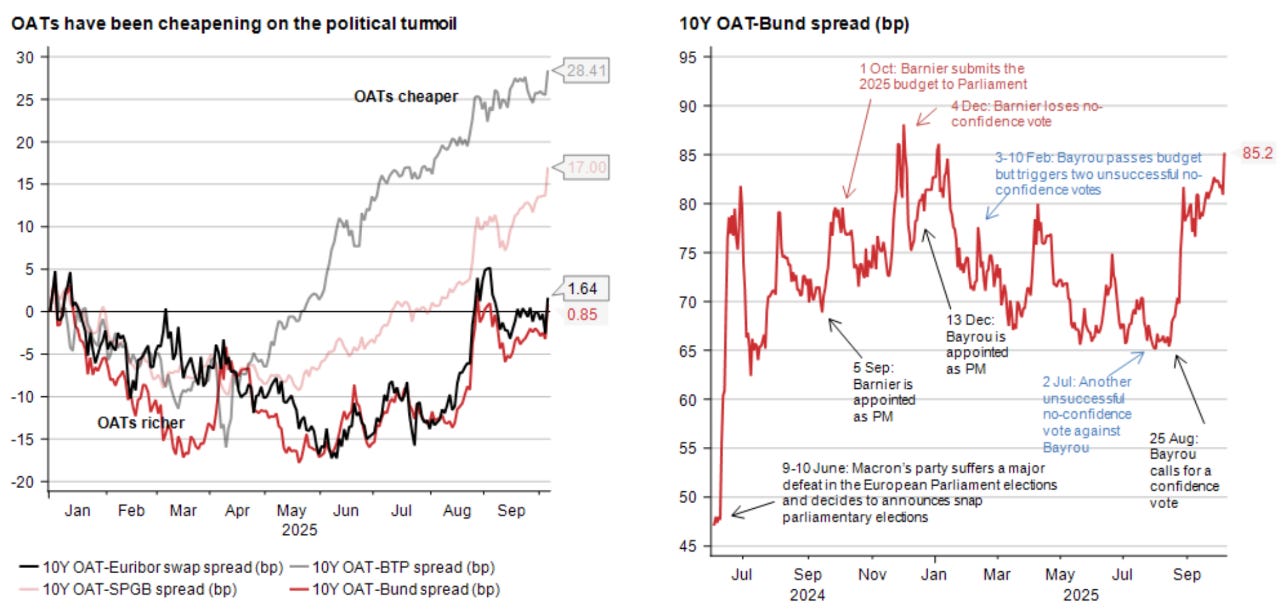
While widening to Bunds has been contained, it is the cheapening of OATs versus the bonds of the much-improved periphery which is the most startling.
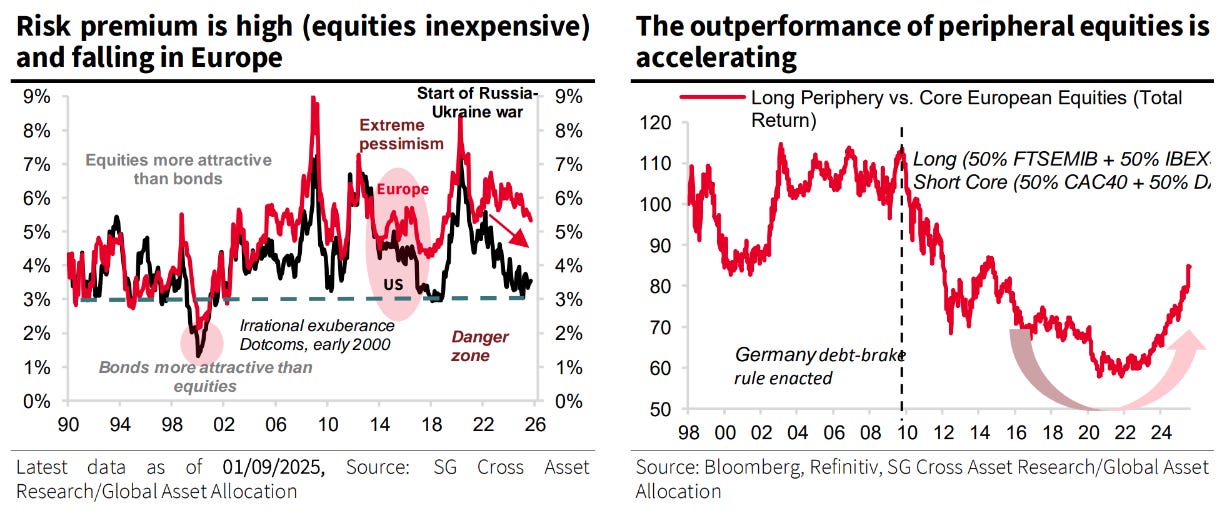
The macro trend
The relative cheapening of Bunds and OATs is because of the fiscal plans/situation of the respective countries.
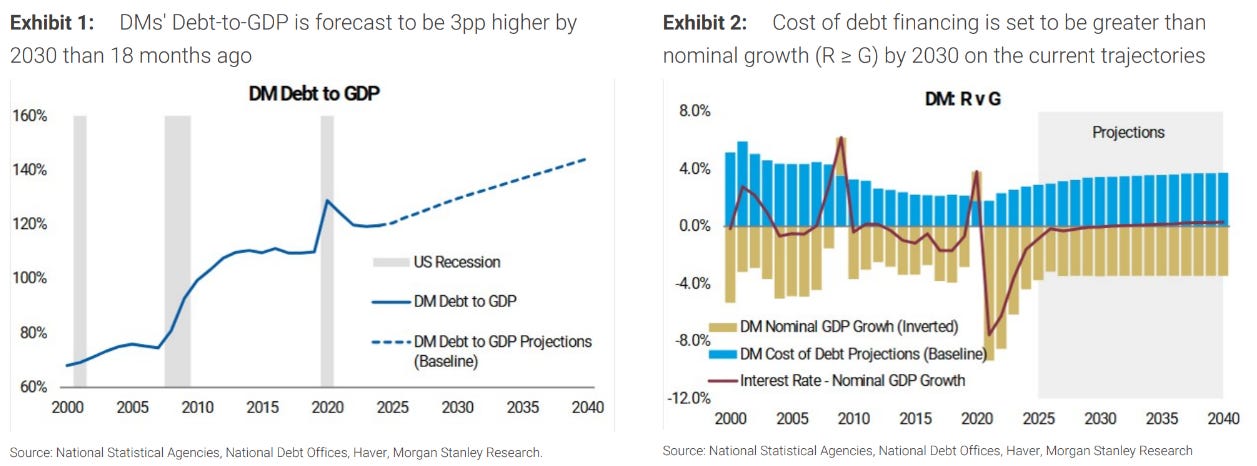
They are not alone of course, with politics moving towards expanded deficits and with that increasing debt/GDP metrics.
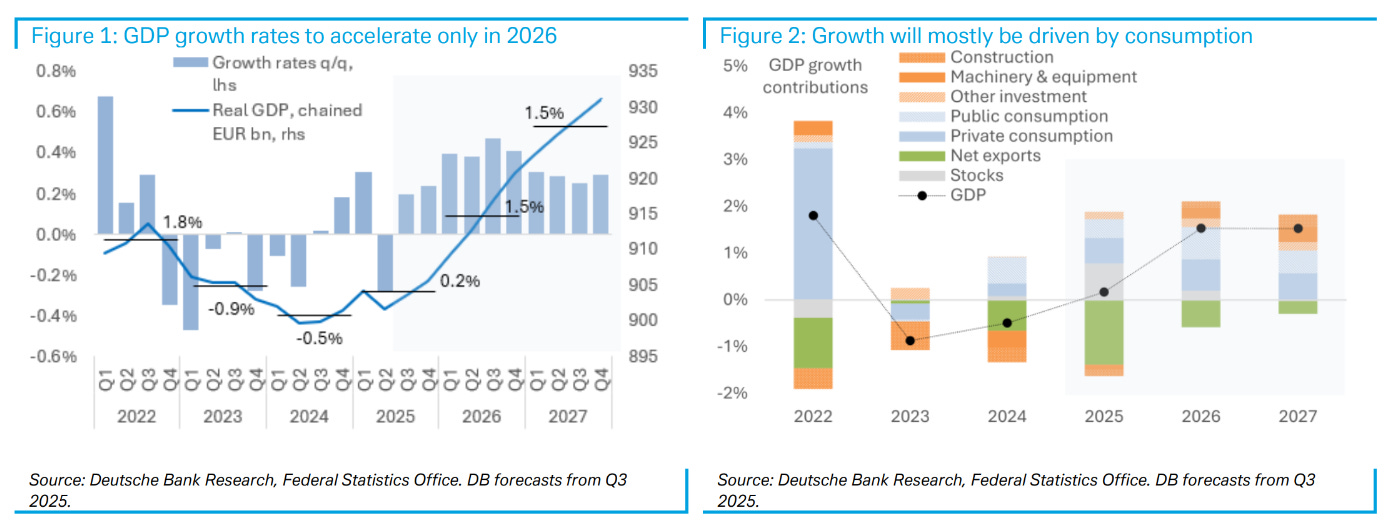
German GDP forecasts have been lifted, with banks starting to settle on 1.5% real GDP growth for 2026, a big change from the zero growth of the last few years.
The strong narratives around this from nearly all macro crooners is that it is driving precious metals, most notably gold, which once again had a stellar month to clear $4000/oz.
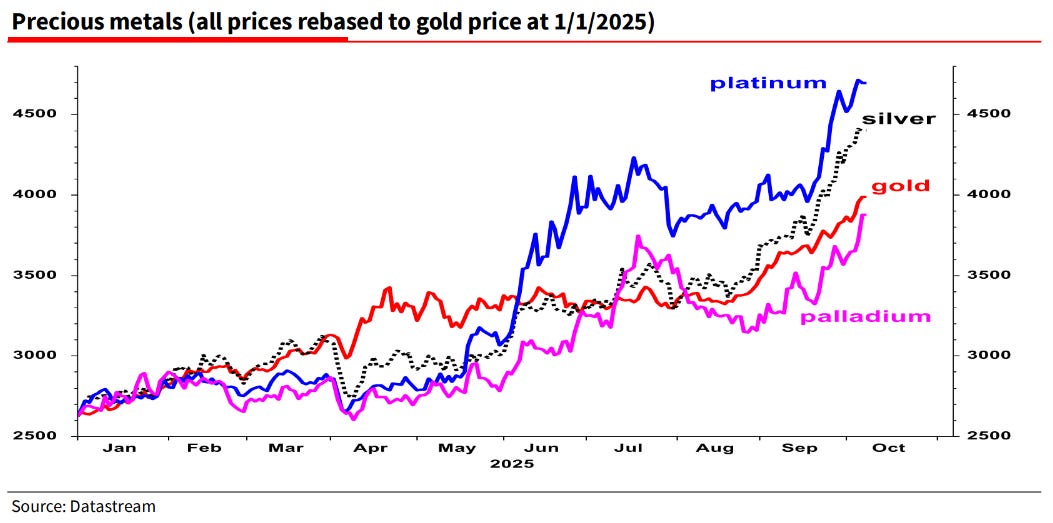
Gold hasn’t been the only precious metal to benefit.
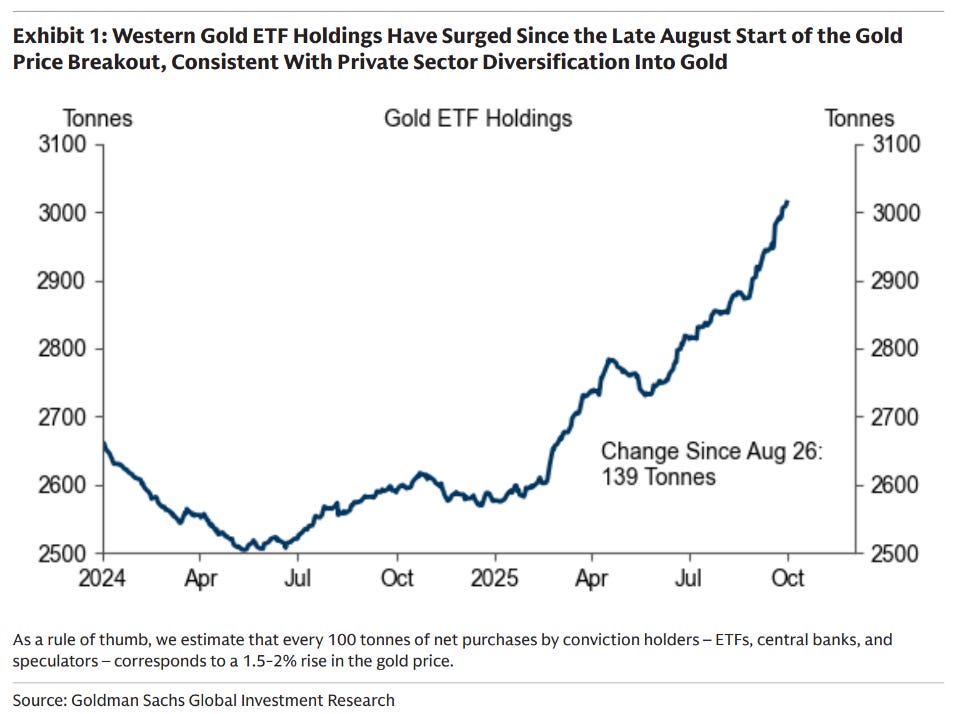
Goldman’s have tried to attribute the move in gold to several different factors. I’ve spoken about Chinese ETFs and their accumulation, but above is the accumulation by western gold ETFs.
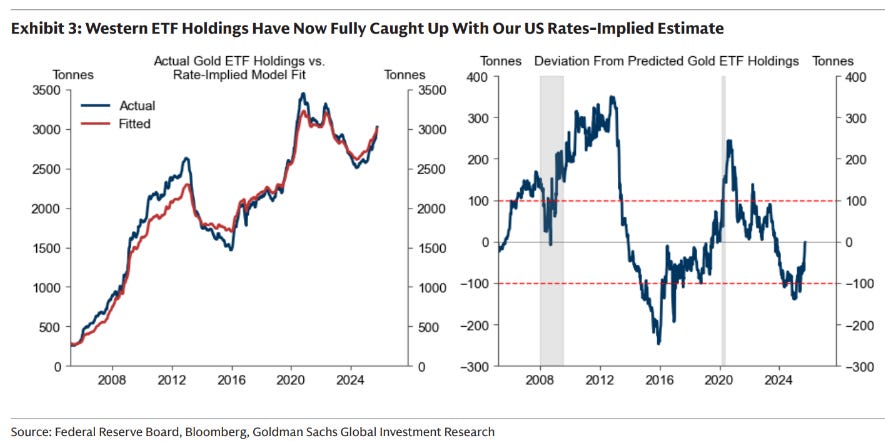
They pin this to the Fed cutting interest rates, which in the past has had a good correlation. The interest rates implied model is so strong because gold is a negative yielding asset - it costs you to store it rather than earning you income - so as short rates fall, it becomes a less costly asset to hold. Note that this has nothing to do with the fiscal position of governments.
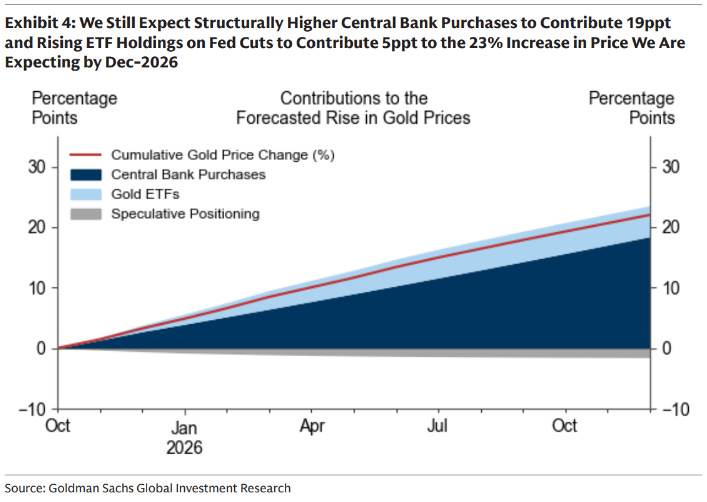
Their bullish forecast for gold (23% by the end of next year) is driven by the factors above, with central bank purchases still being the largest factor by far, well over that of ETFs purchases.

I haven’t done a “charts I hate” in a while but this is one that’s done the rounds this week. While the start date chosen seems arbitrary being the turn of the century, it was in fact when gold was at its lows, and equities at their pre-dotcom highs. Move it by a little and the outcome is vastly different.