
Charts & Notes: I-eeee-PA!!
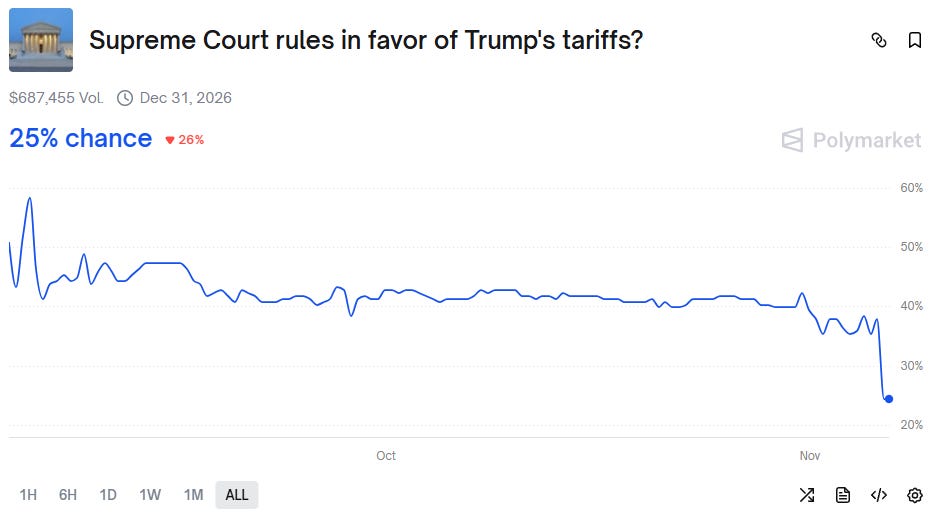
The cover for Trump's tariffs hits trouble at the Supreme Court

The Trump tariffs have been one of the biggest macro themes in years. Imagine them not only being reversed but paid back as well!
Tariffs, IEEPA and SCOTUS
After losing in the Court of International Trade, the Federal court and D.C. District court, Trump’s team has taken the challenge that tariffs can’t be imposed under IEEPA (International Emergency Economic Powers Act) to the Supreme Court.
I write on it because the hearings are going on now and it doesn’t seem to be going well for Trump, with some doubt from the friendly justices so far.
Unlike the bulk of cases brought against Trump’s orders, this one is genuinely a question of law and the reading of the legislation.
The case rests on SCOTUS’ view if tariffs are taxes or not, an argument that has played out endlessly on X since April. Those that are generally anti-Trump just view tariffs as a cynical way to raise money from citizens, while those that agree with Trump’s stance on international trade see the revenue raising as a side effect of the primary goal (which is to manage external trade).
I’m in both camps. I do agree that China’s dominant position as the world’s goods manufacturer wasn’t earned fairly and that some action needs to be taken. However, I also know that tariffs can’t work unless they raise prices for domestic consumers and thus raise taxes for the Federal government!

There is also the issue of how sympathetic the court is to the concept of Presidential power, balanced against the using arguably arcane statutes to implement that power.
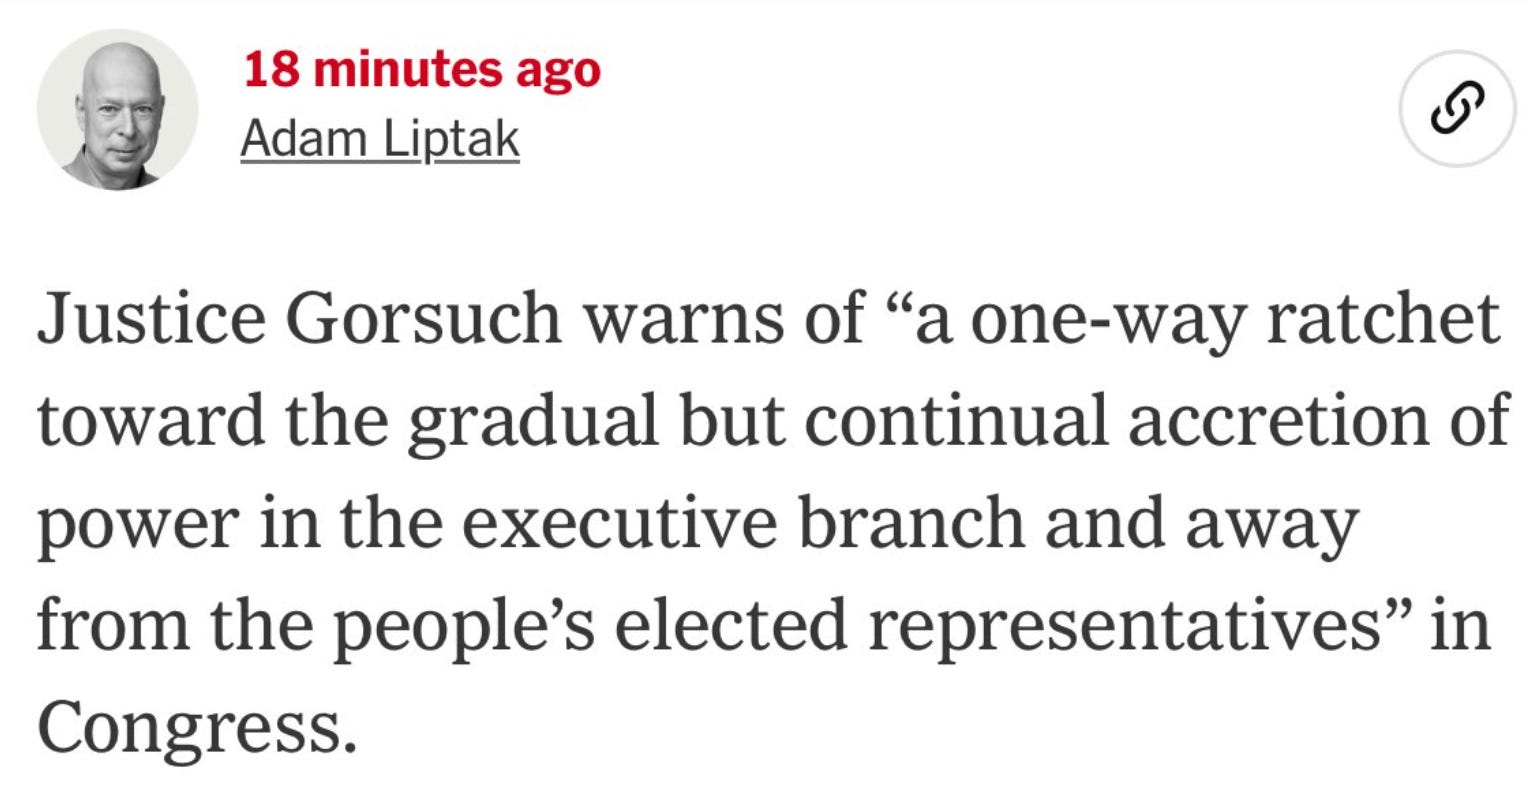
Justice Gorsuch is making his views clear on this one.

Jonathan Turley, usually a supporter of Trump, is also sceptical.
This could go either way. A decision wasn’t expected until the middle of next year, but some say it could arrive before the end of 2025. After that will come the questions of tariff refunds to importers, on which Justice Alito has said that the court should rule on that simultaneously (another bad sign for IEEPA tariffs).

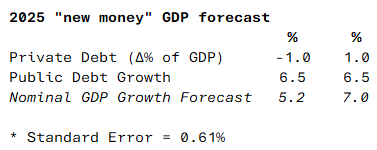
Goldmans have provided the table above summarising the facts (although it was produced before the hearing which would change the “likely vote split”).
The administration likely has plans to shift most of those IEEPA tariffs (those targeting goods from China, Hong Kong, Canada, and Mexico mostly) with other types that would likely reduce the ability for Trump to change them when he needed to, resulting in a slower process through Congress.
In the table above, Goldmans estimate that the current 11% average tariff rate is made up of 7.6% of IEEPA tariffs. If they were switched to other types, the total tariff rate could still fall by 1 to 3.5%.

The size of tariffs compares to all takings due to corporation tax. Reversing this would introduce another unknown, which would be as big as the introduction of tariffs themselves.
Technically, the tariffs tightened fiscal policy this year, although this was into modest loosening through the OBBB. If the tariffs are removed and repaid, then it is equivalent to a loosening of the same amount!
This should drive 10-year bond yields higher, but this would ignore the downward effect on inflation from tariffs no longer being an inflationary impulse.
At this point it would be scary to give the US economy any more fuel.
Long-term nominal growth
Deutsche did a short piece this week on very long-term nominal growth and its link with equity returns.
From DB:
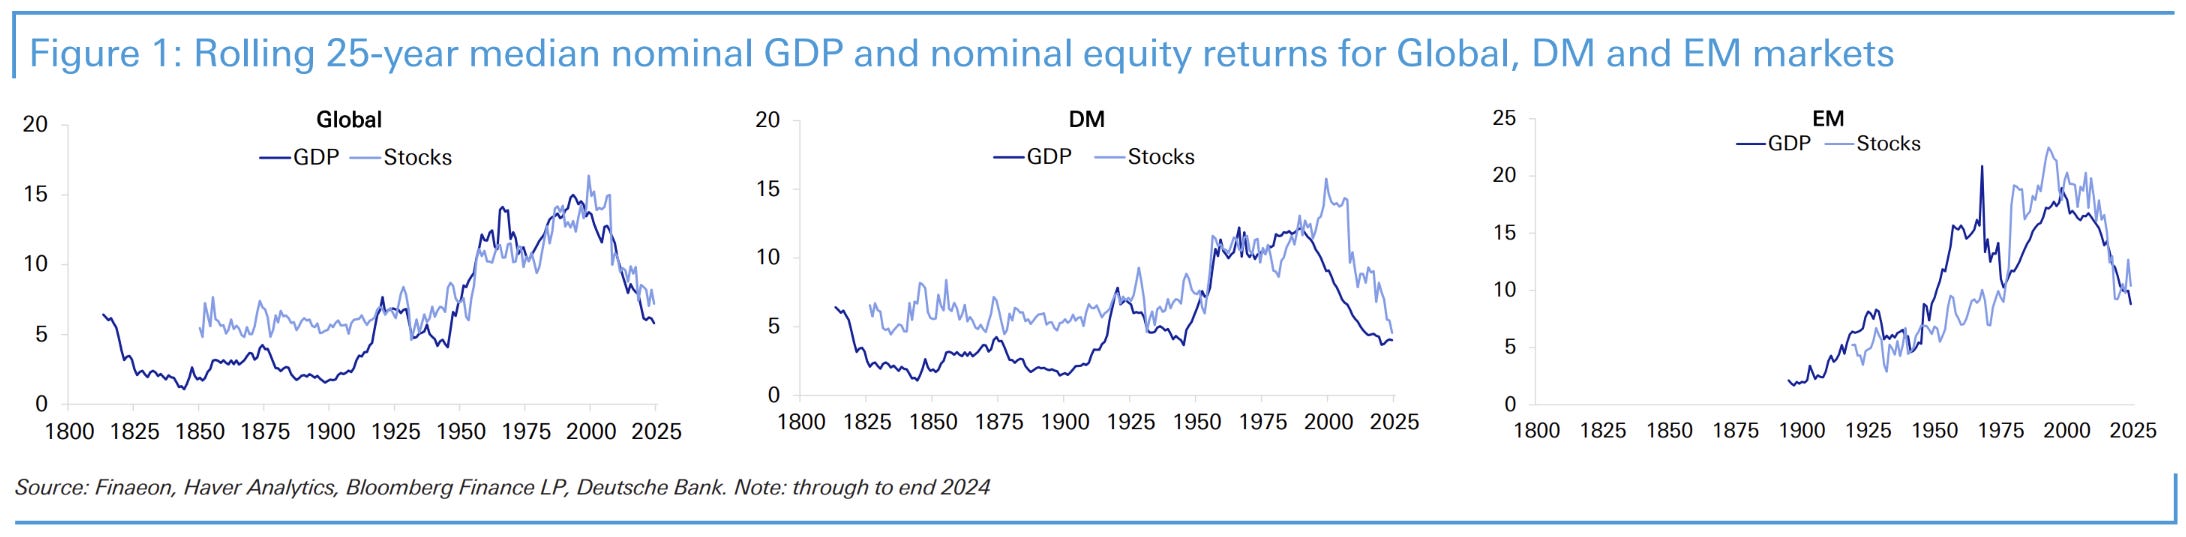
Today’s CoTD uses data from the study to show rolling 25-year median nominal GDP and nominal equity returns for global, EM, and DM markets, using annual data up to the end of 2024. The pre-1900 data should be treated cautiously as equity markets were smaller as a share of GDP, but over the past century there has been a strong gravitational pull from nominal growth to nominal equity returns. In the long run, equities can’t outrun nominal GDP — it drives earnings, incomes, spending, rates, and fiscal capacity.
I broadly agree with their assessment above, although they may have the causality the wrong way around. There is a strong link between the creation of money (debt growth) and nominal GDP.
The creation of money facilitates growth in the circulation of it, resulting in higher spending, and earnings.
Since 1900, global nominal GDP (in USD) has grown at an average of 5.7% a year, peaking in the inflationary, high-growth decades around the 1970s. Excluding that surge, it’s averaged roughly 4.8%, and the IMF projects about 5% growth through 2030 — broadly in line with history. EMs have outpaced DMs since the 1970s, while developed-market nominal growth hit lows in the 2010s that hadn’t been seen since the Great Depression.

In the post pandemic era we haven’t been far off this average that DB has noted above.
Note that this historical average growth was during times of much greater population growth and technological development. These days it’s just debt.

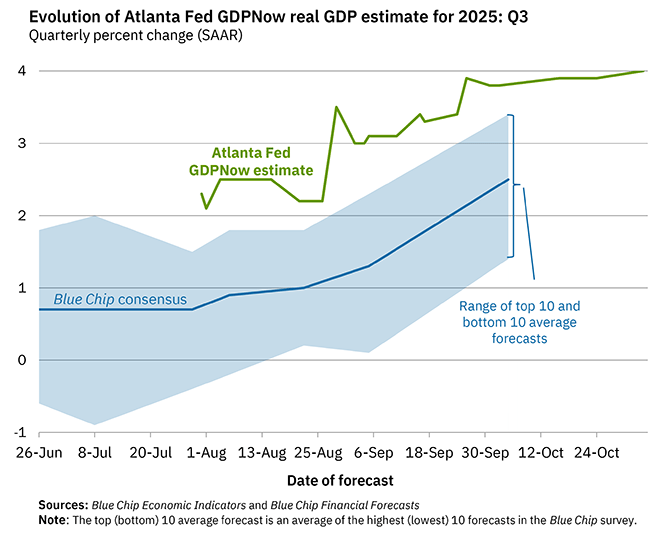
If Q3 & Q4 GDP print anywhere near what the GDPNow model thinks, my forecasts from the article above will finally be true for the second half of the year.
Random markets charts
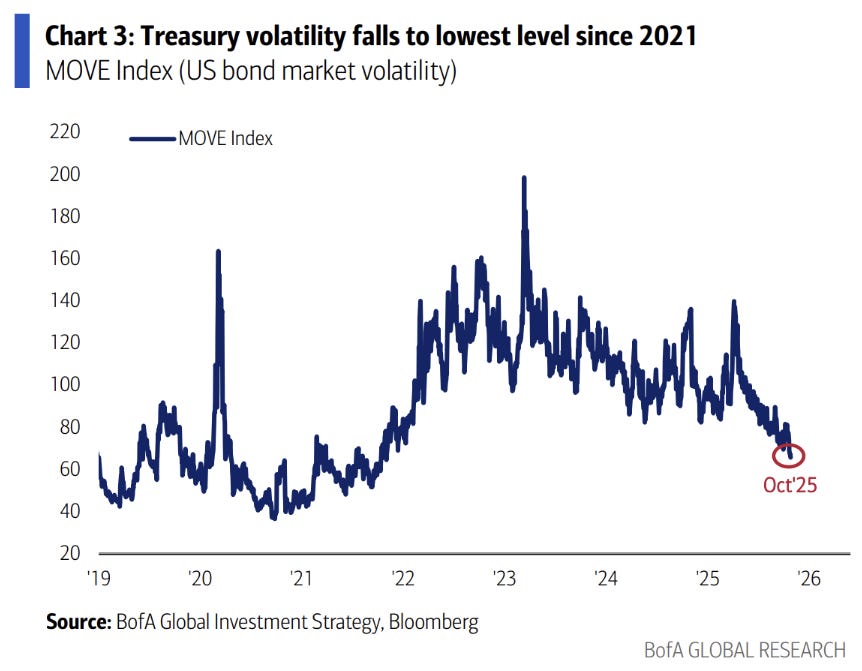
Bond volatility continues to fall. This is opposite of what usually occurs when a new monetary policy cycle starts, but in this case, it is not driven by emergency (either a growth or inflation driven emergency).
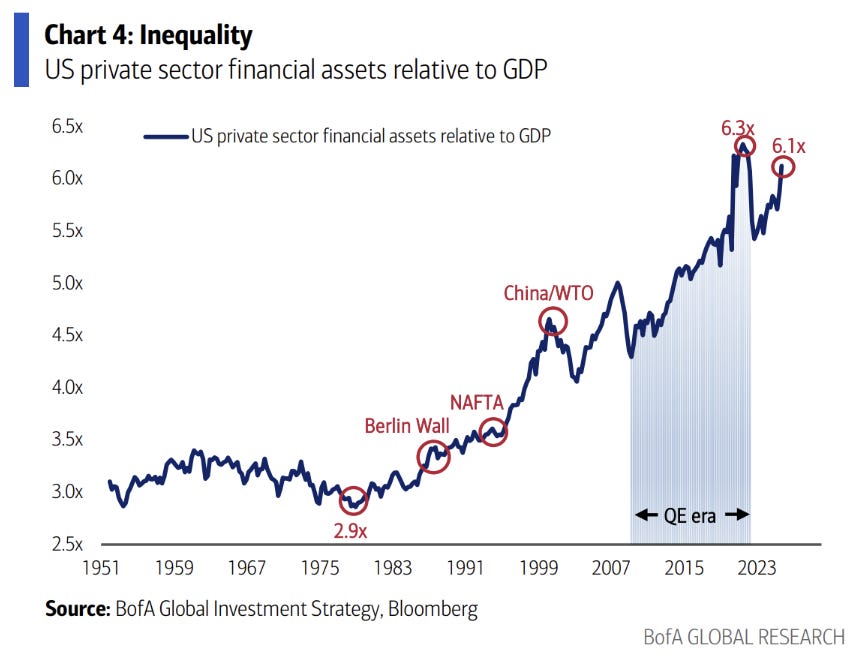
Ignore the “QE era” shading on this BofA chart. The huge run of nominal GDP growth has actually reduced asset/GDP somewhat from the post-pandemic highs, but the level of debt accumulation is still causing it to grow faster than trend.
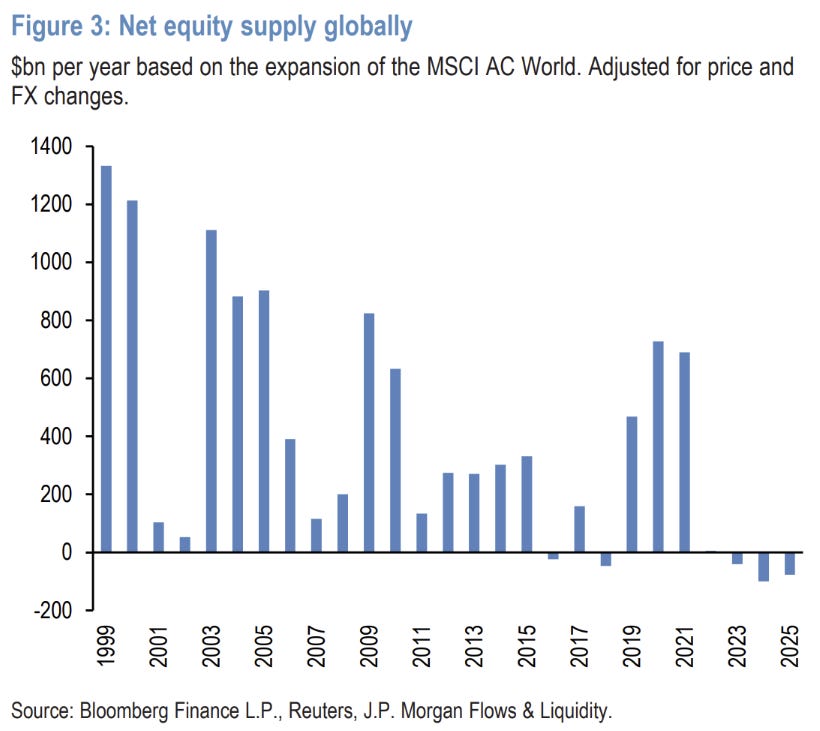
Part of the reason for this in equity markets is due to the low supply of equity securities. Partially due to buybacks, and partially due to the lack on enthusiasm for PE-backed IPOs.