
Charts & Notes: Economic war waged
The war has already had casualties with the bond market entering triage

Not a week many will forget quickly. After a bond market rout triggered by leveraged unwinds of the Treasury basis trade, Trump called off last week’s tariffs opting instead for a universal tariff of 10% for everyone except China.
GS summarises the shift below, with their expectations of the Chinese fiscal response (more on this later)…
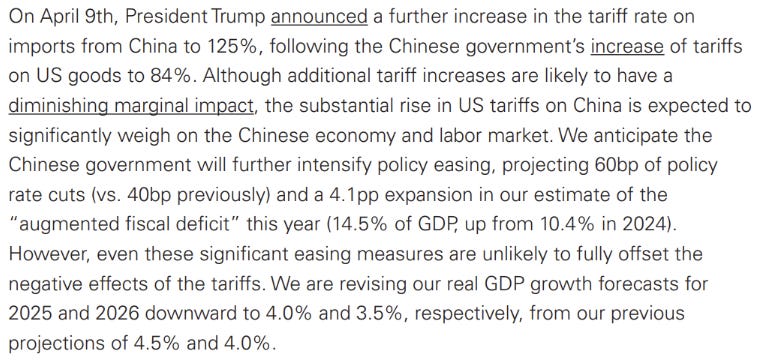
…while quickly reversing their recession call for the US.

It’s quite amazing we are left at a place where the current situation (10% universal tariffs and >100% tariffs on China) that would have been unthinkable a few months ago was cheered with a 9.5% rally in the S&P500 this week.
Whether this was initially intended to be like this or not doesn’t matter. The US-Chinese trade war is the main storyline.
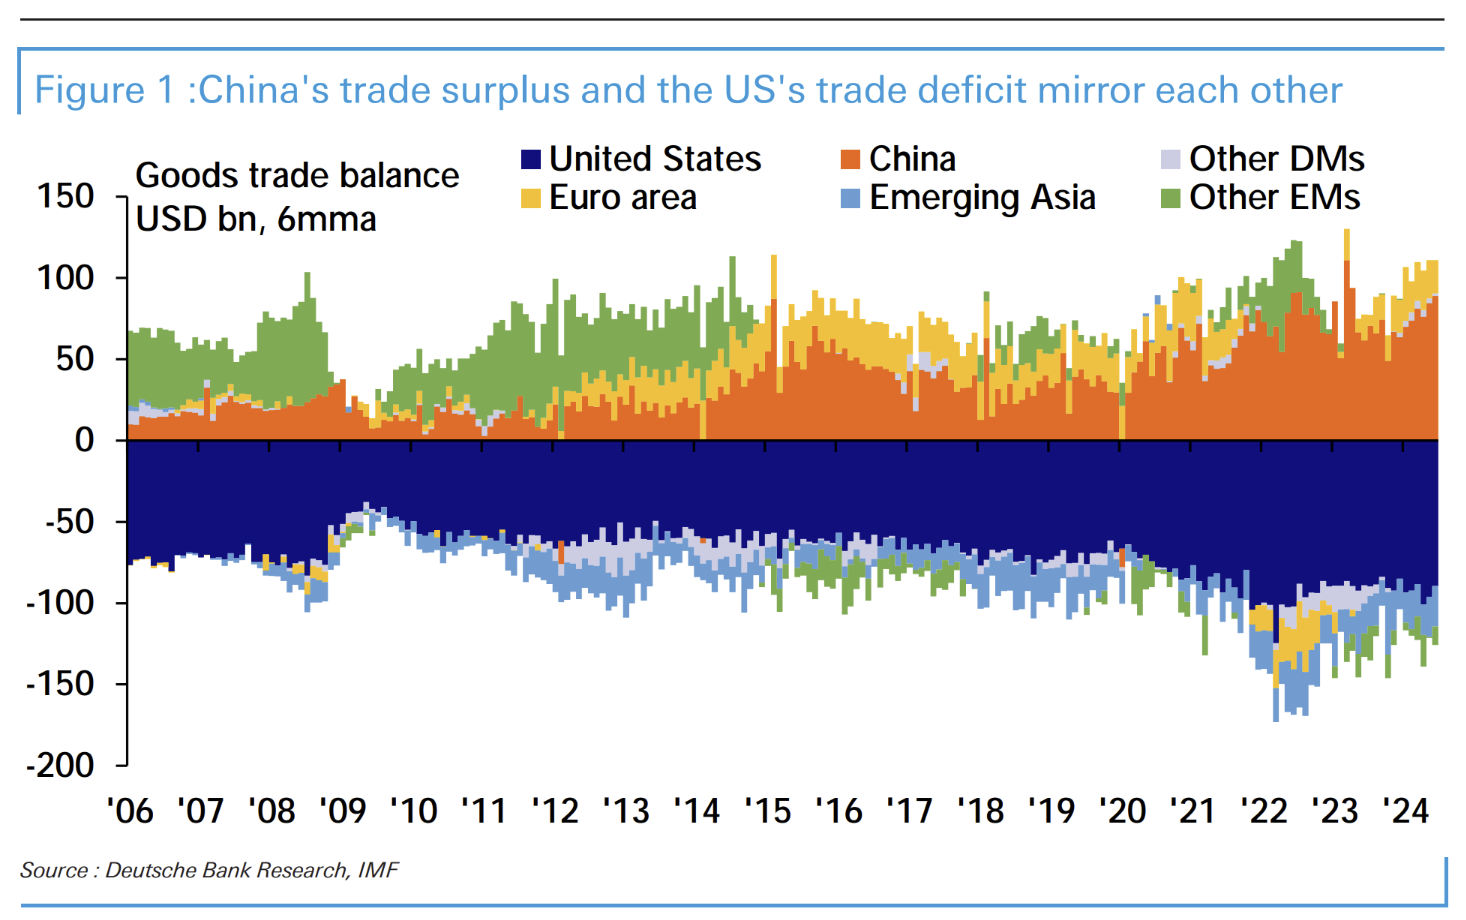
The chart above highlights the two things that lead us to where we are, and I have spoken about countless times. The US and China are stuck in a symbiotic dance of trade reliance enabled by decades of debt accumulation (read below for more).

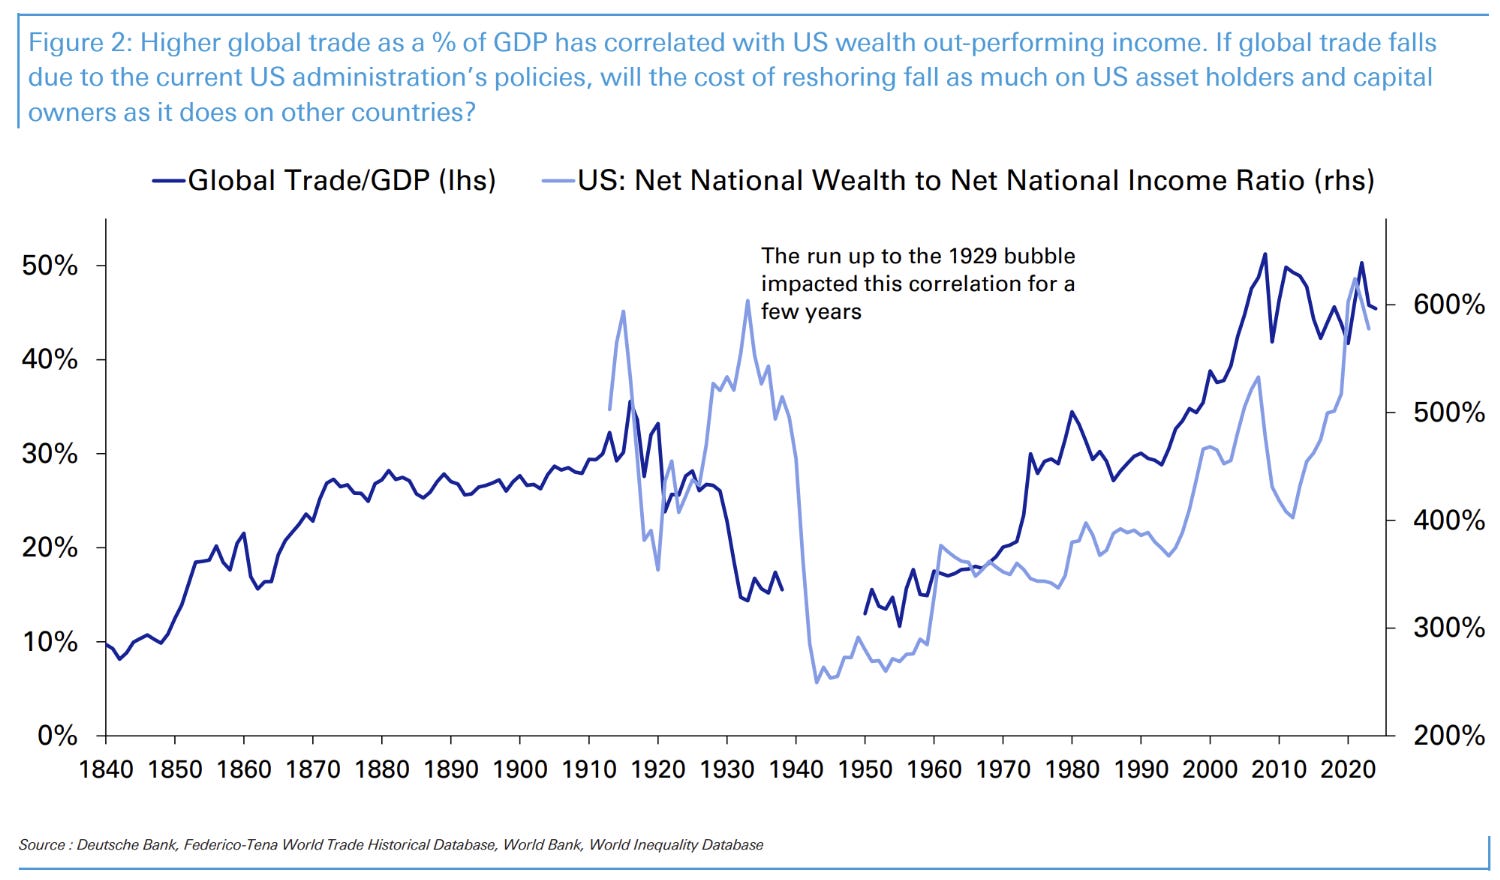
The debt has driven asset prices relative to incomes. More debt has been used to paper over that fact. An attempted unwind will be painful.
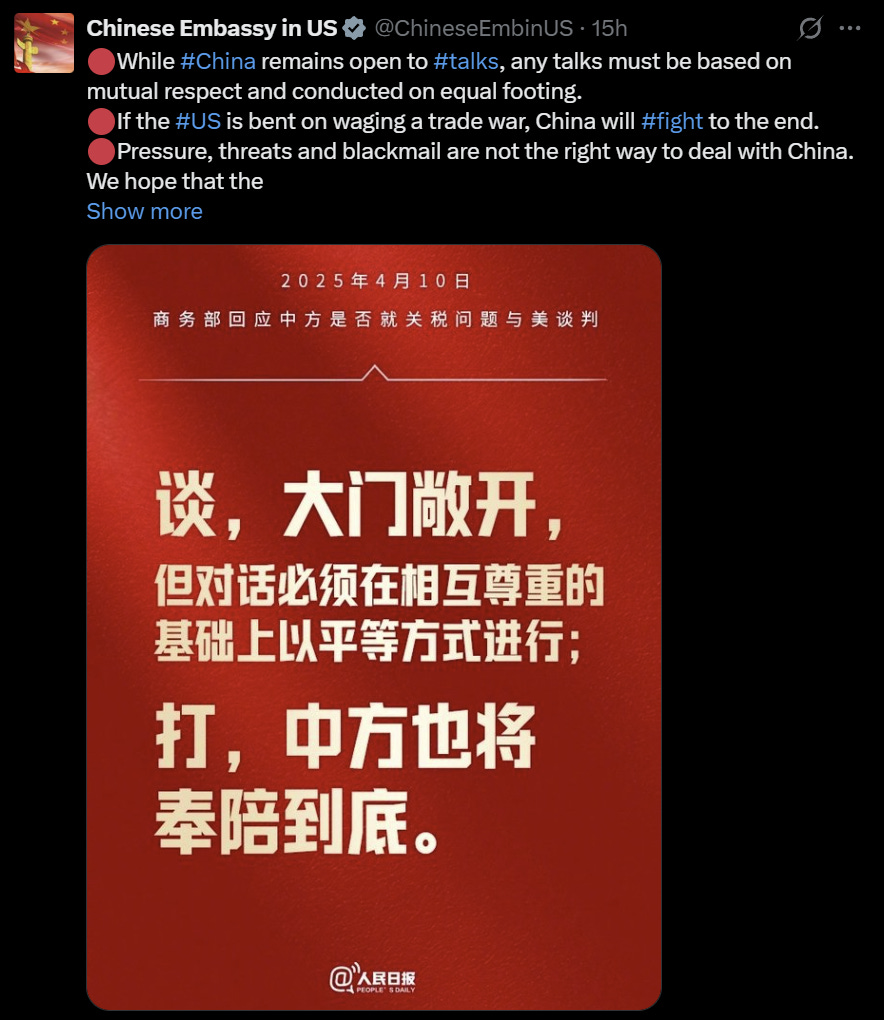
China’s vow that it will “fight to the end” shouldn’t be a surprise. The US has effectively closed its capital account to China, replicating her own tactics.
The bond market rout
We’ll have to look at the volatility in the US Treasury market first because it was the factor that drove Trump to issue tariff relief.
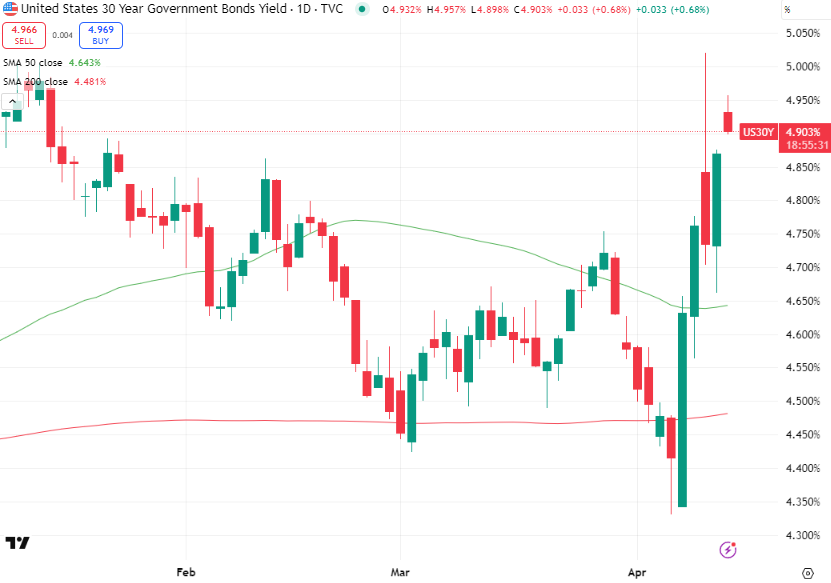
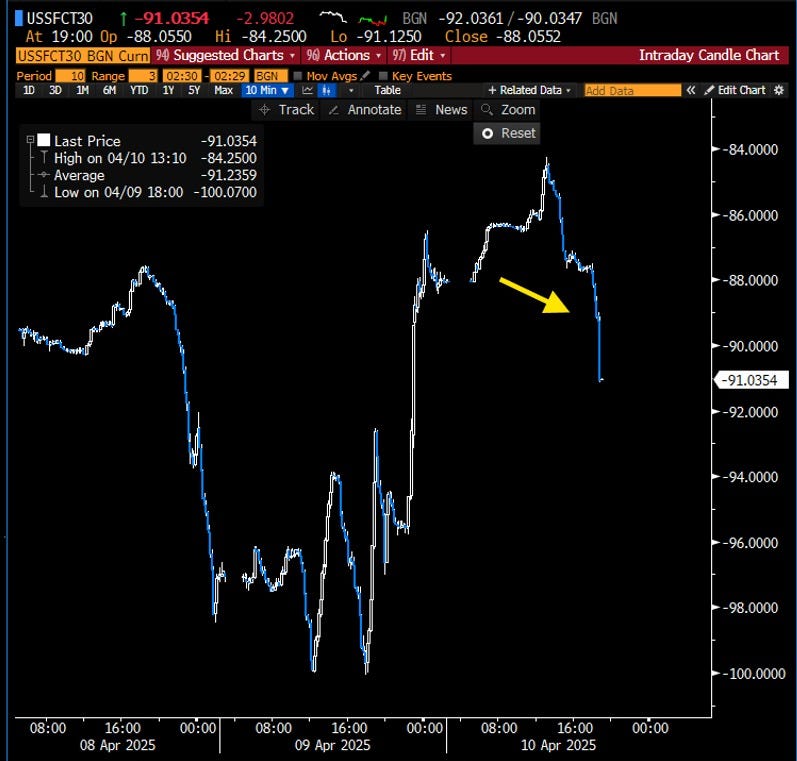
At the 30-year part of the curve, yields backed-up from 4.35% to trading briefly above 5% at the worst of it.
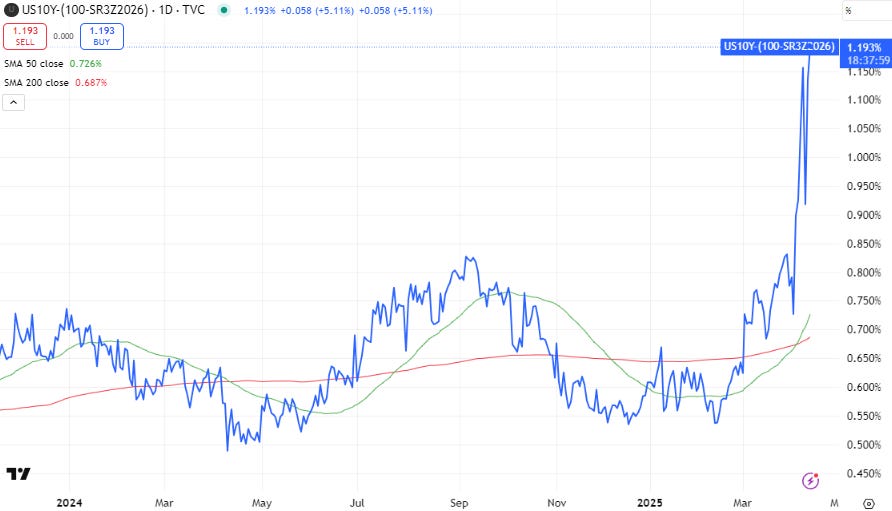
The US 10-year vs. Dec-26 SOFR was equally as incredible.
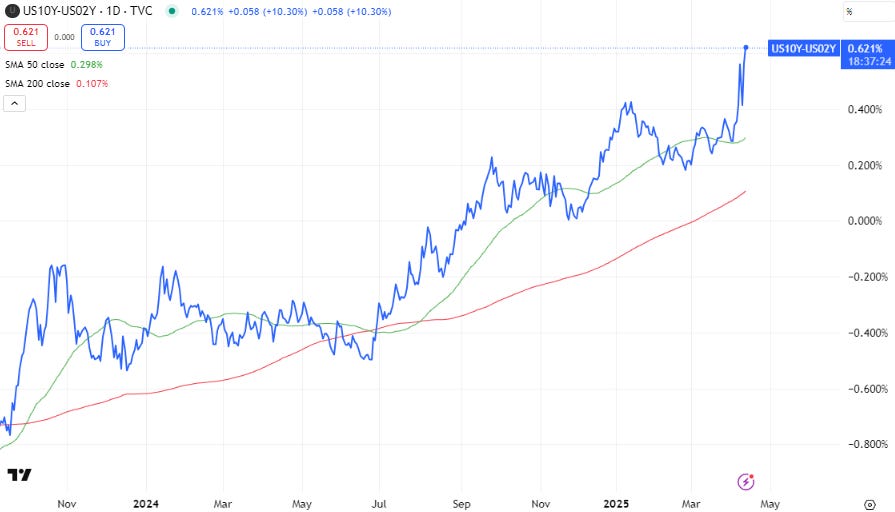
2s10s with a less dramatic steepening, however this week’s move in the 2s10s curve is one of the biggest in history, beaten only by a few days in the GFC.
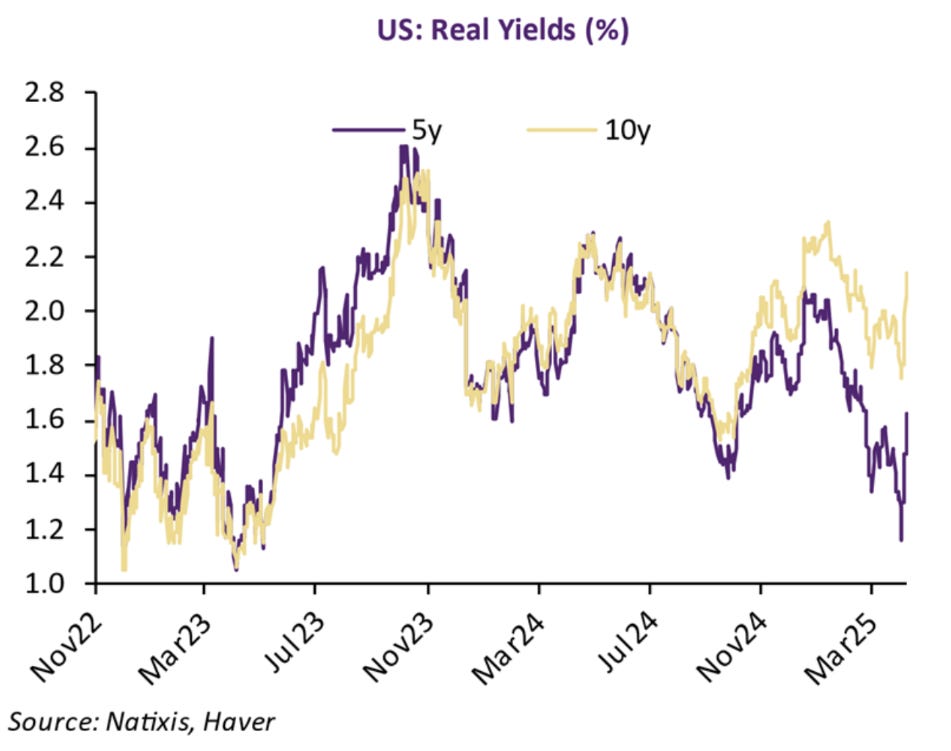
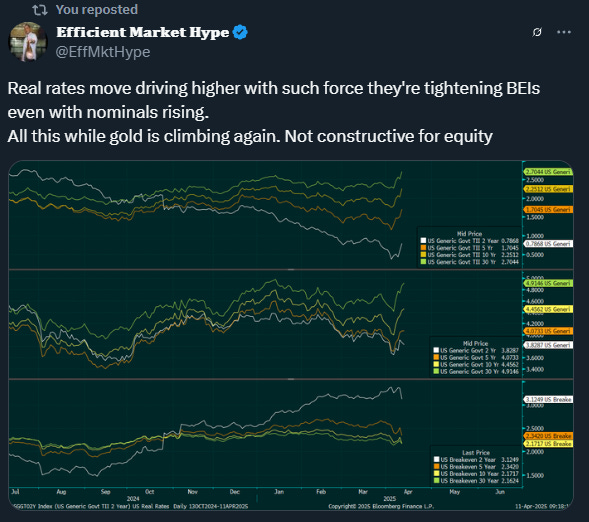
Even though growth is falling, this has led real yields to rise. Counter-intuitive, and ominous.
This has all been triggered by hedge funds (rumoured to be Japanese based which would explain why it happened in Asian hours), and a seemingly forced unwind of the “basis trade”.
A short explainer:
The “basis trade” (or “swap spread trade”) is a trade that plays the difference between the yield on physical bonds and their respective swap rate.
Many hedge funds were looking for “widening” of the spread by buying US Treasury (let’s say 30-year) on repo (so minimal cash needed = mega leverage). Because the swap spread was negative, a widening is when the number in the chart above became less negative. I think the idea was that regulatory reform would correct the swap spread which over history has normally been positive (as you’d expect as swap should be riskier than a Treasury bond).
Once the spread started moving in the middle of the night US time, unwinds started.
The problematic part of the unwind is trying to sell the Treasury bond, as the said regulatory limits (specifically the SLR) reduce the ability for banks to take those bonds on their own balance sheet.
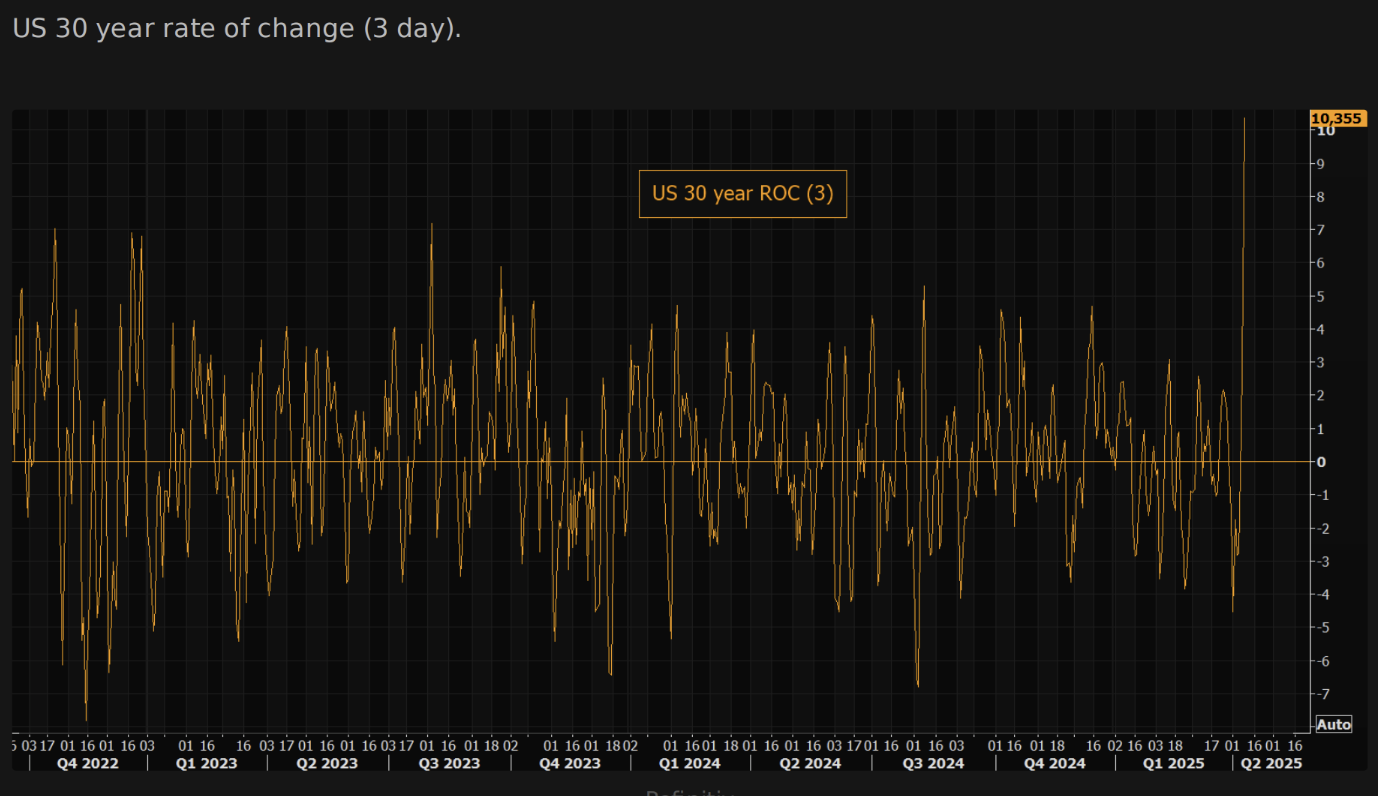
This effect pushed bond prices down and yields up by the incredible 65bp in the first chart of the section.
All this uncertainty drove an incredible move which, at the time of writing, doesn’t look like it has fully abated.
The moves have made liquidity evaporate from bond futures markets. Not great.
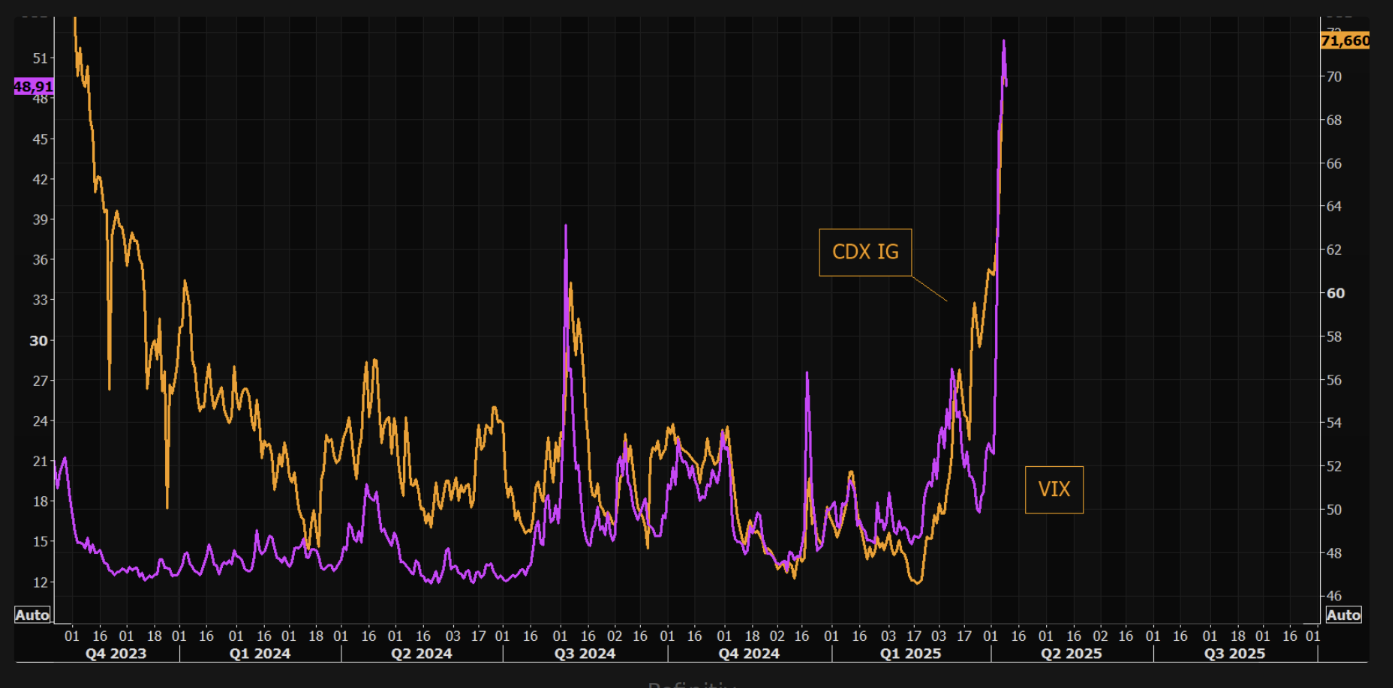
Credit has finally found sellers. It takes a while to shake the learned behaviours of 2022 onwards.
Equity volatility!
On the equity side of things, the pandemic is still technically “worse” in terms of outright vol levels, but the daily realised vol is certainly worse, and correlations between asset classes are breaking day-by-day.

This table might be the best way to show what I mean by that. The move higher on the 9th was incredible.
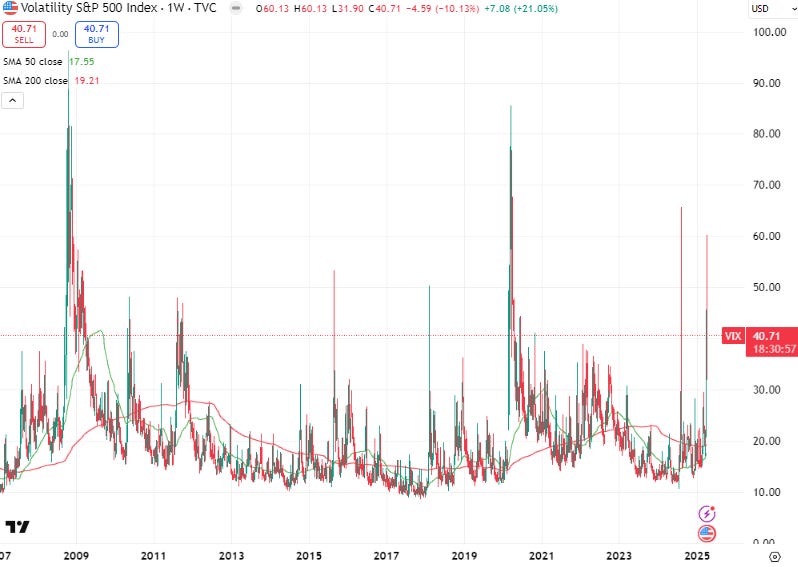
The VIX and the VX futures set haven’t seemed to have reacted to the extreme daily realised vol, however.
Part of the reason for this is the extremely binary nature of the imposition of tariffs.
Implied volatility is being discounted by the near 50/50 (I estimated 60/40 from the 8th of April) chances of tariffs off/tariffs on. This means that it will chronically underprice realised vol, which explains the inverted VX curve below.

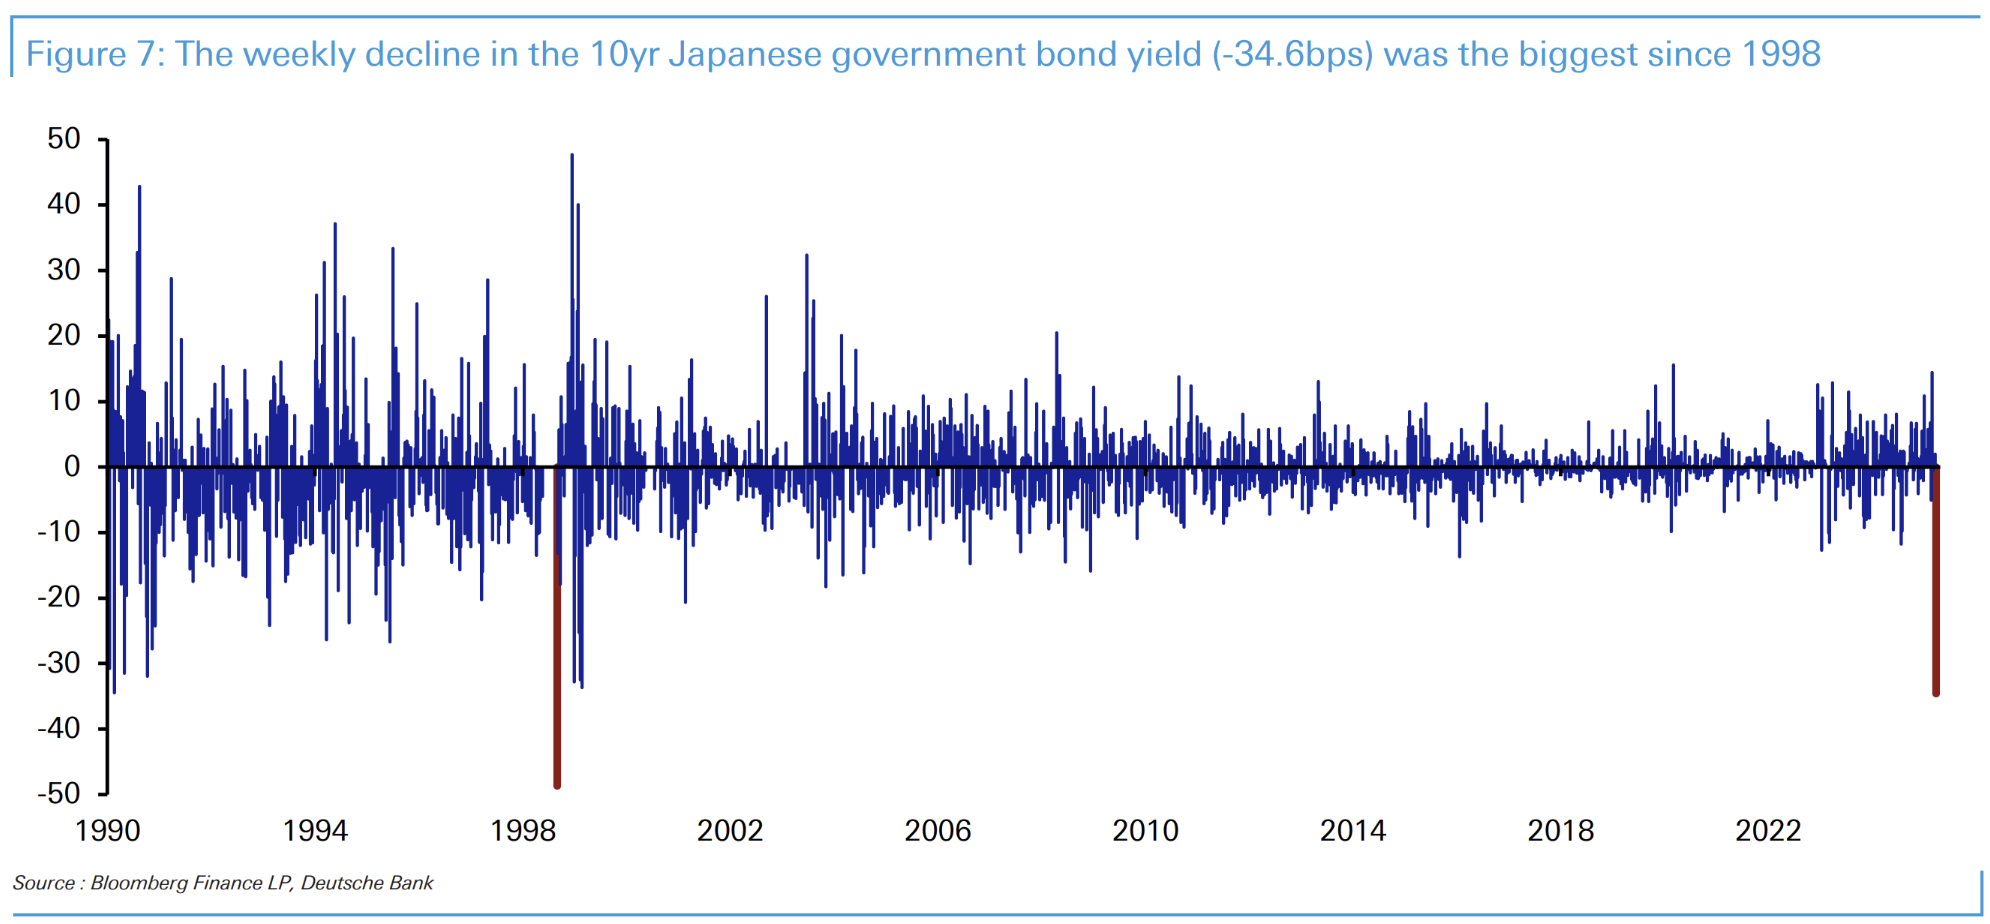
Supporting the thesis is moves in other asset classes. We’ve seen what US yields did, now Japanese 10-year bonds…
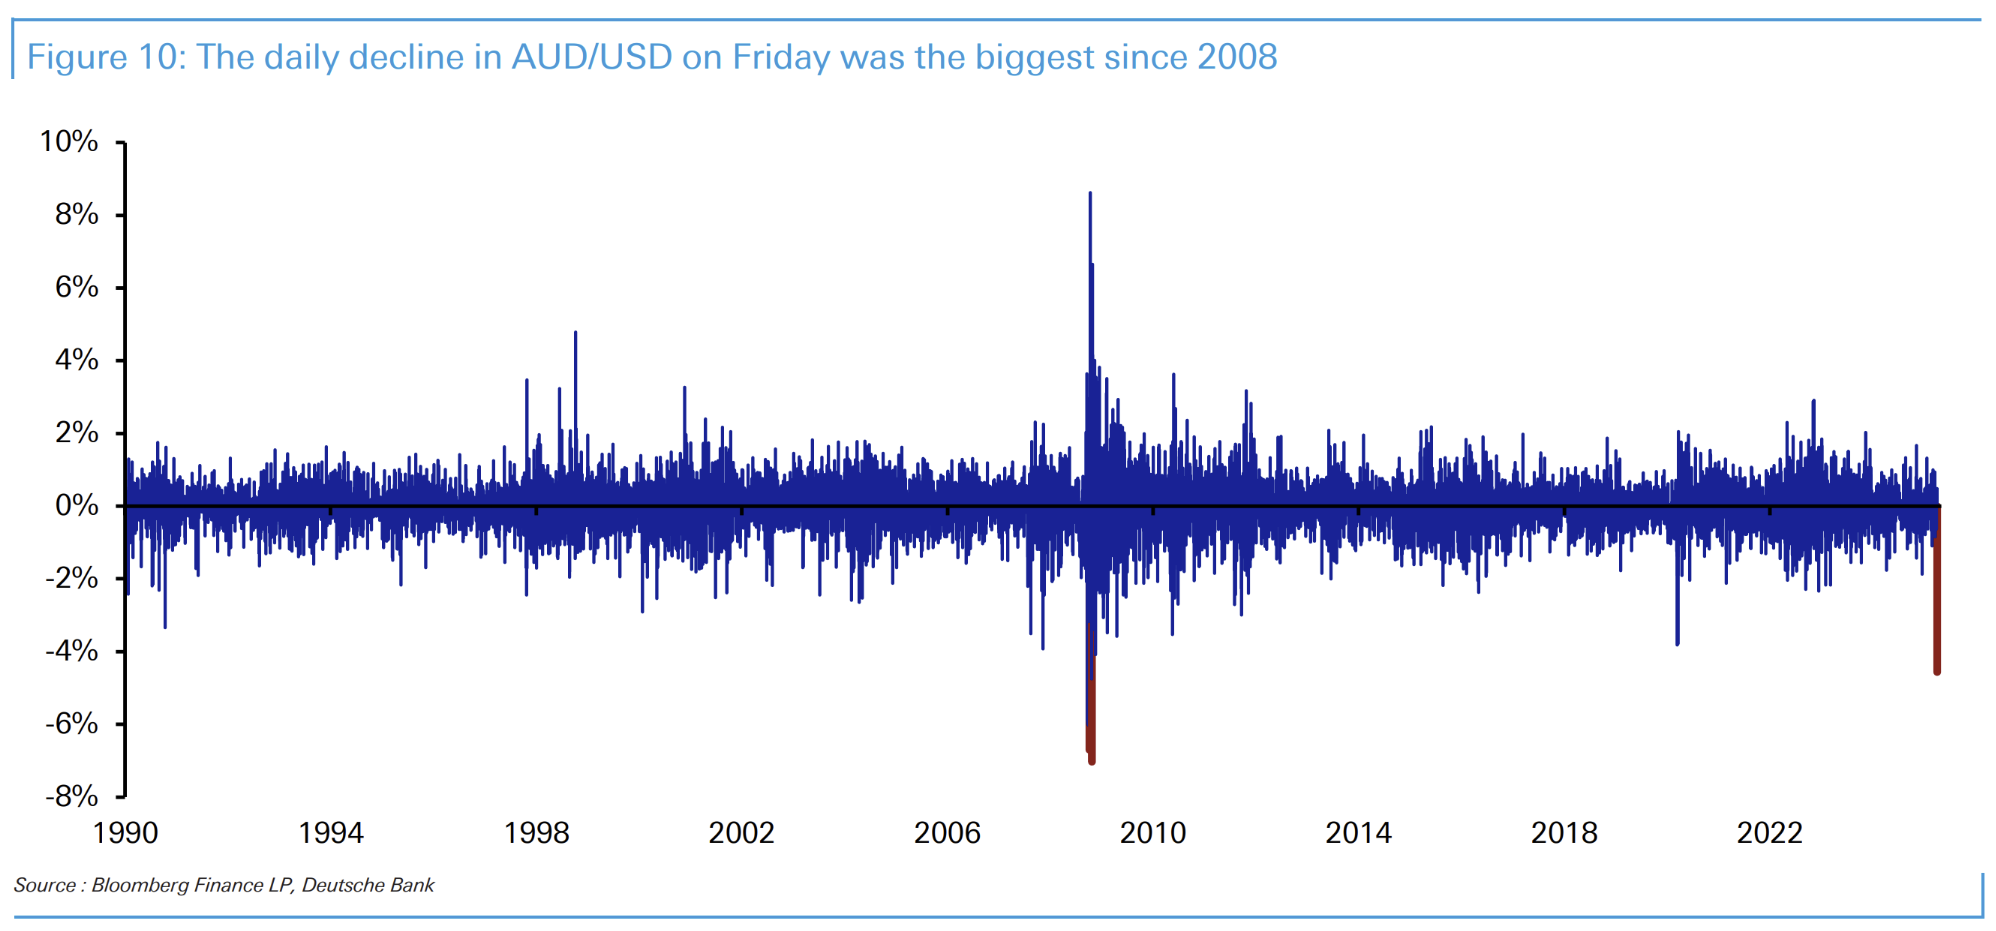
…and the Australian Dollar.
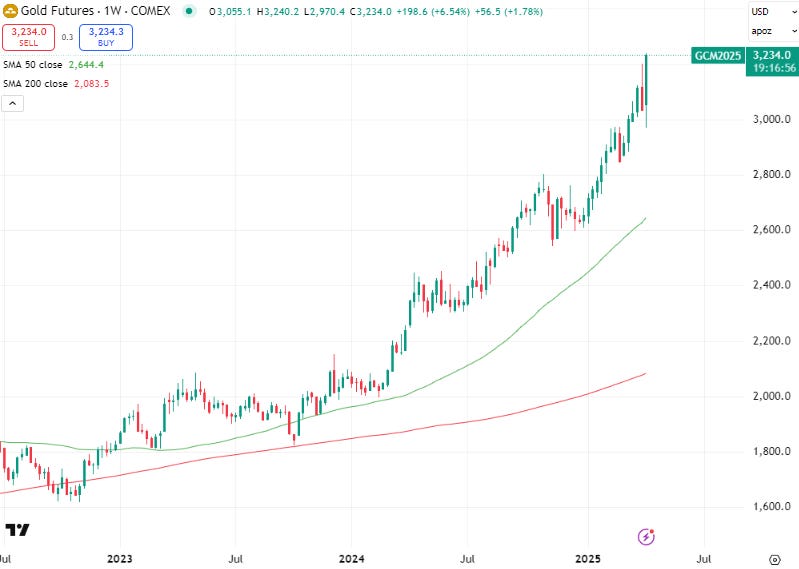
The rally in gold has been relentless, and is the only asset class with consistent performance despite being horribly overbought on every technical indicator.
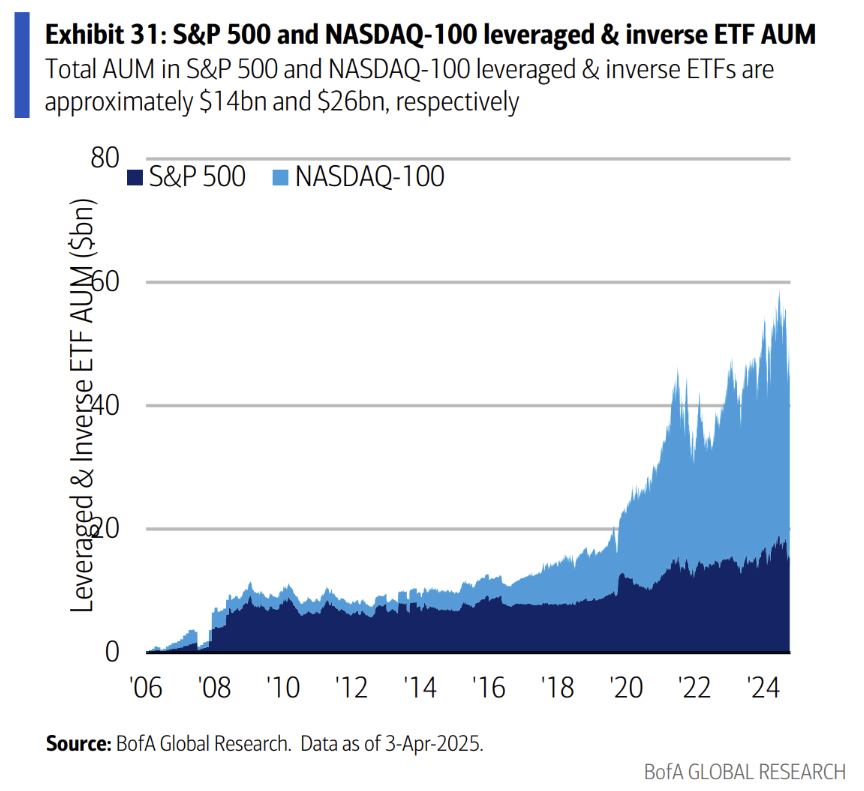
A “feature” of the face-ripping rally on the 9th was the insane buying by levered ETFs at close. The growth in this product type is shown above, at nearly 3 times the size of during the pandemic.
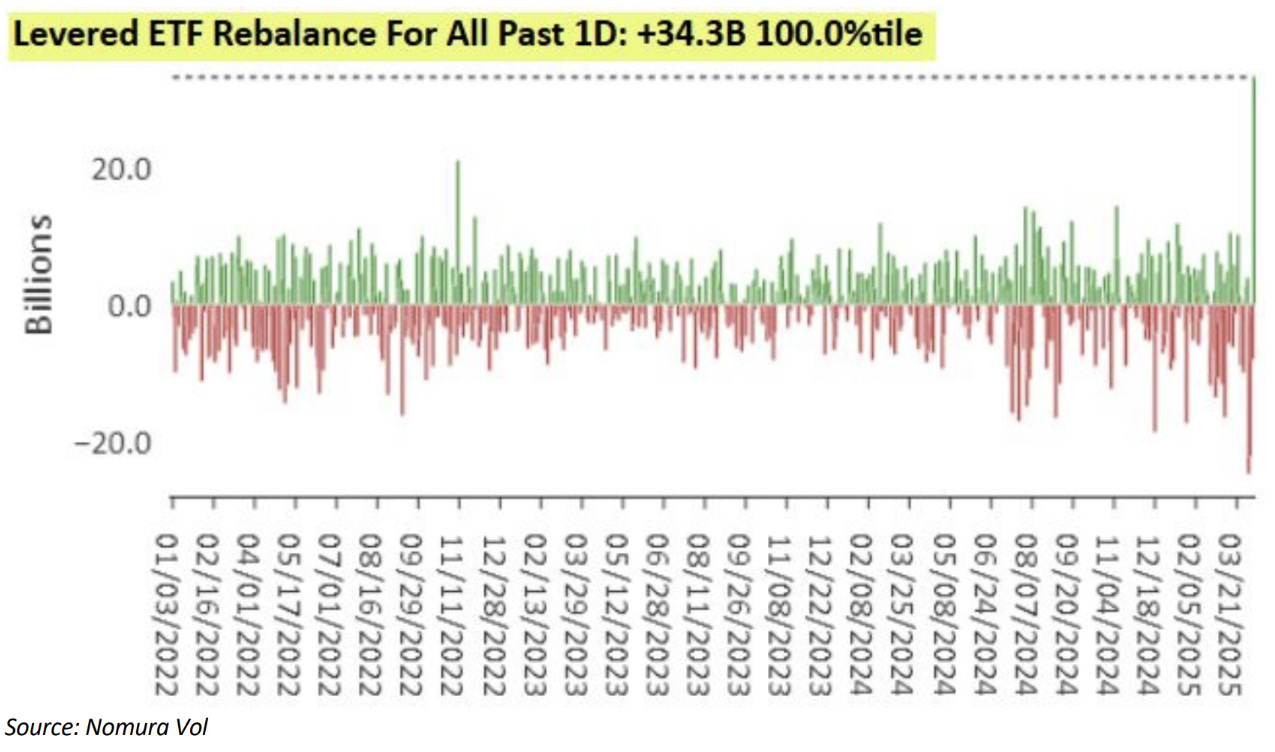
The rebalance requirement on the 9th was immense. Selling at such lows and then buying back at highs must introduce horrible drag, in a similar way to how trend followers are being hurt right now.
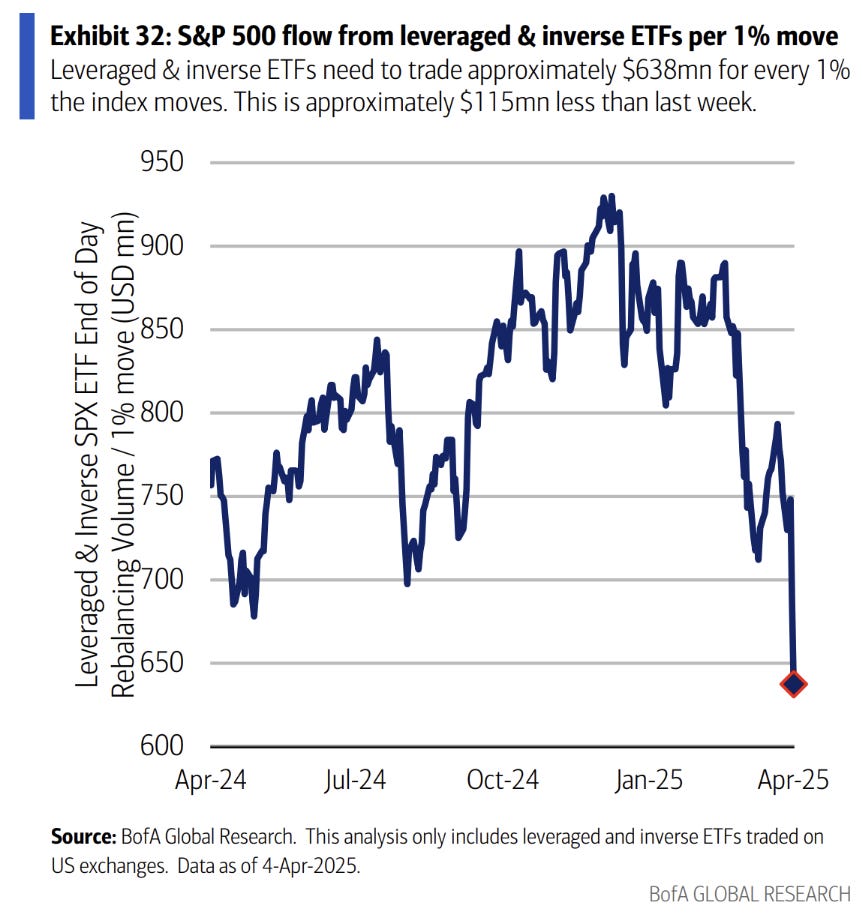
The chart above shows how rebalance requirements have fallen as money leaves these funds, but a $650m per 1% move it is still massive.
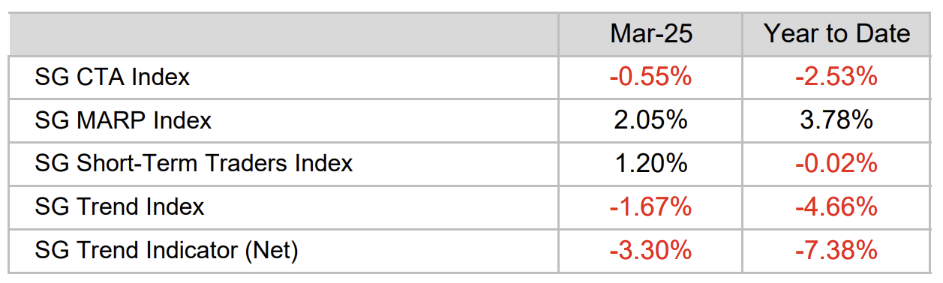
Now, the trend followers. Things have not been going well.
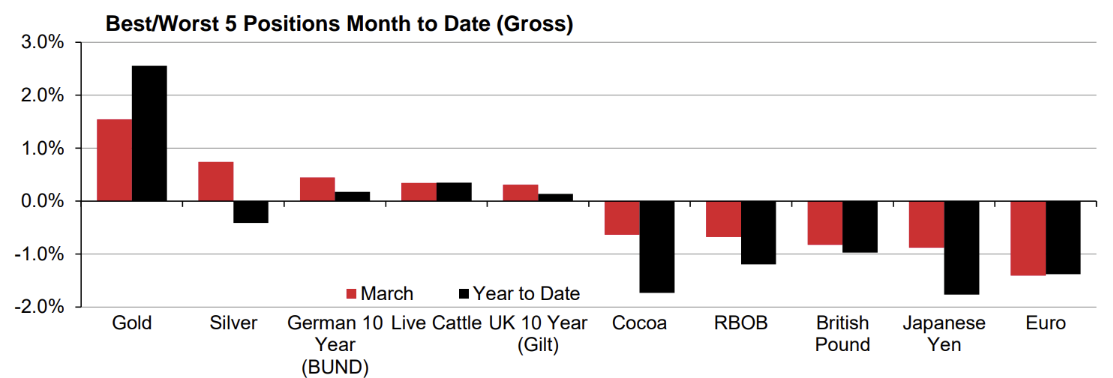
Gold has been the only consistently trending asset in their universe. Everything else has cost a fortune.
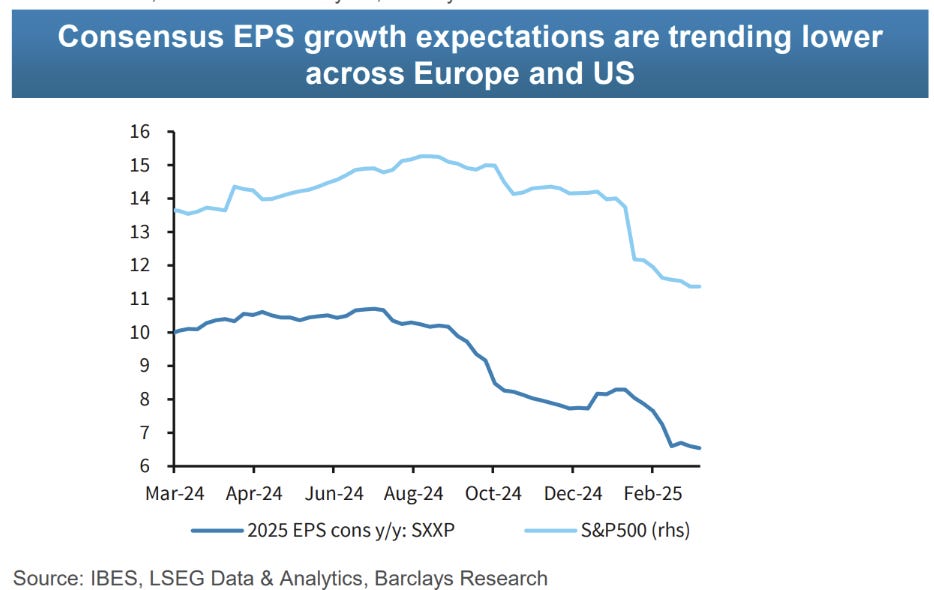
To the extent valuations matter right now, this is what’s happening.
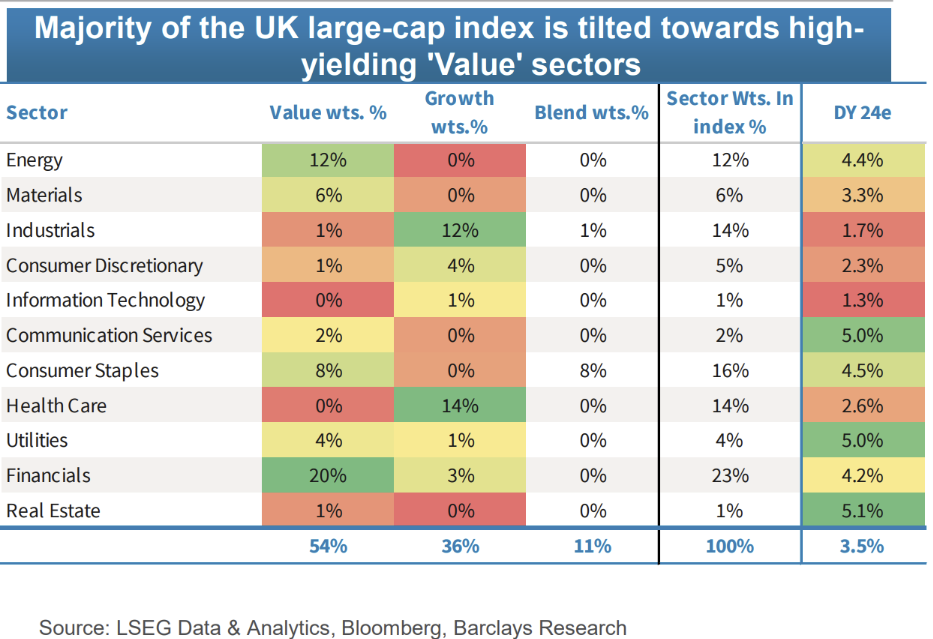
Found this interesting about the FTSE. Very value orientated and defensive index.
Is China winning?
China is the private credit of global economies. Control over the markets and debt and therefore where everything is valued. There is no possible bond market rout to derail their fight in the short-term.
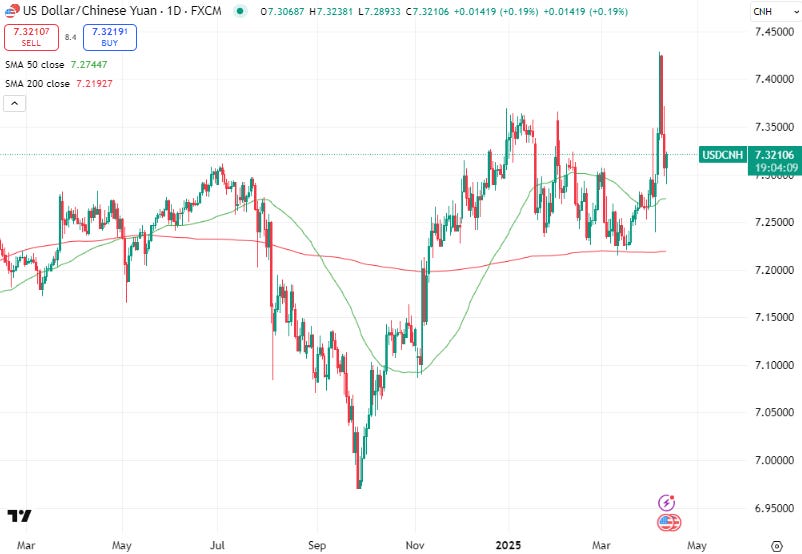
USDCNH spiked initially but has subsided as the focus moved squarely on the US as the current loser in this war.
USDCNH will act like a risk proxy for China, testing the top of the (upwardly moving) band when the focus turns to China’s response.
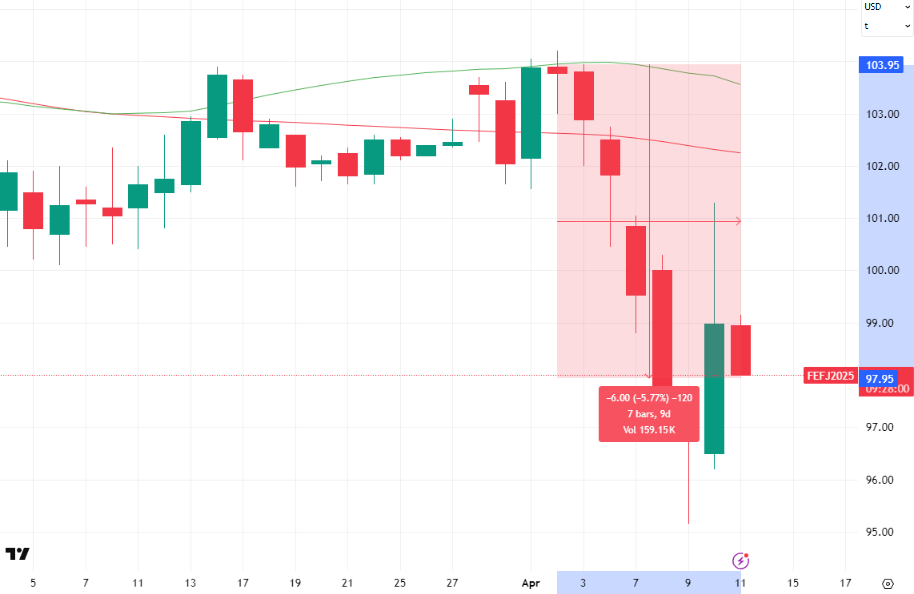
Some other markets it has less control over are commodities.
Iron ore has bounced from the lows to be down 5.8% from April 2. It got as bad as 8.6% down.
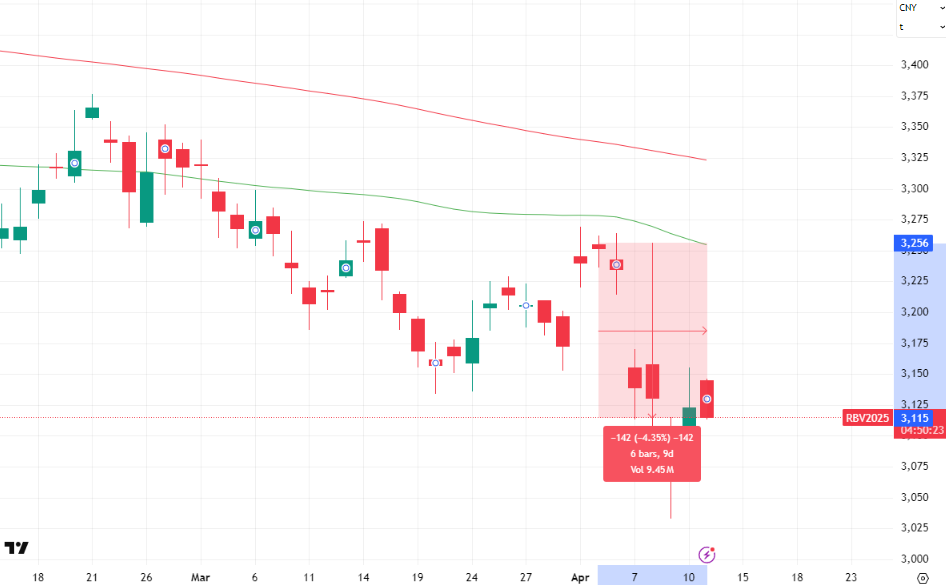
Steel rebar is down 4.3% down. Like I’ve always said, watch steel to know when China is in real crisis.
Steel will tell you when to care about China

The decline in the “engine” of the Chinese economy – property – has been precipitous.
The rout in US bond markets may have shifted the focus back to the US, as well as the capitulation on global punitive tariffs.
The other factor here is that China has announced further intention to ease fiscal policy. GS outlines their expectations in the very first image of this document, which was my first guess as well.
Lifting the broad fiscal deficit from 10% to 15% would be necessary to offset the hit to growth of tariffs. Like the tariffs themselves, these numbers are ridiculous to the point of being meaningless.
I have no doubt they’ll do it to continue the fight.
Inflation surprise
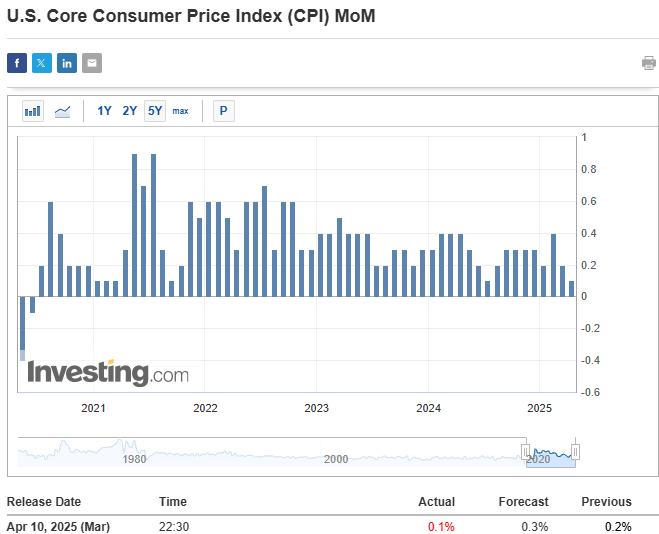
Economic data matters little, but I found the inflation print (yes, they still did that this week) to be surprisingly weak.

The “supercore” basket showed deflation, if that basket is something you value. Bonds still sold off on the release though, lol.
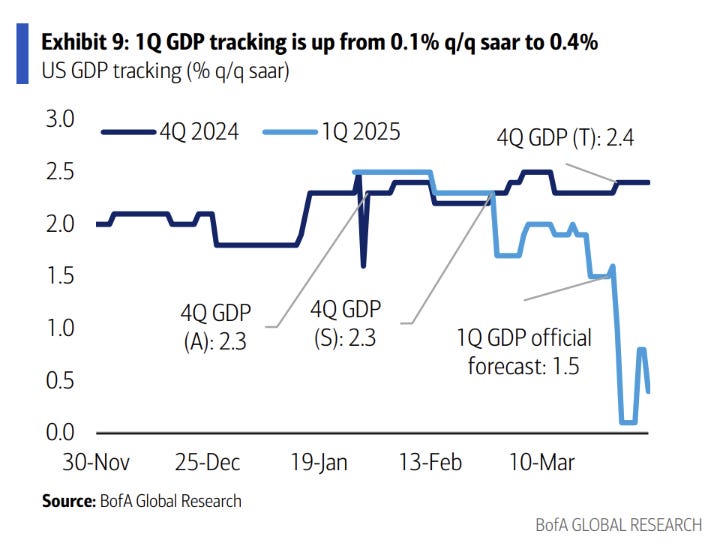
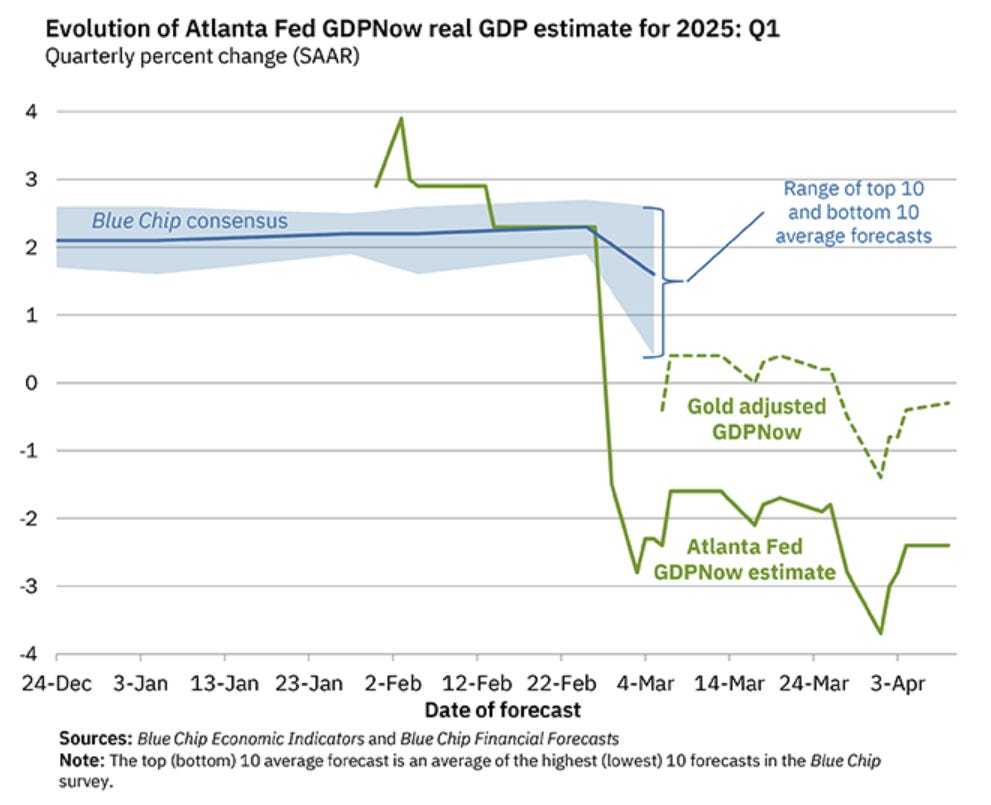
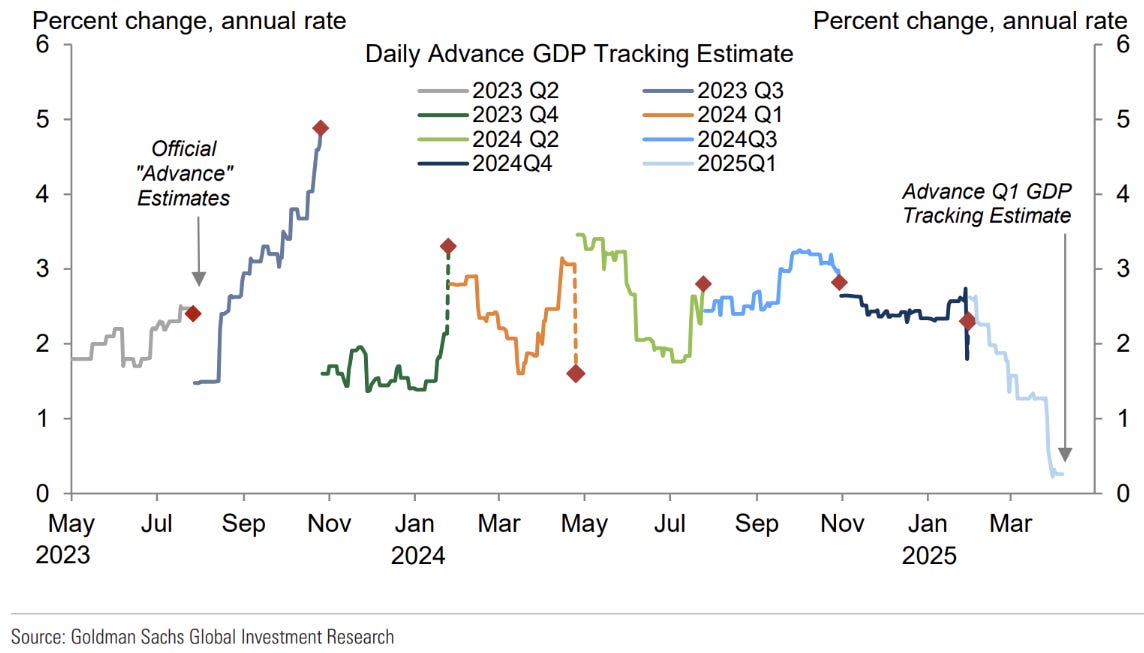
The set of GDP forecasts above seem to agree that GDP growth will be just above 0 for the quarter. Pull-forward import demand will be large…
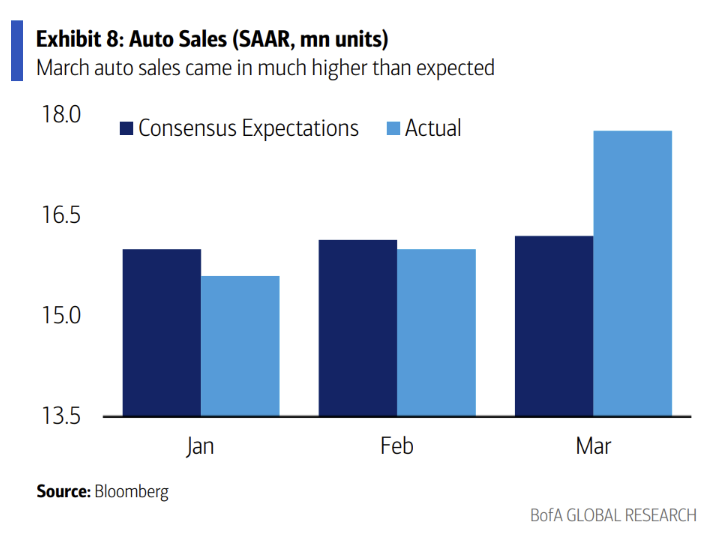
…reflected in part by the huge demand for autos versus expectations this month.
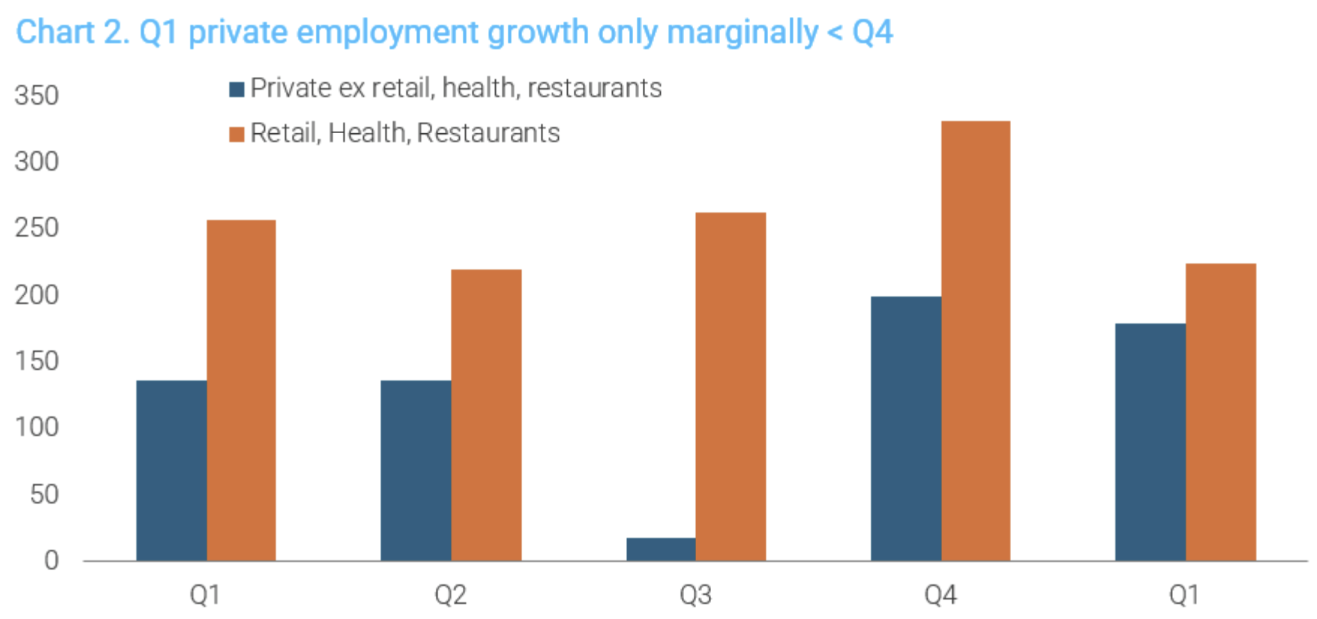
Employment last week was also really good, nearly doubling expectations.
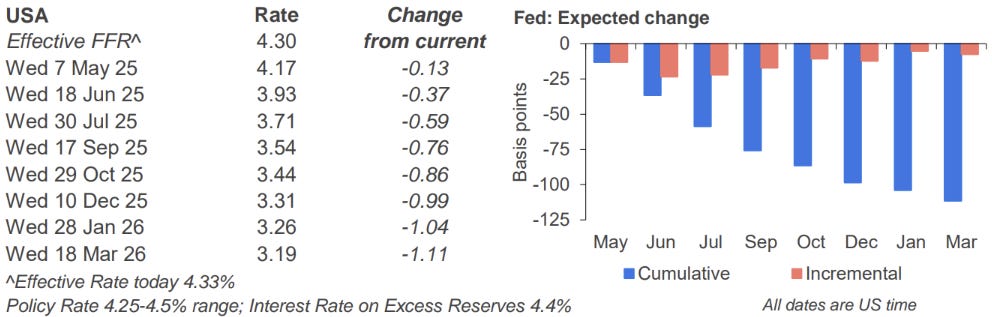
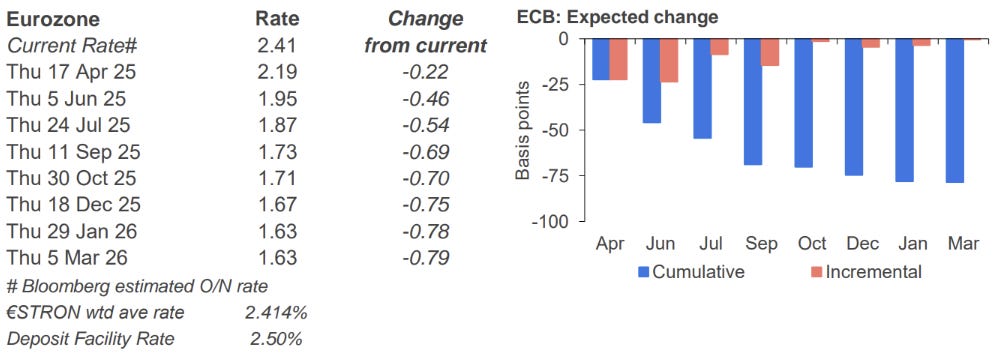
Finally, rate cut expectations for the Fed and the ECB. The Fed is in a tight position given tariff effects on inflation will happen this month. They (along with the ECB) also have good employment growth at last read.
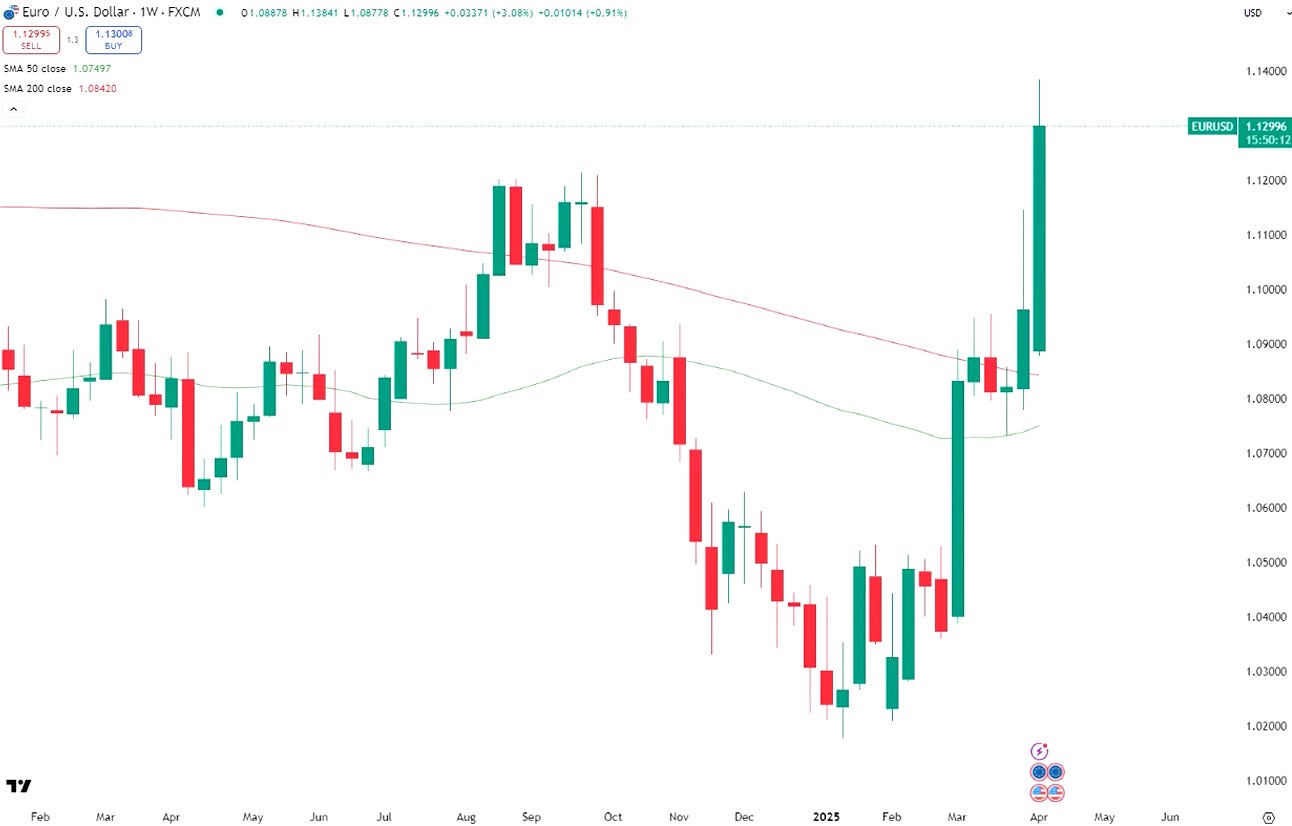
The ECB is underpriced here as disinflation has taken more of a hold and the spiking EUR would be very unwelcome. The tug-of-war continues.
Initial reaction was because of Chinese links of commodities.
Thank you, great note!
What is it about the AUD? Is it the commodity export world economy currency, or its link to Chinas economy?