

Japan’s new PM Takeichi managed to win the lower house election with an aboslute majority, putting all of her campaign promises and more within reach. Will Abenomincs 2.0 become a reality?
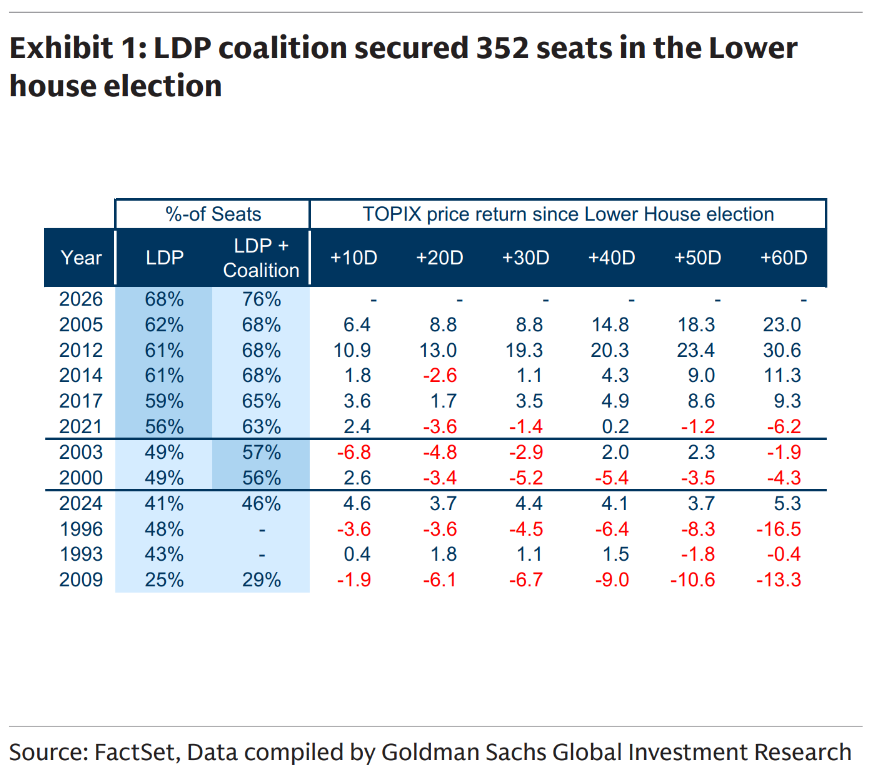
The margin of her win gave the market all it needed to bid equities to the moon as this genuinely is a historical turning point for Japanese fiscal, economic, monetary and foreign policy.
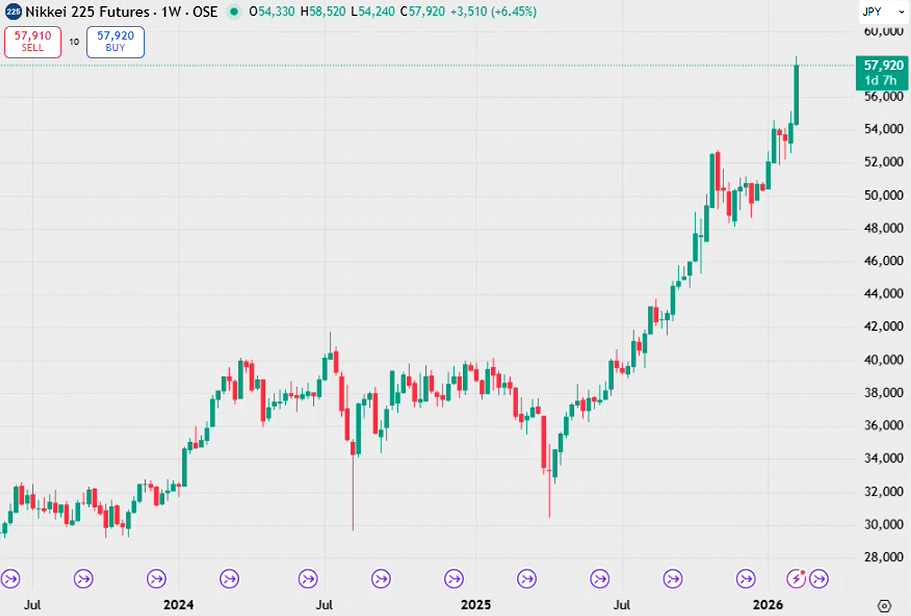
This turning point is captured primarily by the performance of the Nikkei. The index is up 50% from the end of 2024 and has doubled from the April 2025 lows. The move has been so vicious that trading in OSE options on the Nikkei has been almost impossible in any decent size recently.
Most people don’t think of the Nikkei as a great asset over the longer term. The fact is that the price return of the Nikkei 225 from the depths of the GFC equate to 29% per annum, something that has only accelerated since the Bank of Japan decided to step away from the ZLB (zero lower bound) for interest rates.
Frankly, it’s about time. I consider ZIRP and all related policies as deeply damaging to activity as it embeds deflation rather than defeating it. It’s not a coincidence that equities have accelerated since the 2-year JGB has ripped away from zero.
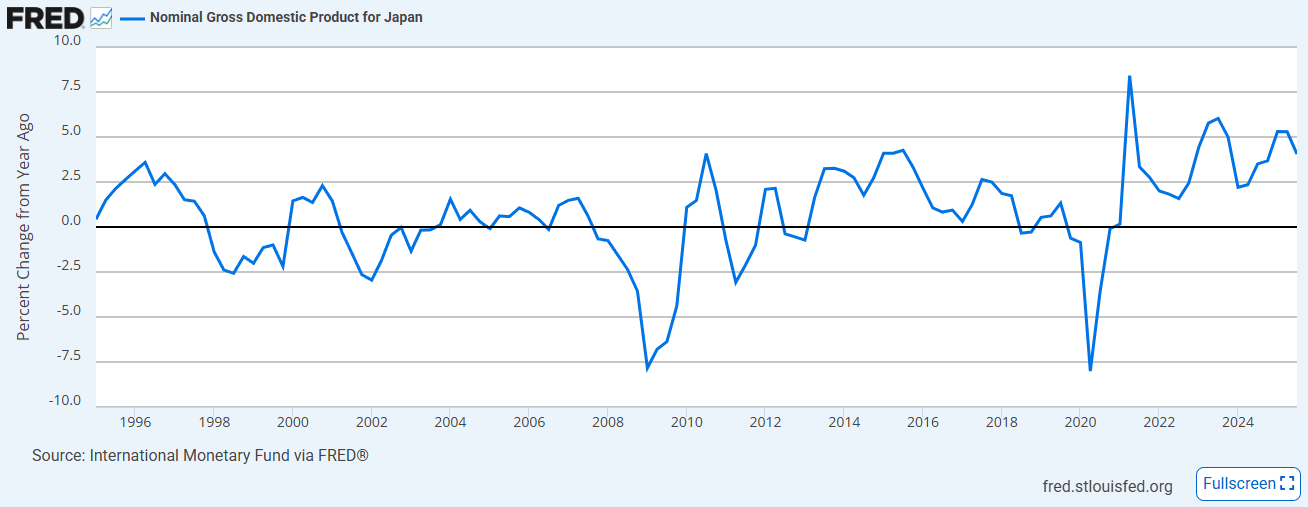
Nominal GDP has consistently printed at levels not seen since the boom days of the 80s/90s.
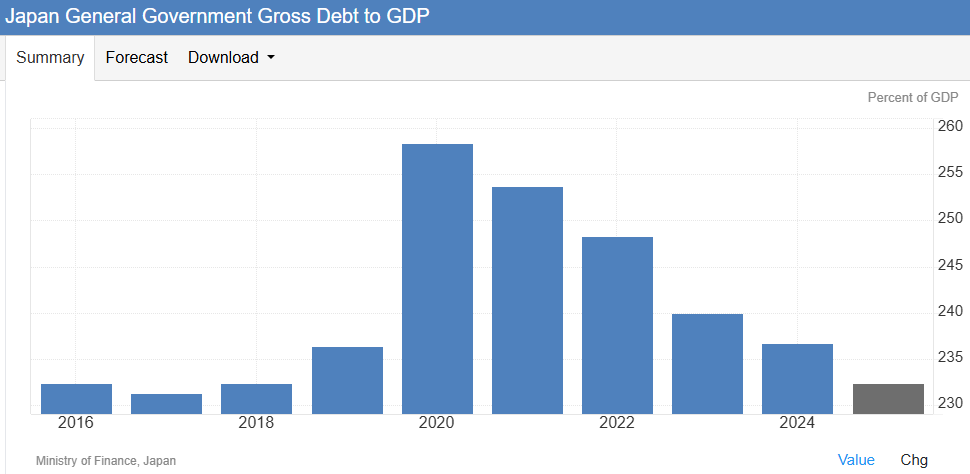
This has enabled Japan to “repay” (in GDP ratio terms) the debt assumed during the pandemic. This is unique for the developed world where not only has debt/GDP increased, but the accumulation of debt has only accelerated. Ther ecan be cases where nominal GDP growth is “bought” via debt, but this doesn’t seem to be the case in Japan.
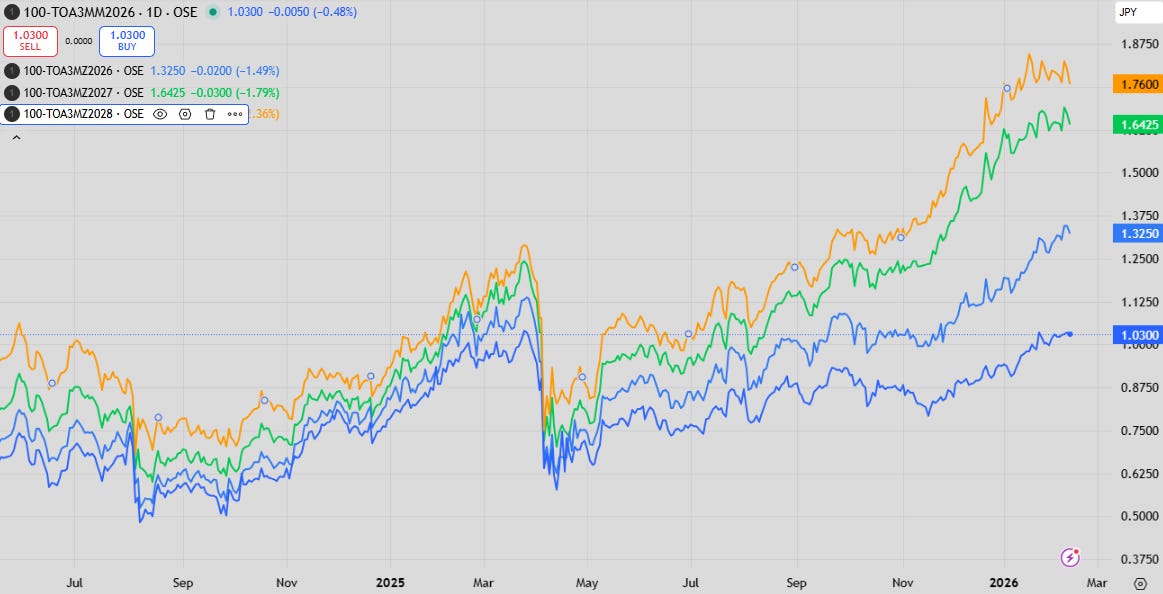
We can see how the forward curve has evolved as equities have rallied in the chart above.
The forward curve has steepened. The current BoJ rate is at 0.75%, while the June 2026 3-month rate is at about 1%, implying 1 hike over the next 6 months. At 1.32%, there is 1 and a bit hikes priced in for the next 6 months, with just less than another 3 over 2027.
The “terminal rate” displayed above (Dec-2028) has topped out at 1.76% and hasn’t moved higher on the election results. This, of course, is more to do with the BoJ signalling that underlying inflation has improved towards target. I still find it unlikely that the BoJ will hike to this level, and either way the progression to that level will be very slow.
Still, sufficiently large fiscal expansion and a weaker Yen could change the outlook here, although that even seems to be mean-reverting within its decently large 10% wide range.
Either way everything remains remarkably in control. This has been a hallmark of Japanese policy which stood out during the pandemic, and has been handled well ever since.
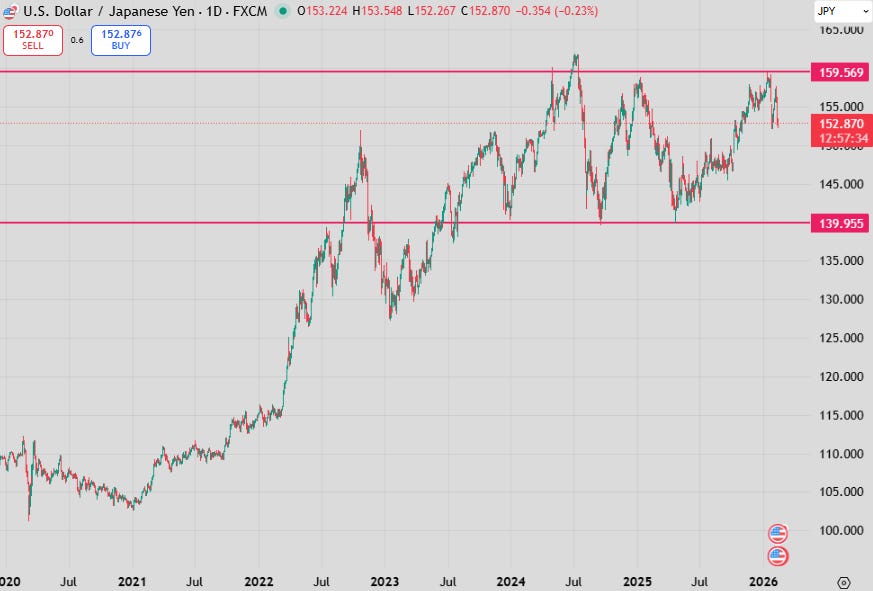
This doesn’t fully explain the level of USD/JPY though. When considering rates differentials a serious break occurred at the Liberation day turning point. This is due to 2 factors:
Real effective rate are still negative in Japan. This classes the Yen still as a funding currency, and the strong risk-on environment since last April indirectly causes a weaker Yen.
Capital outflows are still large because hedging costs have been high. This is now changing and JGBs are looking more attractive on a hedged basis.
As I’ve covered before…

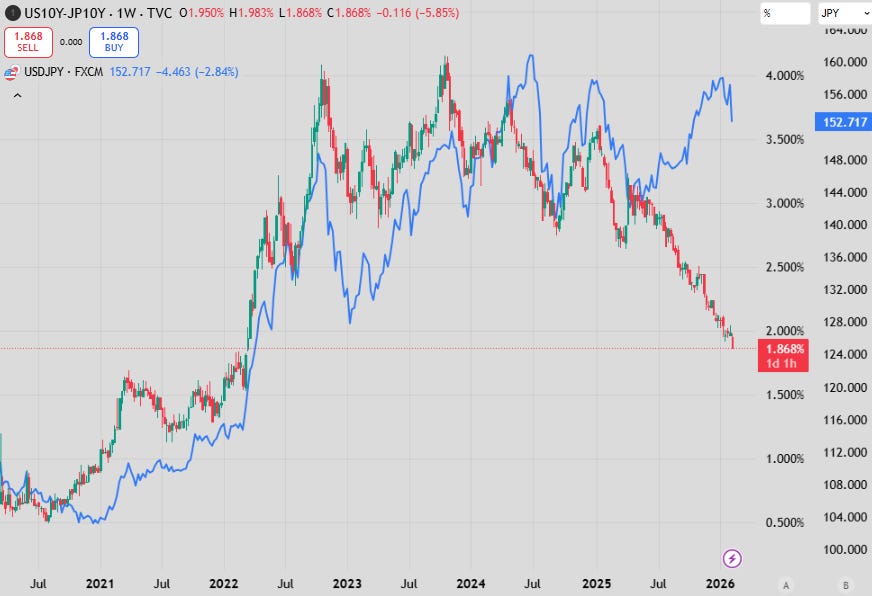
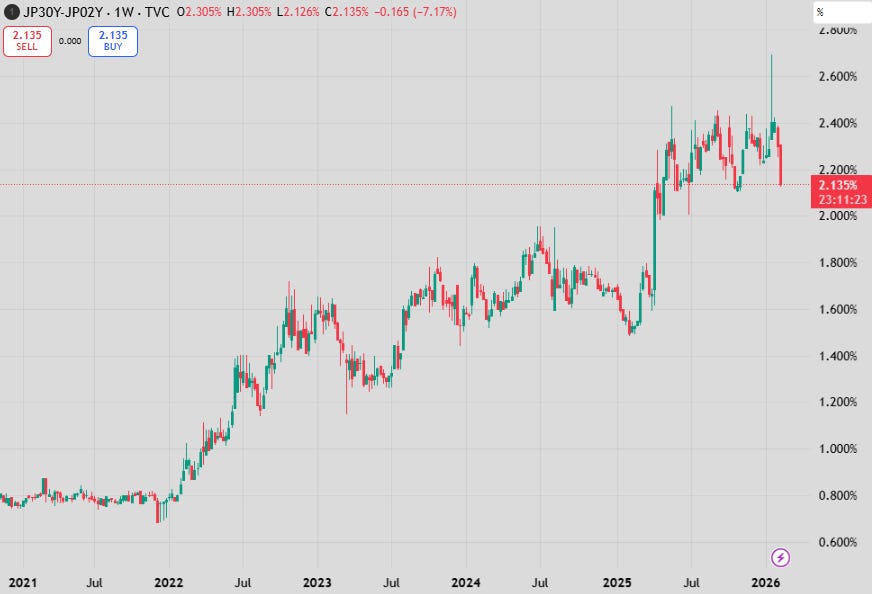
…BoJ selling and a lack of domestic interest for JGBs. The 2-year/30-year JGB curve hasn’t moved since the large steepening that occurred in April last year.
We are very much in uncharted territory on a lot of measures, or at least uncharted since about 1992.
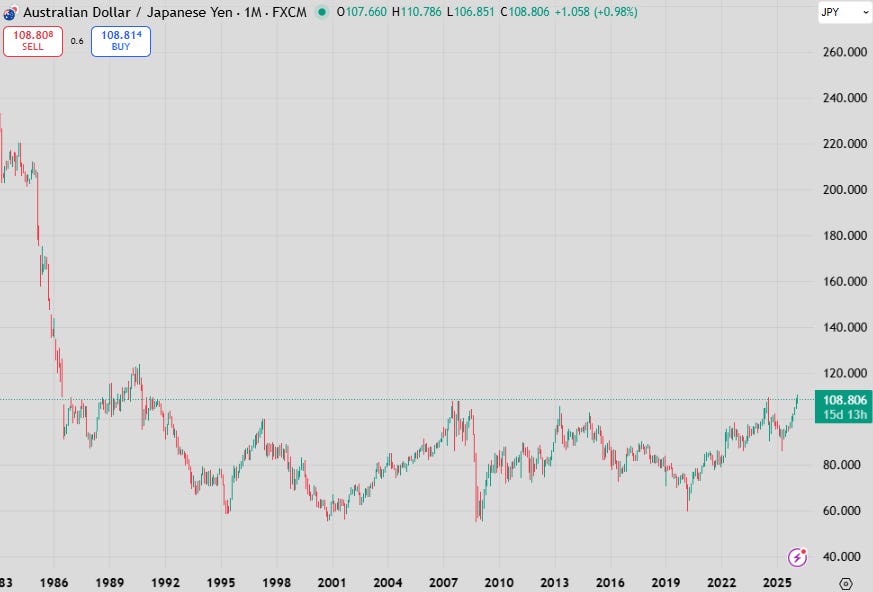
AUD/JPY is one of the classic Yen crosses that was known for its correlation to RoRo (risk-on, risk-off) and was very volatile itself being the opposing sides of the funding currency equation as their interest rate levels were so disparate.
This pair has now broken a near 40-year top. While we are unlikely going back to the position on the Yen in the pre-Plaza Accord days, the current level could be ushering in a new regime, or alternatively the harbinger of a huge drawdown in equity markets!
The story here in general is good, and Japan will offer a good diversifier to other developed markets both in rates and equities. The economics here is so much different to other current account surplus countries. It isn’t experiencing the same issues as Europe…
…and Japan seems to be successfully competiting on her terms against its neighbour, China.
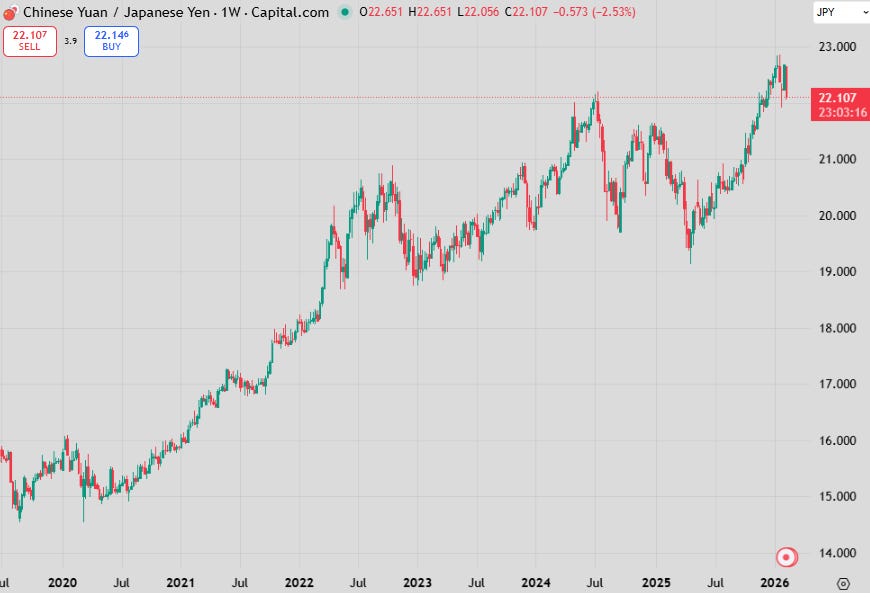
The battle between the Yen and the Yuan

The moves in the Japanese Yen over the last few weeks are, on their own, pretty spectacular. A large amount of the move can be described by just pointing to interest rate differentials - which is to be expected with such divergent monetary policy.
It isn’t a secret that China is a driver of a planned re-writing of the Japanese constitution to enable a military expansion either.
The first week of Feb was really that bad
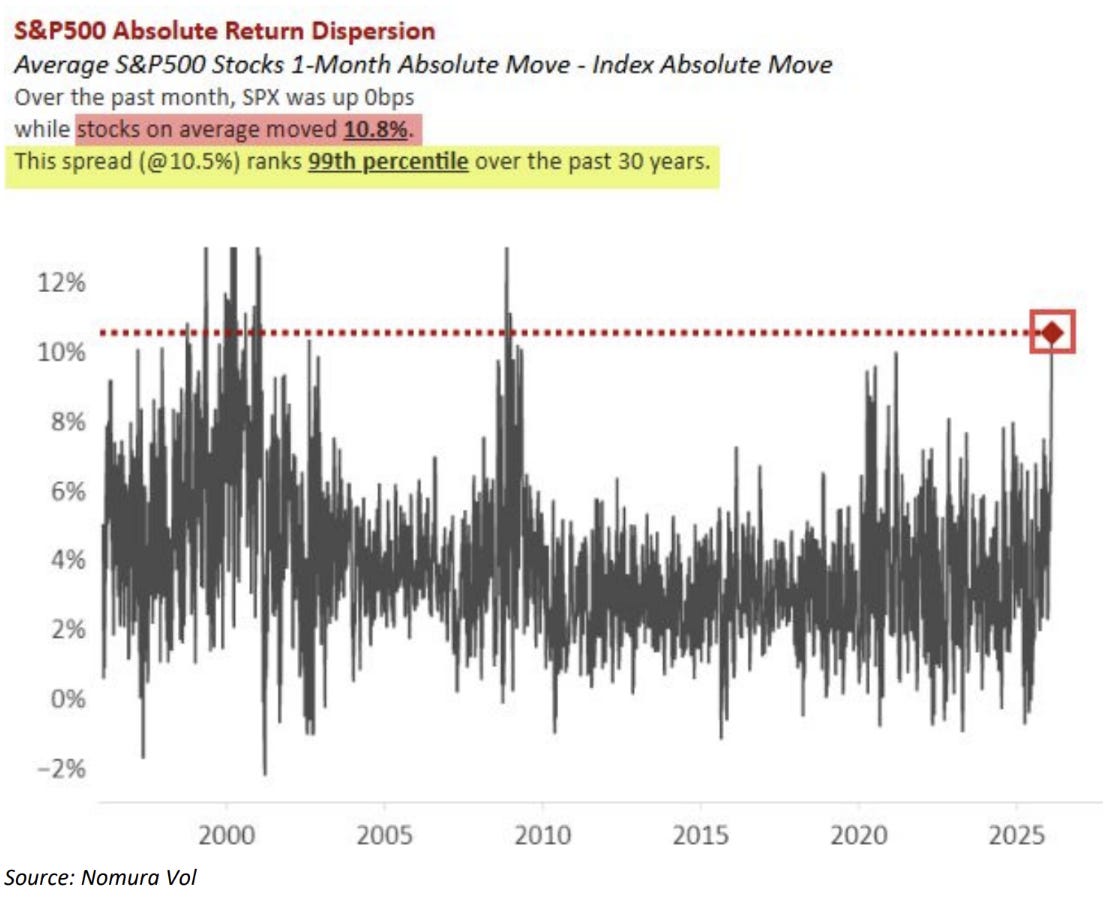
Nomura reports that while the headline index was unchanged, the average S&P500 stock had an average absolute move of 10.8%!
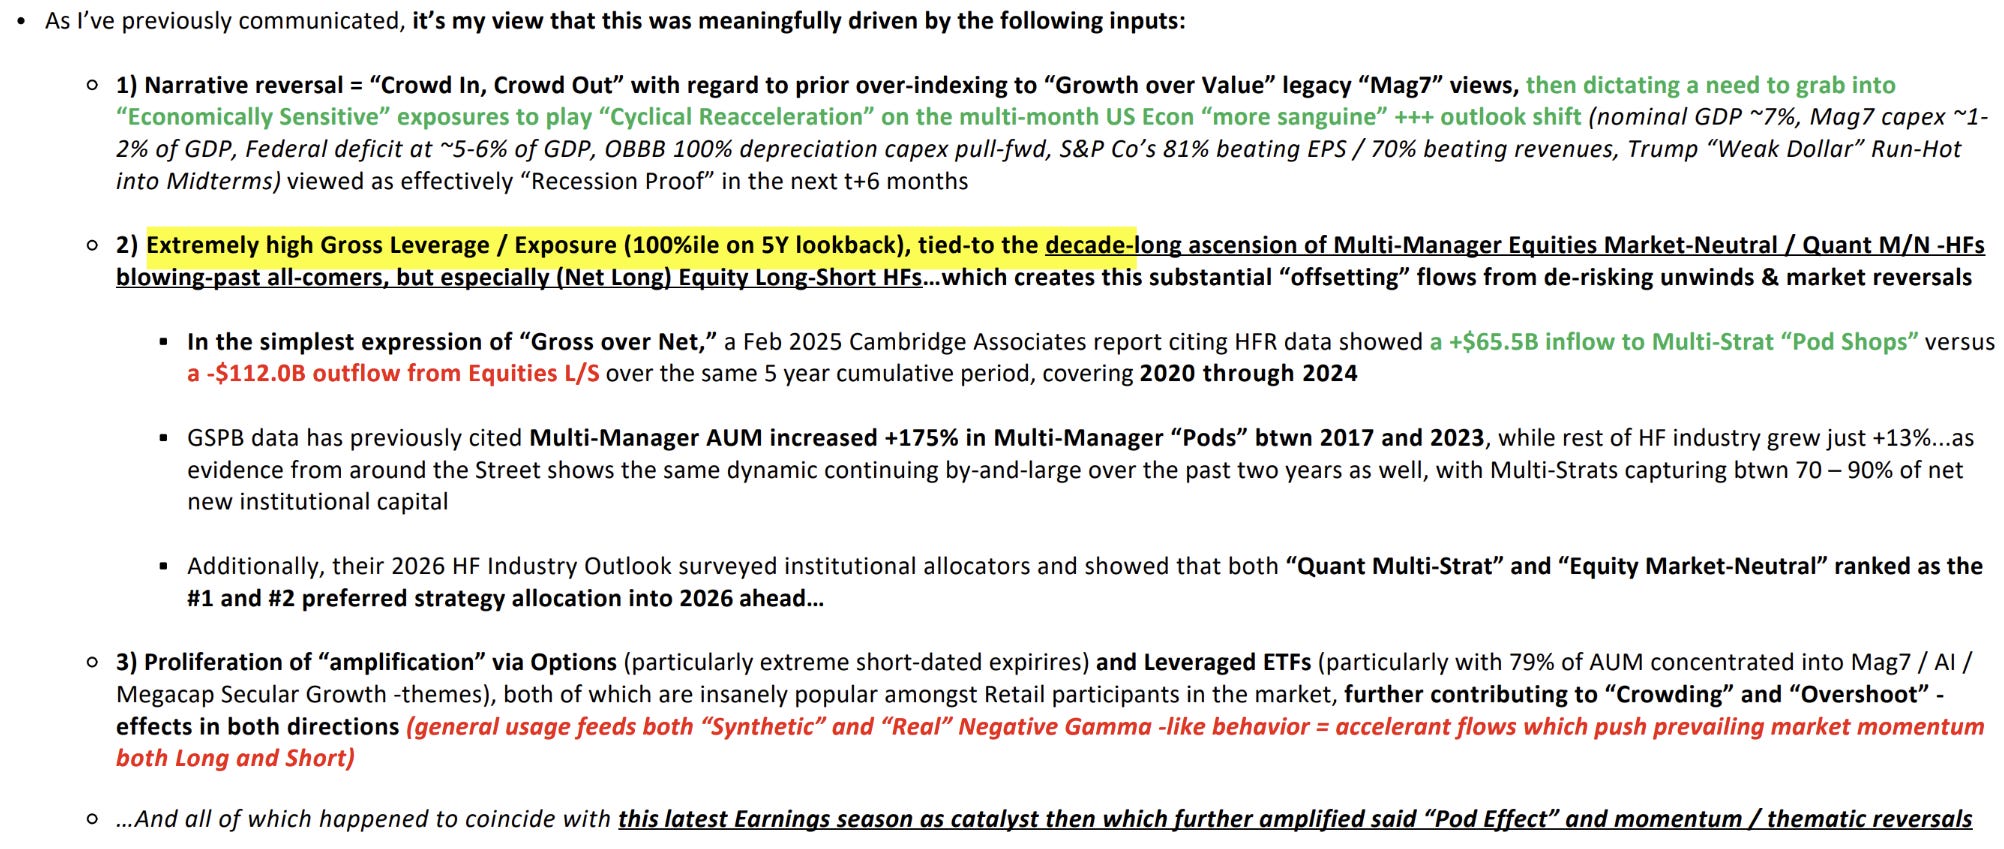
Nomura also agree with the reasoning I’ve put forward in Charts & Notes on a number of occasions - vol of this form is due to crowding both at the strategy level and at the position level.
The market has a thirst for vol and goes where it can find it. Trends in funds management are driven by narratives and past performance. To generate outsized performance, you need to be in a market that’s moving. This could be from just strong upward momentum (this has driven inflows to tech, gold, crypto over the last few years), or via strong dispersion within or between markets which then offer opportunities to deliver significant alpha or correlation benefits.
These conditions need to be present to drive fund-raising, which is generally cyclical.
Cycles of fund-raising end when too much capital finds its way into a sector and either cause too much vol, or outright losses. Nomura alludes to this in the paragraph above, with not only total funds under management increasing, but the gross notional exposure of individual managers has also increased!
When too much capital finds itself into the sector we start to see what happened at the start of this month occur much more often. At the moment we see a “de-grossing” event like this about once a year, but if the usual stocks and factors bounce over the next few weeks then we should start expecting it more often.
A “de-grossing” event is the market telling managers that it can’t support the current amount of capital crowding into the same positions and strategies, similar to how credit markets will see default events after large capital inflows or as leverage increases in volatility products.
What is the logic behind your assumption that ZIRP helped deflation? Just from a signalling point of view, or in rediretcting funding from savers to creditors?