
Charts & Notes: Tariffs, or an aging cycle?
Employment & inflation weakening with pre-tariff trend

US inflation and employment data over the last week gave us an important look into how tariffs are directly and indirectly affecting my call for strong nominal GDP growth through ‘25 and continued strong equity markets and a steepening yield curve.
The summary is that tariffs (and tariffs induced volatility) are barely affecting the data at all. The almost imperceptible slowing in labour markets and trend in disinflation is intact from the period before large-scale tariffs were a reality.
US CPI
US CPI for May came out at 2.35% YoY, 9bp below consensus. Core was the highlight here being especially weak, at 0.13% for the month, vs consensus at 0.28%.

This annualizes at a rate of core inflation at 0.13% is 1.56%. This is obviously well below a level the Fed would be comfortable with on an ongoing basis. What is going on? Aren’t tariff effects obvious yet?

Zooming out, disinflation is clearly still the dominant trend, especially in shelter. So why did this inflation release surprise the market so much?


Forecasts above were well ahead of actual, for nearly all forecasters. Both goods and services were overestimated.
The services basket of CPI was weak overall (OER, rent, car maintenance), beyond the usual volatility in hotels and airfares against the expectation of most.

Inflation charts sourced to @Econ_Parker are from this excellent thread.
Monthly growth in OER took a shift lower to the pre-COVID average…

…where rents shifted well below the pre-COVID average, surprising nearly all economists.

Interestingly shelter inflation differs substantially across regions.
OER and rents alone probably accounted for 0.05% of the undershoot versus consensus. There might be some seasonal adjustment effects going on here, but more on that later.
Now, onto core goods, which was also weak. Credit Agricole has a good rundown on misses versus their forecast below.

Core goods came out as deflationary in a month where most expected to see some tariff related effects.

It wouldn’t be accurate to say there weren’t any tariff related effects, however. Baskets of goods most likely to be affected did show greater inflation than goods as a whole (noted in the chart above).
Estimates are for another 0.03% to 0.05% tariff effect this month. Within the greater disinflation of other components of core CPI, it isn’t really obvious.

Within their May CPI report Credit Agricole also reiterated their view on aggregate effects of tariffs on CPI and I find their assumptions reasonable.
They estimate around 10% tariffs added in 2025 (with China settling at 30%), so around USD330bn. They believe that half of this would feed into CPI within a year, with an 80bp impact to CPI in year one.

Tying into this is the evidence of rerouting of Chinese exports to the US through their Asian neighbours. This will have an effect on tariff takes and thus inflation. Take charts of reduced bilateral trade between the US and China with a grain of salt.
Robin also highlighted flawed seasonality calculations now working in reverse to produce inflation outcomes that are below the “true” figure. Previously strong beginning of year inflation prints were affected by these abnormalities.
It’s this sort of thing that makes the whole idea of trading monthly CPI prints absurd, but if the Fed considers them important then I guess everyone does.
Employment
Last Friday’s non-farm payrolls elicited a decent reaction from markets as everyone was expecting an erroneous print from a very volatile April (myself included). Instead, the headline figure printed a +139k, above consensus (despite some prior month revisions).

Private payrolls have been running at this level for quite a while now.
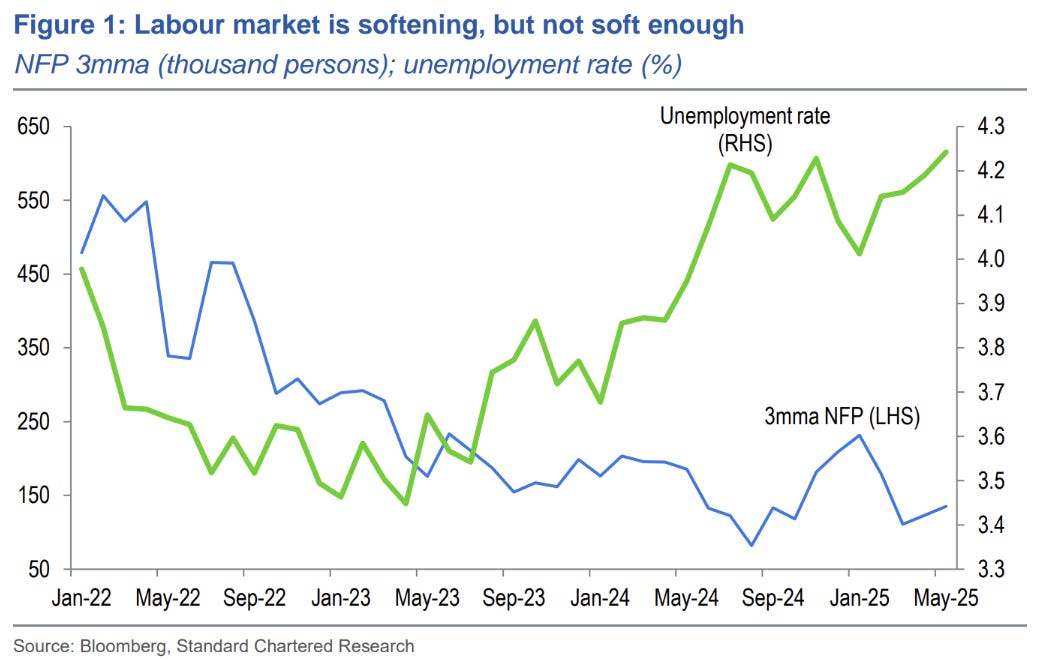
The official unemployment rate is hovering at the top end of the range…

…however, the drop in the participation rate, along with a sharp fall in immigration, has stopped the unemployment rate printing a lot higher.
The spider diagram above shows a labour market that is ever so slowly deteriorating over the last year.

Other indicators are showing stress as well, most notably the chart on the left above where unemployment benefits are being exhausted and people are remaining unemployed.

A very low layoff rate is also hiding a smaller hiring rate. On the surface, this is less healthy.

Gains have also been limited to certain sectors…


…with health care and social assistance well above average.
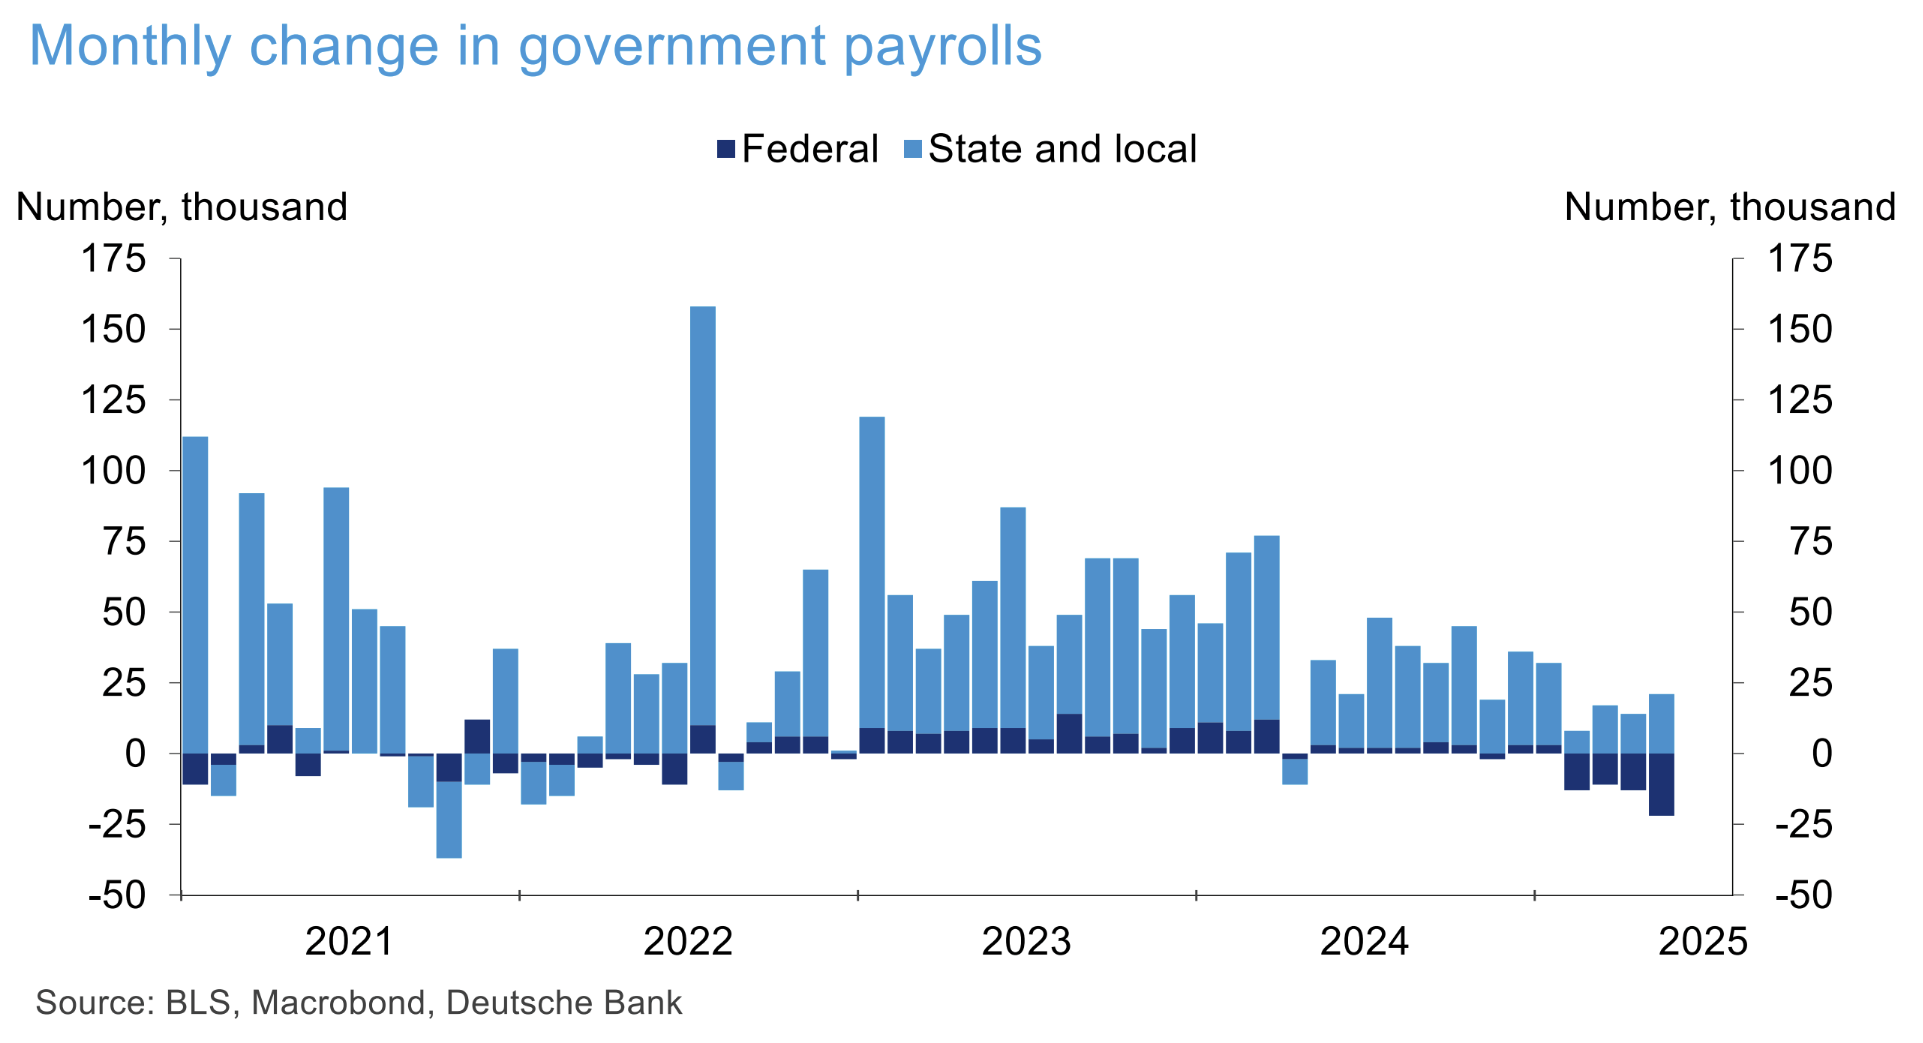
Federal government layoffs have been replaced with state government hiring.
All-in-all employment is only marginally weaker at the top line than it has been, you really have to look closely to find it.

Is it the result of an aging cycle driven by increased government spending? It sure does look like that. Transfer payments have been driving income growth (above), and growth in employment leans towards those sectors that are likely supported by revenue from the government.
Whether you deem this to be “good” or “bad” isn’t really the point. The fact remains that it will keep the wheels spinning, promoting decent GDP growth.
The softness in inflation is more complex. We have to take the numbers for what they are for now, but I’m not convinced we are closer to 2% than 3% for core inflation yet. the numbers suggest I might be wrong on this, and this does have implications for my nominal GDP call of 5-7%.

That is unless real GDP does the heavy lifting, and the Atlanta Fed GDPNow so far this quarter seems to suggest it will (if we pretend effects related to the give back in import growth aren’t now working in the other direction!).
Ultimately a business cycle driven by fiscal deficits won’t look pretty. It will seem lethargic and will eventually suffer from poor productivity growth as Europe, Australia and Canada have found out.
Low unemployment is a European mirage

Mario Draghi’s report on European competitiveness won’t contain anything of substance for those who are students of the European economy. It could have been written 10 years ago, with the only meaningful changes being the lamenting over Europe’s lack of leadership in 3D printing rather than AI, like the report suggests.
What it does do is keep GDP growth humming along and people employed who put money into markets. It’s just that nobody talks about the debt that grows to enable it all.
Thank you, Mr. Farac, for a great article once again.
The work behind this is really appreciated.
I also got the chance to listen to you in the Prometheus podcast, and learning more about your framework was extremely interesting.
Thank you for sharing your knowledge.
Best,
Valentino