
Charts & Notes: QT, we hardly knew thee
New tariffs, France and Powell while credit risks and funding issues make headlines

Last Friday’s equity and crypto crash has been all but forgotten as I write this, but the move was significant, and quite rare.
While the trigger may have been a resumption of the tit-for-tat on US and China tariff and export controls, the move (especially in the last 15 minutes of trading) was a reflection of a feedback loop back from crypto.

While I don’t trade crypto and am unlikely to ever do so, I found the above helpful to understand what happened. It’s quite technical, but in the end, it seems to be a combination of two main factors:
A vulnerable collateral valuation methodology used by Binance which…
…triggered in-built liquidation rules in decentralised crypto systems exacerbated by…
…too much leverage.
The tariff trigger was just big enough to light the fuse which saw many altcoins down more than 70%.
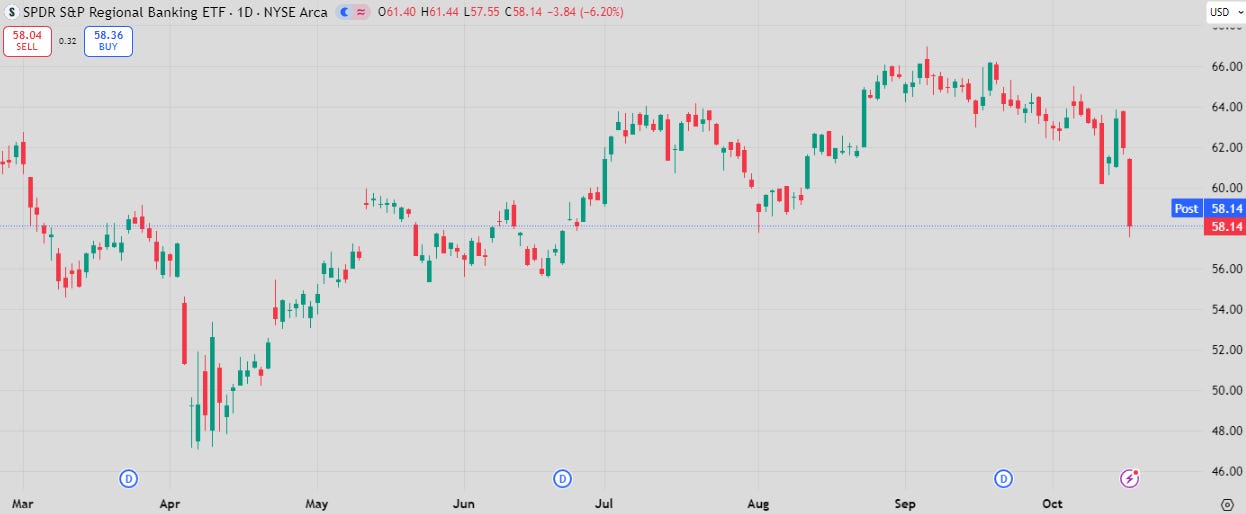
Auto and general private credit worries are picking up. Zions Bancorp revealed a $50 million charge-off tied to alleged loan fraud, while Western Alliance Bancorp announced similar issues and legal action against a borrower. These disclosures triggered contagion fears, leading to steep declines of 10–13% in major regional bank stocks and a 6% plunge in the S&P KRE Regional Bank ETF. This was the steepest single day drop since April.
I’m personally very sceptical of credit growth in private credit vehicles, and this sector represents the largest “known-unknown” in markets.
There’s a reason banks operate as banks do and why they have the backstops they do. Private credit funds may have less liquidity calls given their closed-end nature, but this alone doesn’t stop contagion flowing to other open-ended funds.
As a follow up to last week’s Charts & Notes the market got thrown a curveball with the reappointment of the just resigned Prime Minister, followed by a promise to suspend pension reform until 2028. This outcome wasn’t even an option on Polymarket!
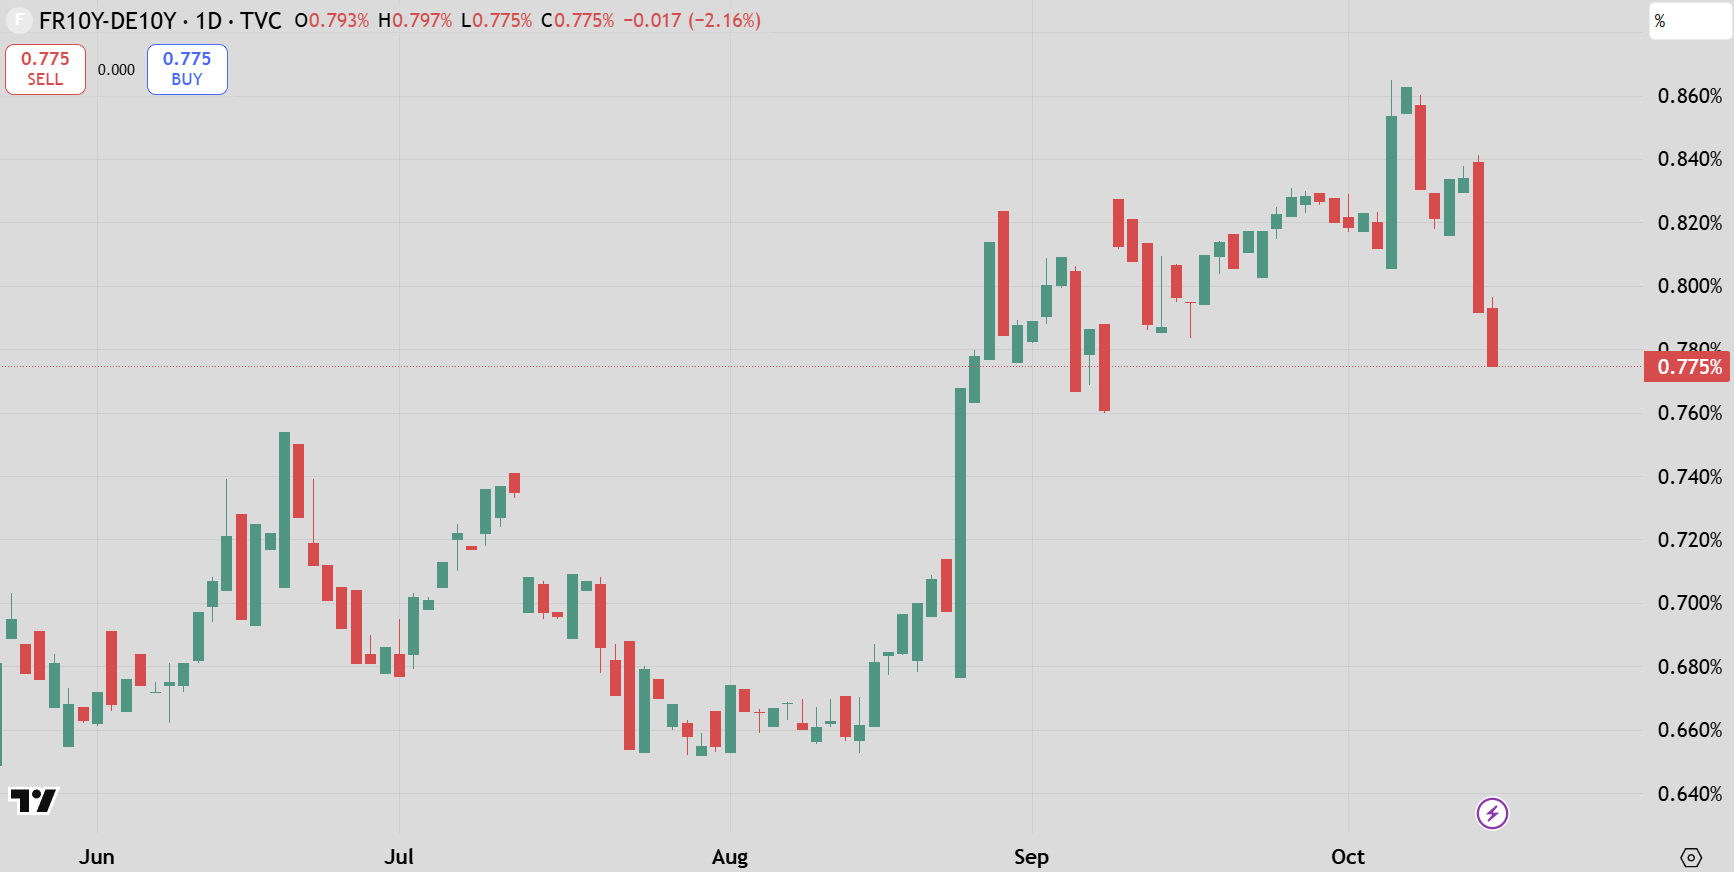
This will avoid a snap legislative election which reassured the market with equities up 2% and the OAT spread in substantially.
This does also mean that the long-term deficit will likely stay above 5% of GDP. A credit rating downgrade below AA is still on the cards here. While France may not be important on its own to a lot of you, the same politics will play out in a lot of other countries in the future.
Powell’s Speech
Quantitative Tightening (QT) is likely coming to an end very soon, in-line with the plan to continue to cut rates. This is happening under the cover of “weaker” employment markets and no concerning information on inflation.
(Note that the BLS will release the CPI figure on the 24th of October, despite the government shutdown.)
The expectation is that it will end within the next 3 to 6 months and the Fed’s balance sheet will stop contracting.
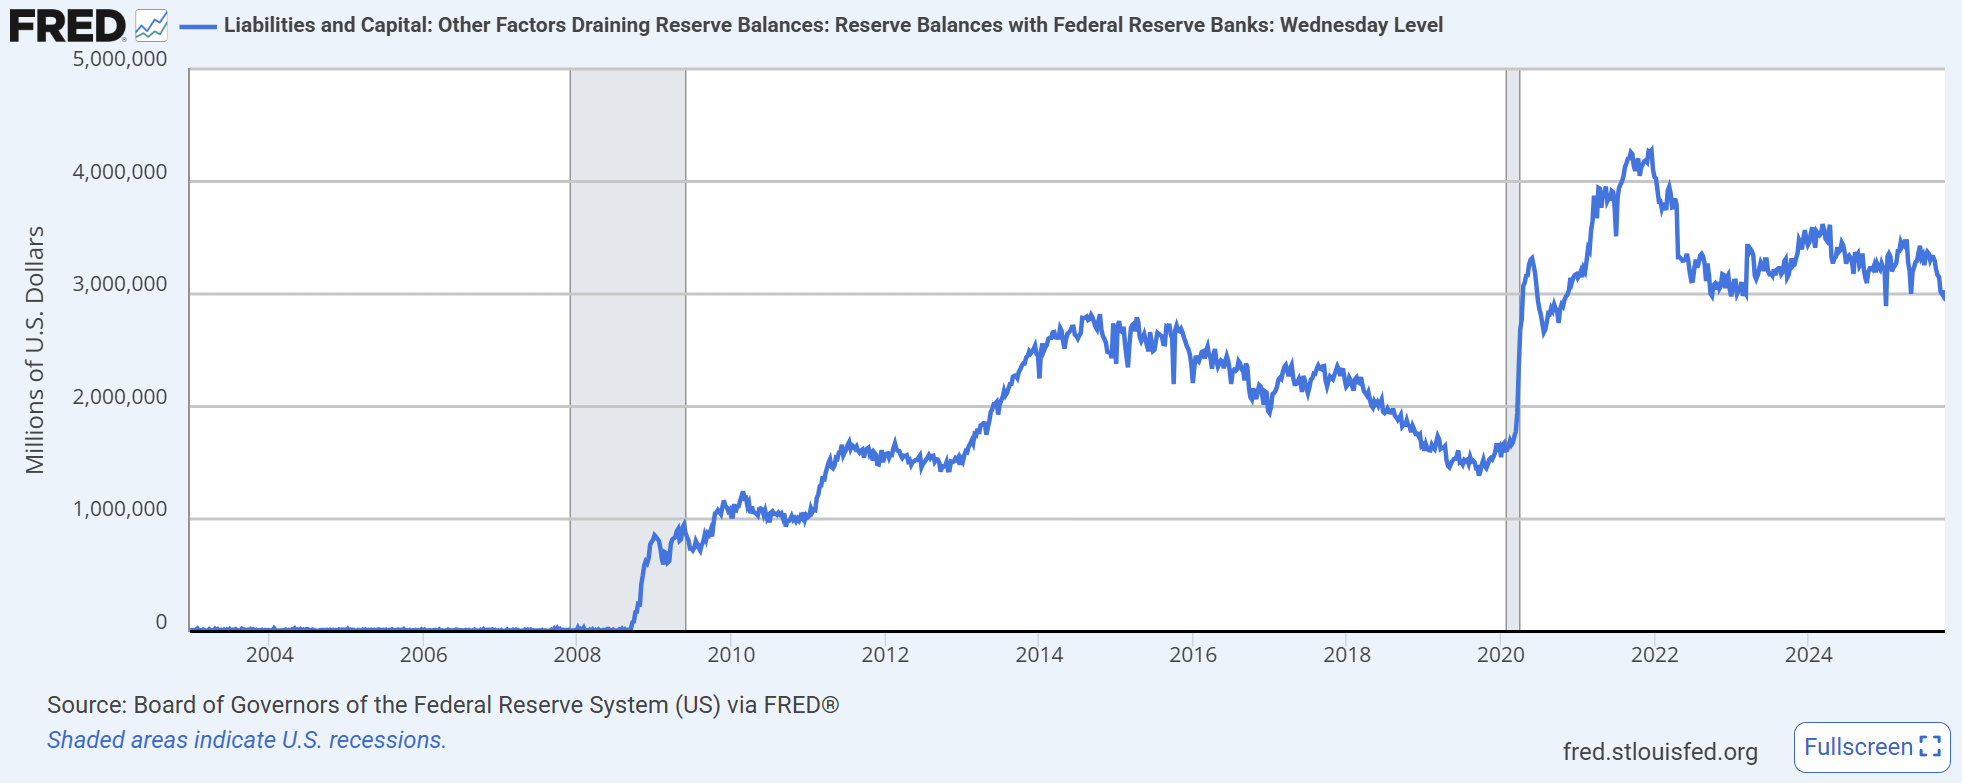
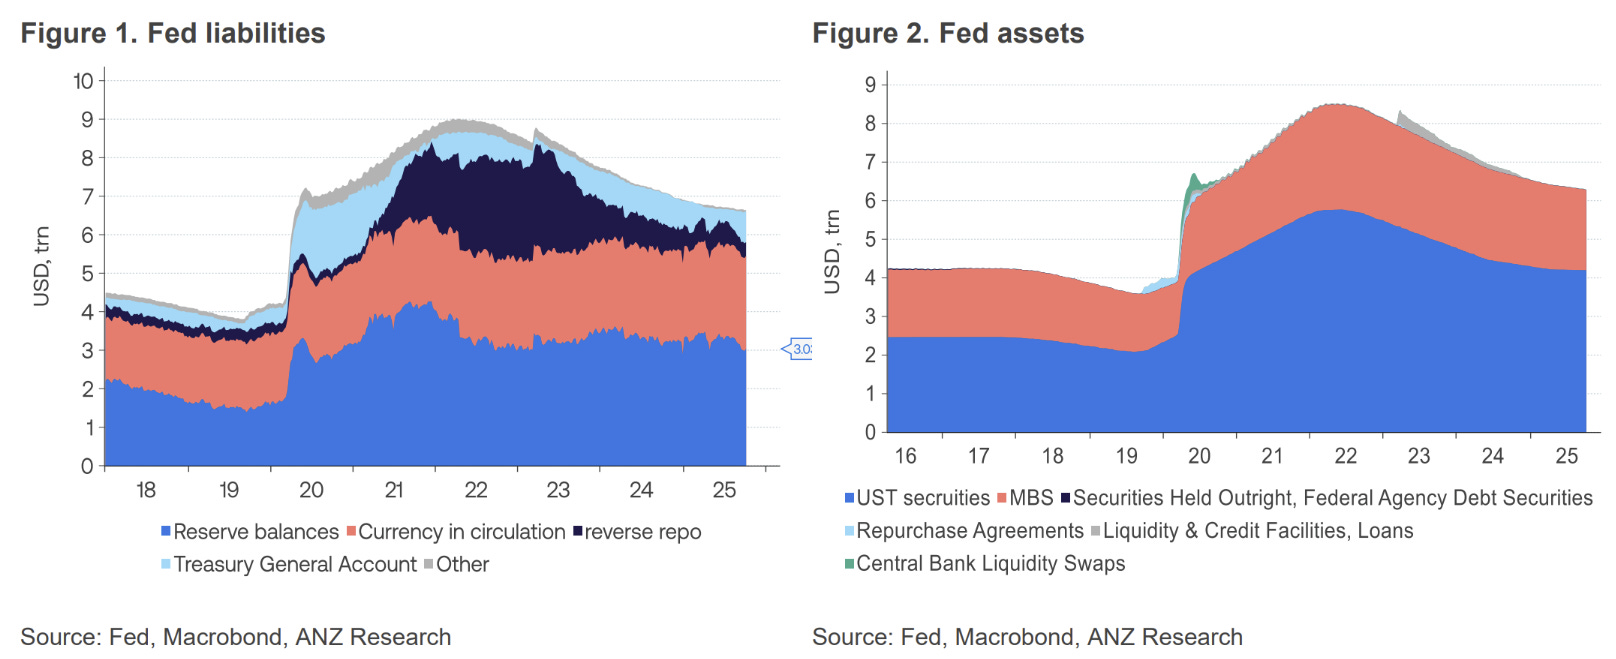
The real target for QT is balances held by banks at the Fed in the form of reserves. These reserves are created when the Fed acquires a Treasury bond from the bank. QE should make reserves increase, while QT makes them decrease.
The chart above shows that reserves are at roughly $3trn, above the $2-2.5trn from before the pandemic (it is generally accepted that the liquidity crisis caused in 2019 was a result of letting reserves drain too much).
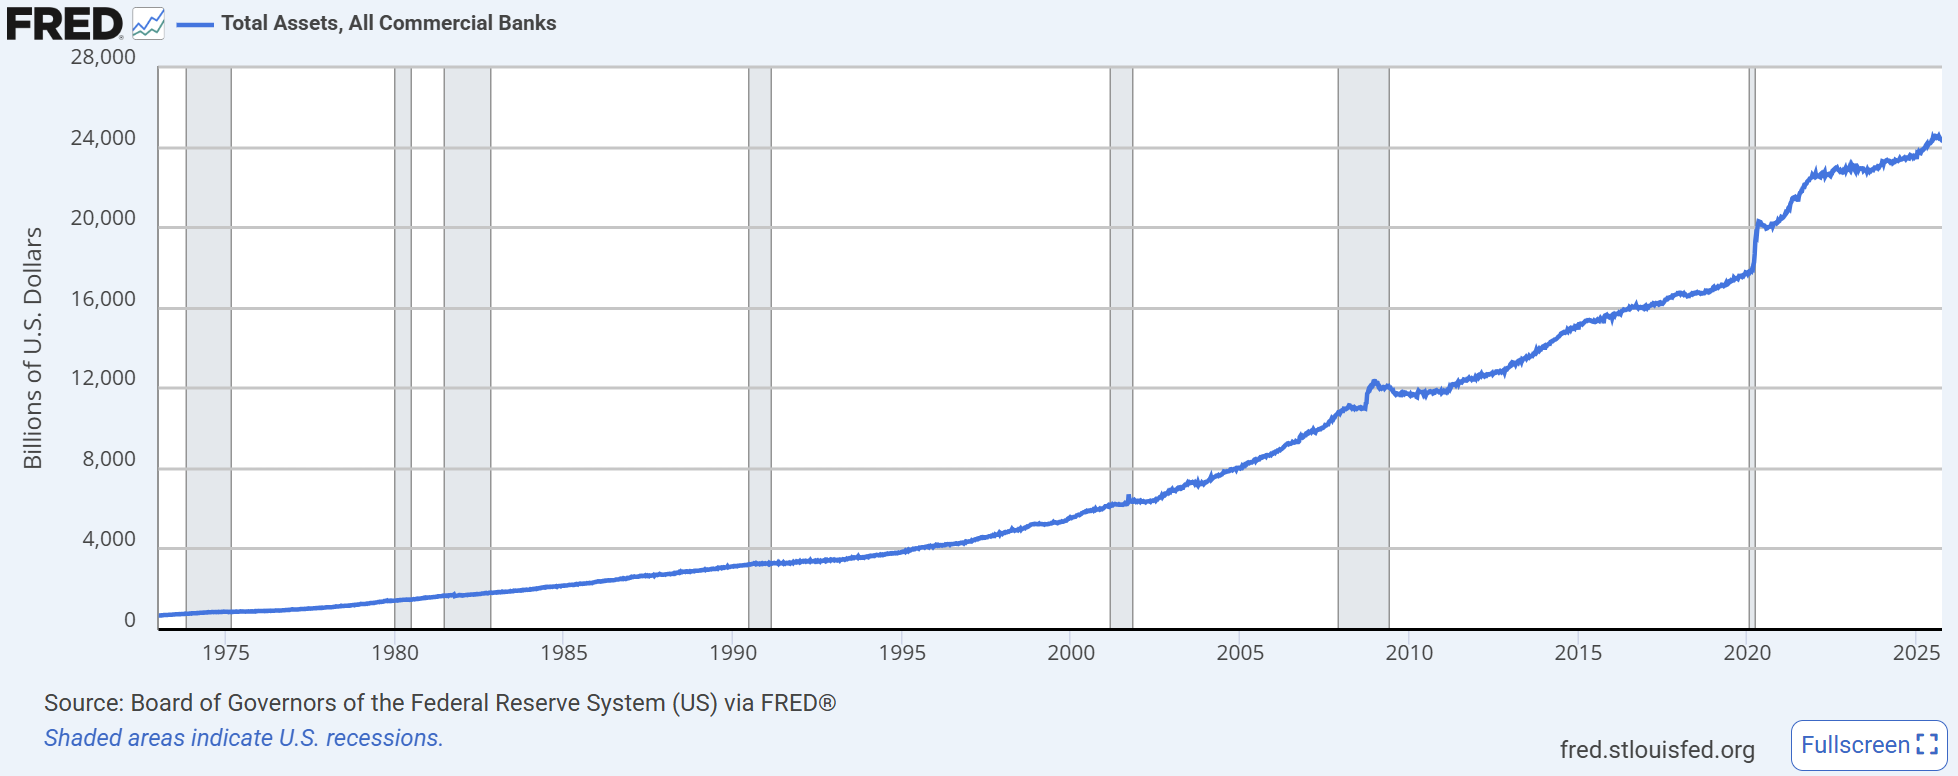
It is probably the right time to stop anyhow. The banking system is far bigger than it was in 2017 (approximately 48% bigger by total assets), putting reserves at $3trn about right…

…but any lower than $3trn (which is starting to happen now) we start to see some tightness in funding markets as the thread by Guy above explains.
Changes to the Fed’s role in the banking system through regulation necessitates a much bigger balance sheet than before. This is key to understanding why the Fed can never get the balance sheet much smaller than this.
The Fed can’t shrink its balance sheet!

Intentional bond buying and reserve creation through Quantitative Easing is only a small part of the reason that the Federal Reserve’s balance sheet is considerably larger than before the Global Financial Crisis.
I wrote a piece on this (above) which goes through each part of the Fed’s balance sheet and why it needs to stay at an elevated size.
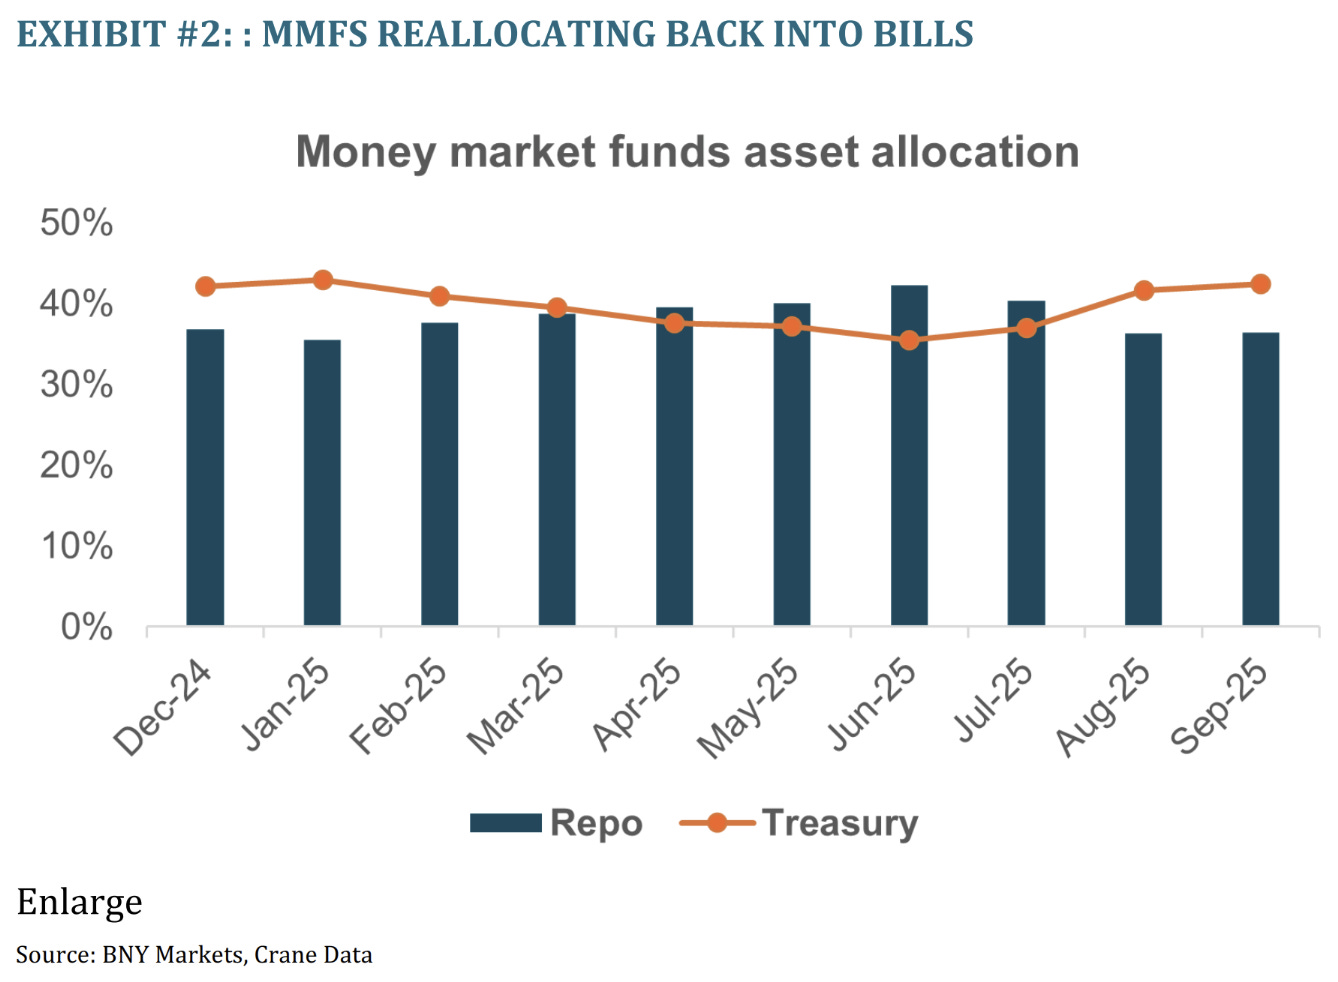
I underestimate the effect of QT on total balance sheet size mostly because of Janet Yellen’s (now implemented by Scott Bessent) decision to start issuing bills instead of notes to fund the deficit. This reduced the need for the Fed to run a reverse repo programme to satisfy demand for short-term debt and caused the balance sheet to shrink further.
If this is ever changed (unlikely), the Fed’s balance sheet will grow to accommodate.
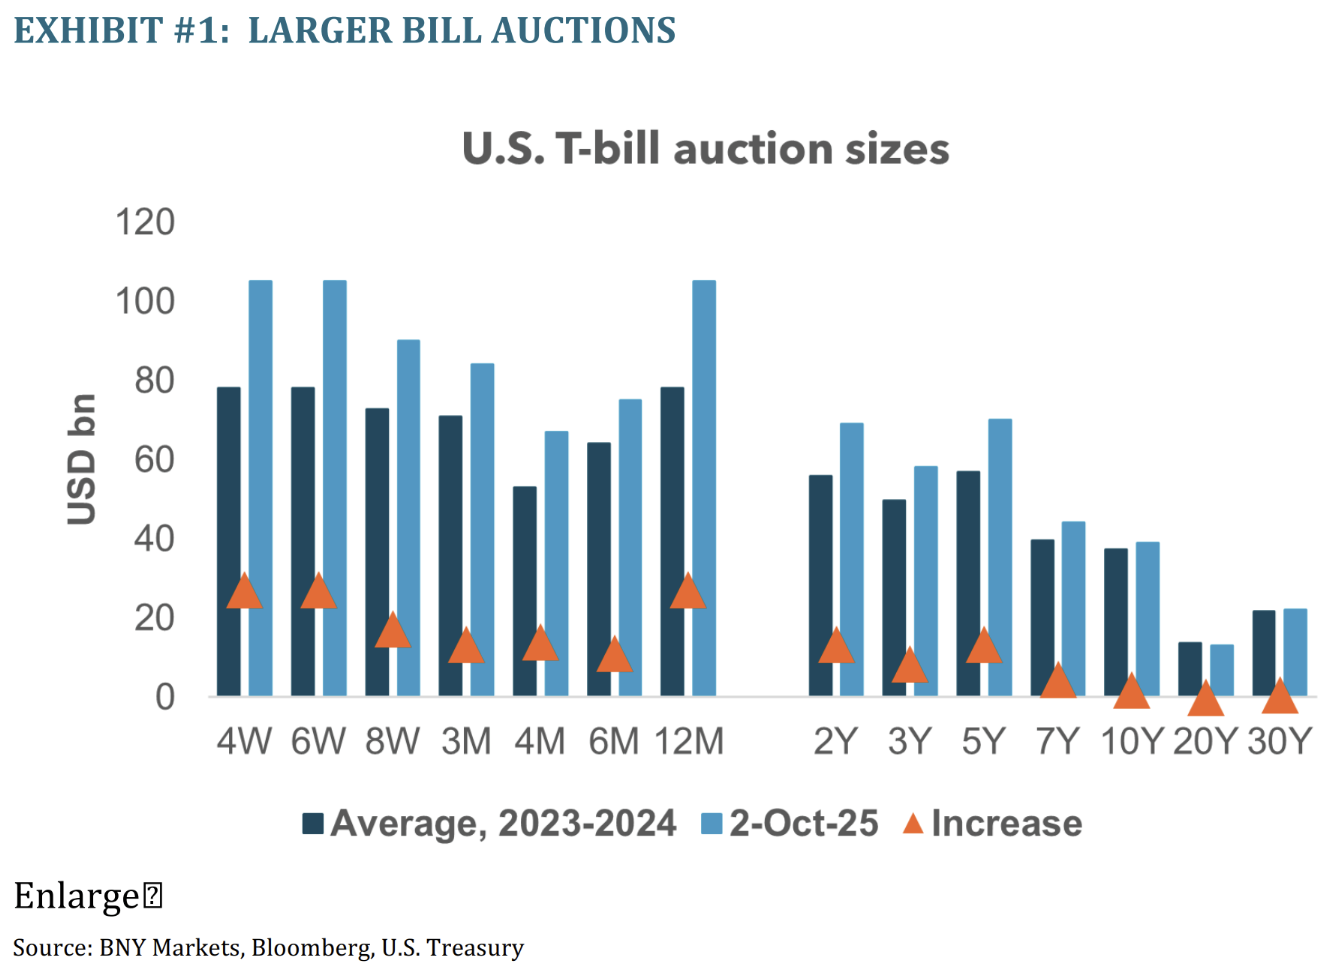
They’ve been leaning into it more, with auctions sizes increasing. From BNY:
In December 2019, 6% of all U.S. public debt outstanding was represented by T-bills. With the increase in government spending that ensued with the pandemic, by December 2020 bills represented 13% of all government debt outstanding, and by the end of September this year, they were 17%.
Why would you stop though? When you issue more, they just seem to buy more!
This has the primary benefit of keeping long-end yields in check. After the scare in April, it’s no surprise Bessent wants to avoid poking that bear.
In a rare contrition, Powell flagged that the Fed’s purchases of MBS during COVID may have been too much given the strong housing market during the pandemic recovery. With the clarity of hindsight, he believes the Fed should have stopped asset purchases sooner. That said, Powell acknowledged it is unclear whether stopping sooner would have made a difference to the economy’s trajectory.
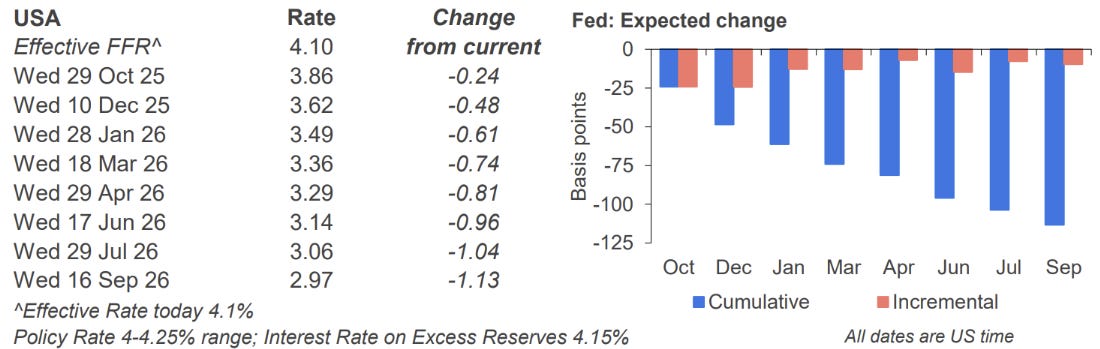
The speech was an opportunity for Powell to push back against October rate cut pricing, but he didn’t.
This would imply October and December are a lock for rate cuts. This has played into a stronger bond market than we’ve seen in a while.
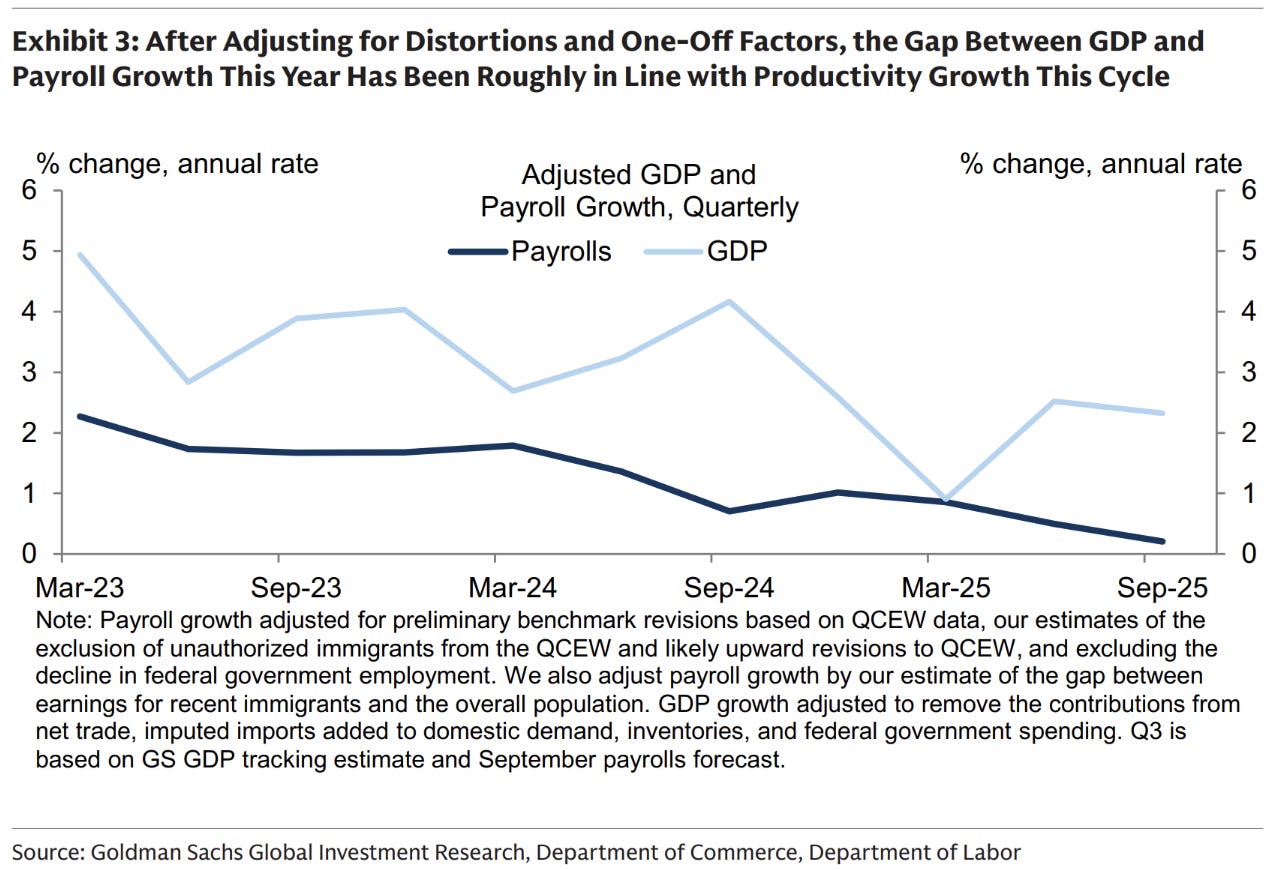
Goldman’s have attributed strong GDP growth outpacing weak employment growth as a productivity story…
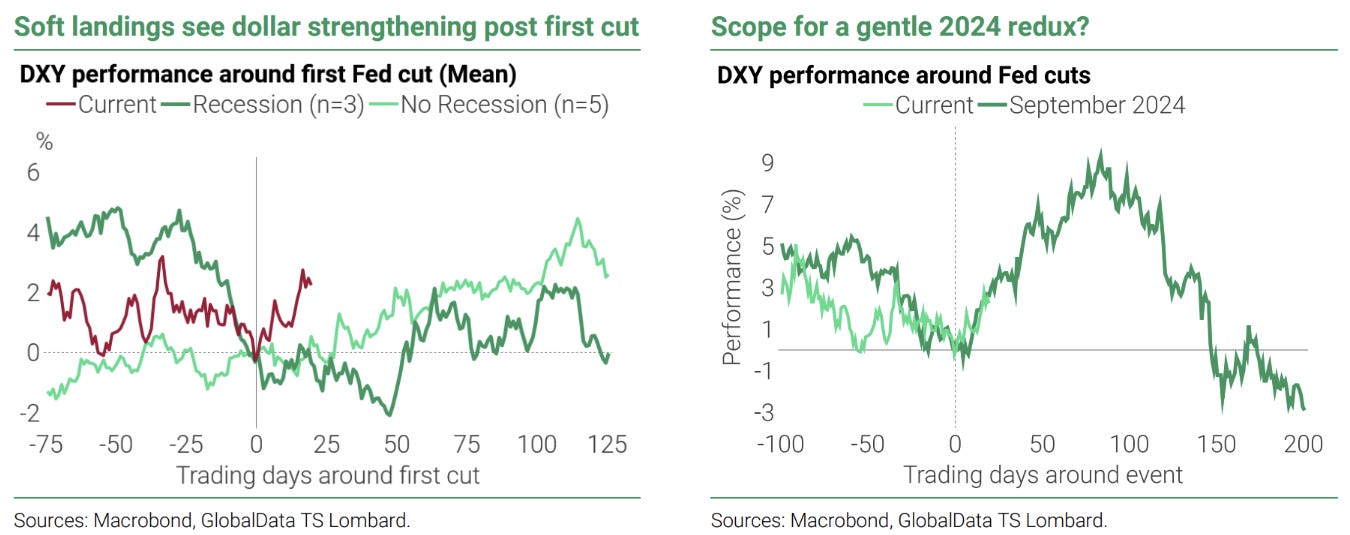
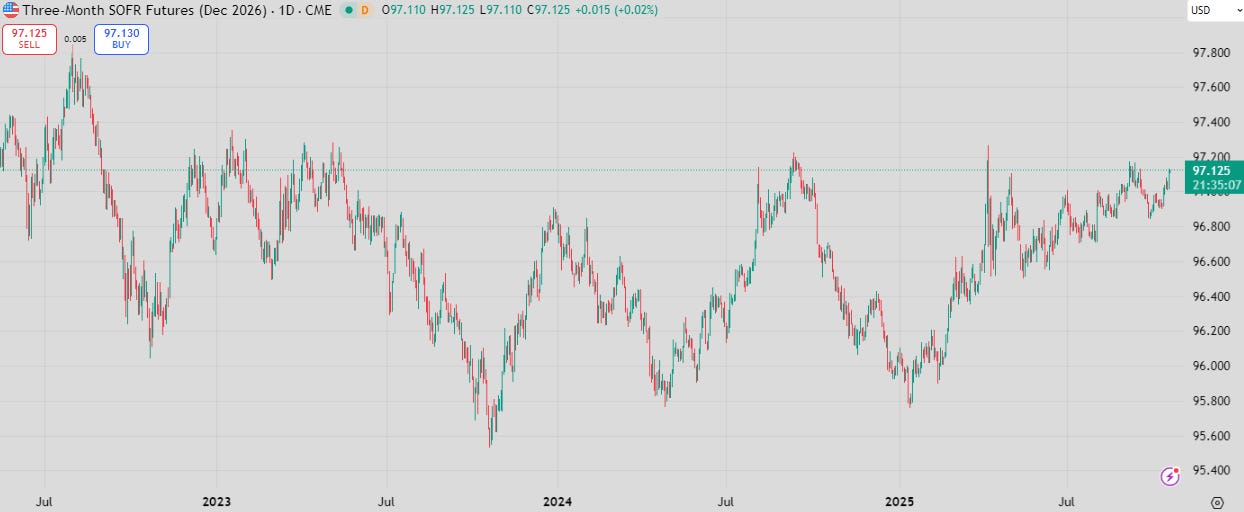
…while the currency in the grips of debasement (sigh) is performing despite a fairly certain rate cut path. US economic outperformance no doubt helping here.
It’s tariff time again
The new 100% tariffs were sparked by head clashing over rare earth minerals (or more accurately their processing). I wrote a whole Charts & Notes on it here.
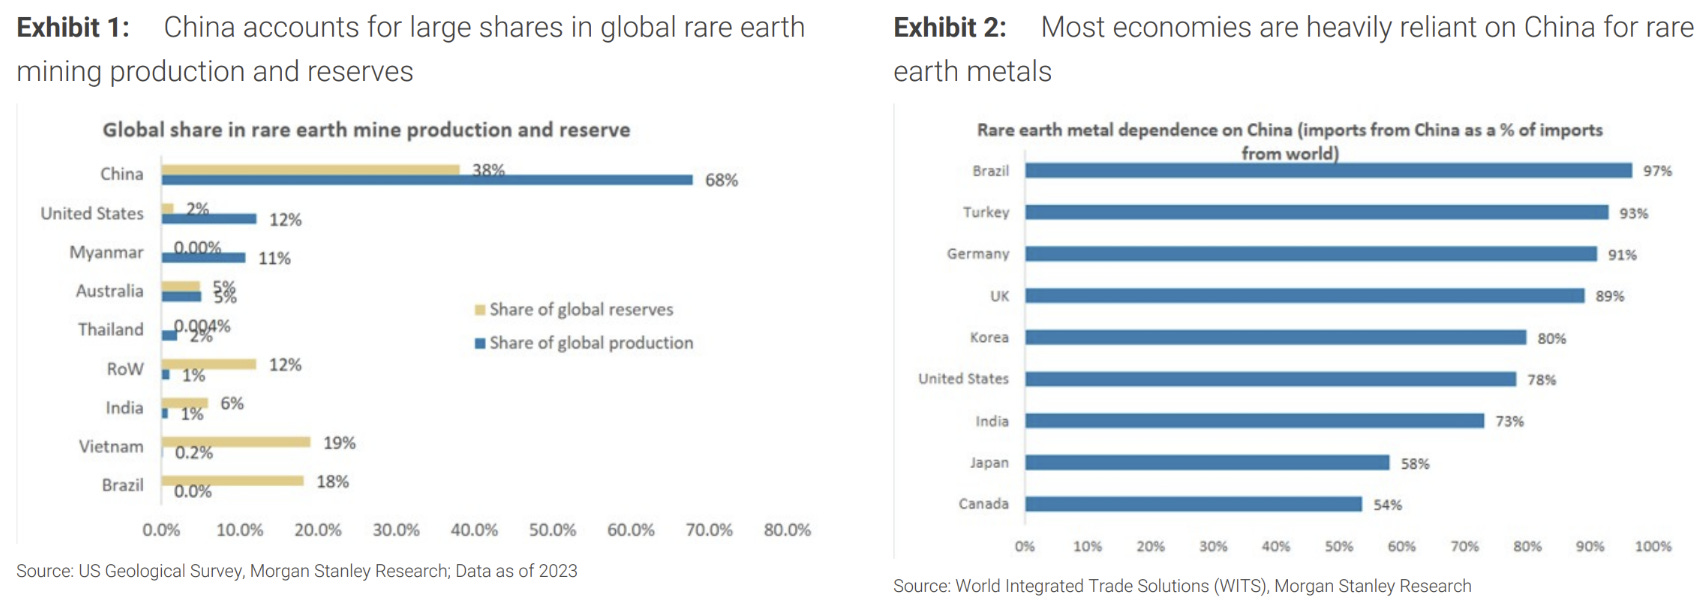
The chart above highlights the gap. China processes EMs share of rare earth extraction. Most western countries don’t want the ESG issues relating to it.
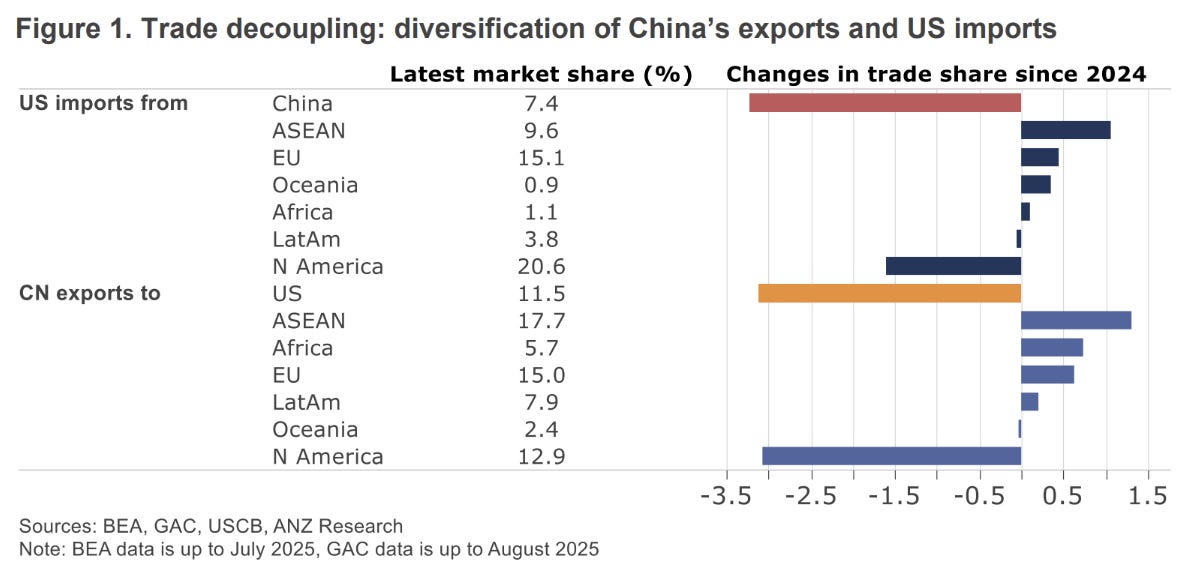
A by region breakdown above highlights how China exports have shifted this year. Some would say China has found new markets; I would say they’ve found new markets to tranship from.

Highlighting how important the customer is, BHP have agreed to price 30% of their Chinese exports in RMB (not the fake news 70% I reposted above). Still worth reading the thread however, as the points about USD sensitivity in crisis still remain.
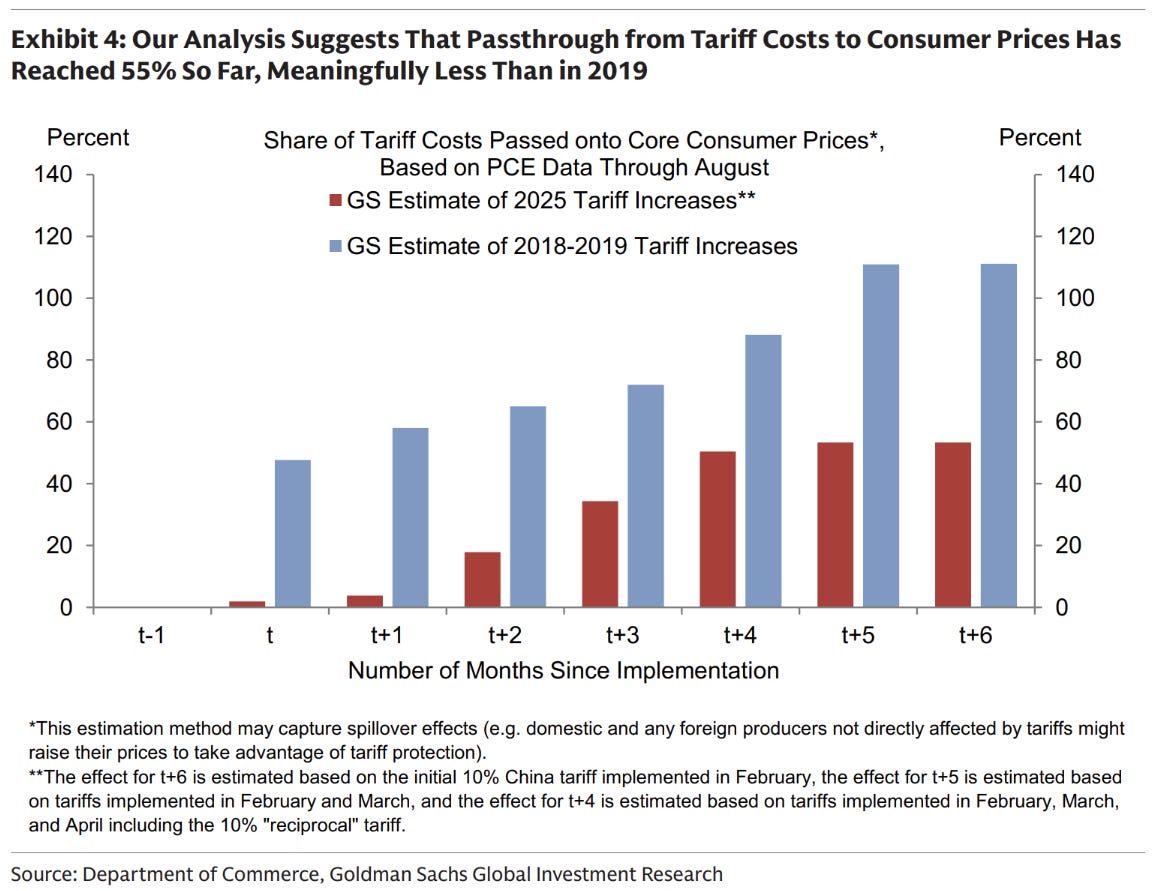
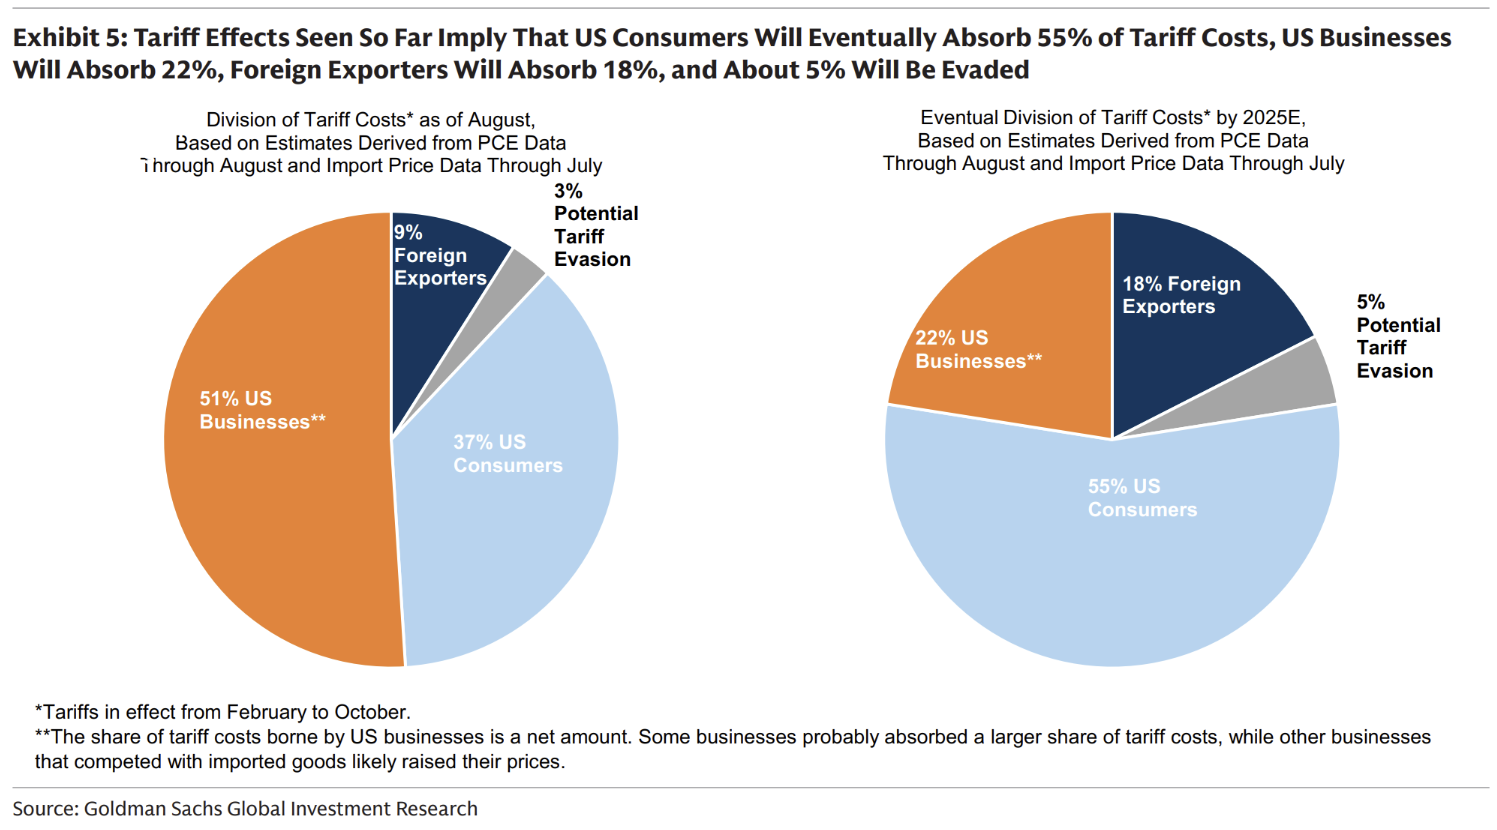
Goldmans have updated their tariff pass-through analysis, with the eventual amount paid by US consumers at 55% (much lower than in 2019).
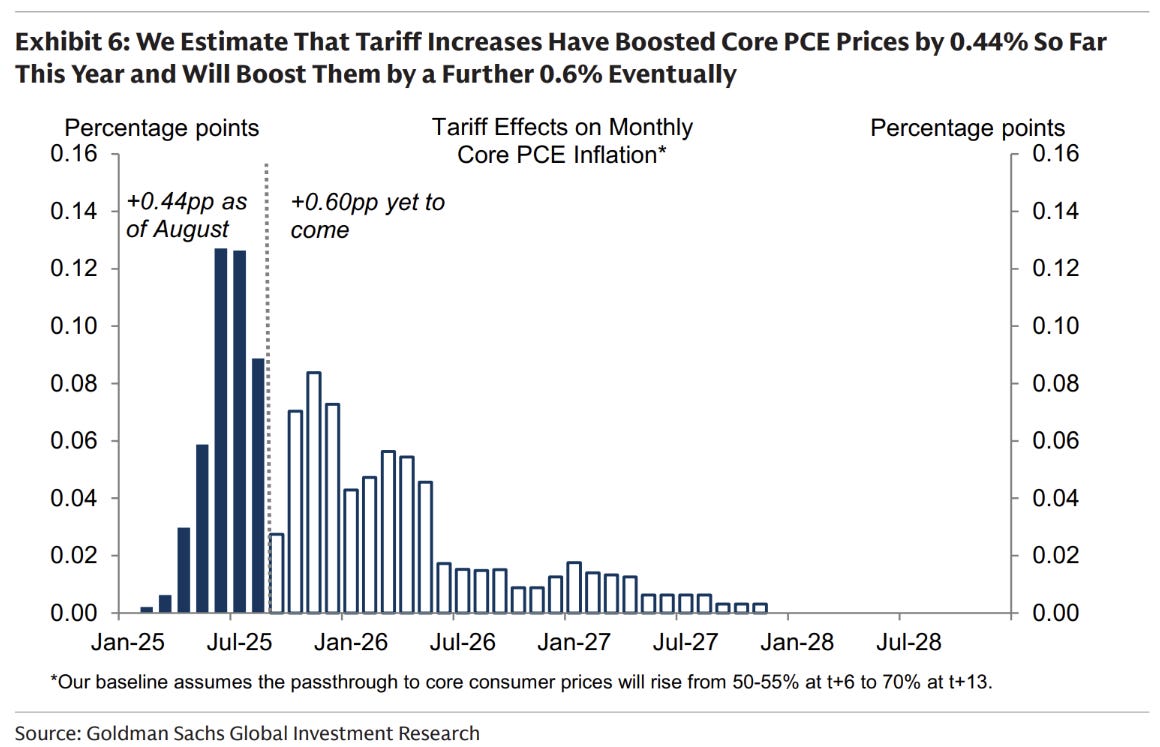
They estimate that tariffs have affected Core PCE by 0.44% so far, with 0.60% to come.
Sundry charts
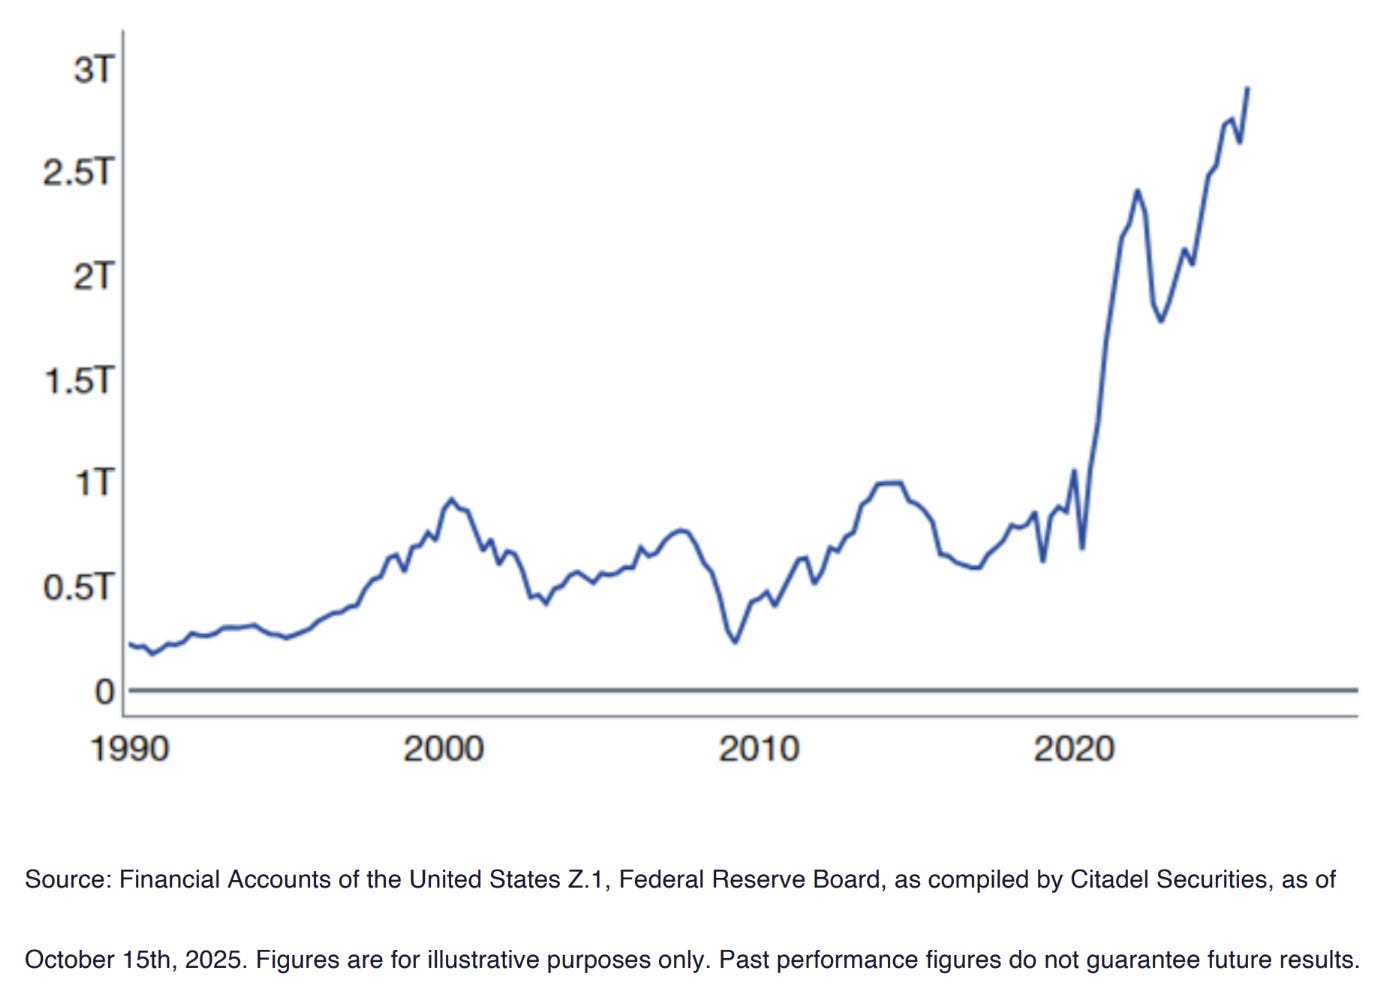
Citadel track equity ownership by a number of cohorts. For households under the age of 40, equity ownership has skyrocketed.
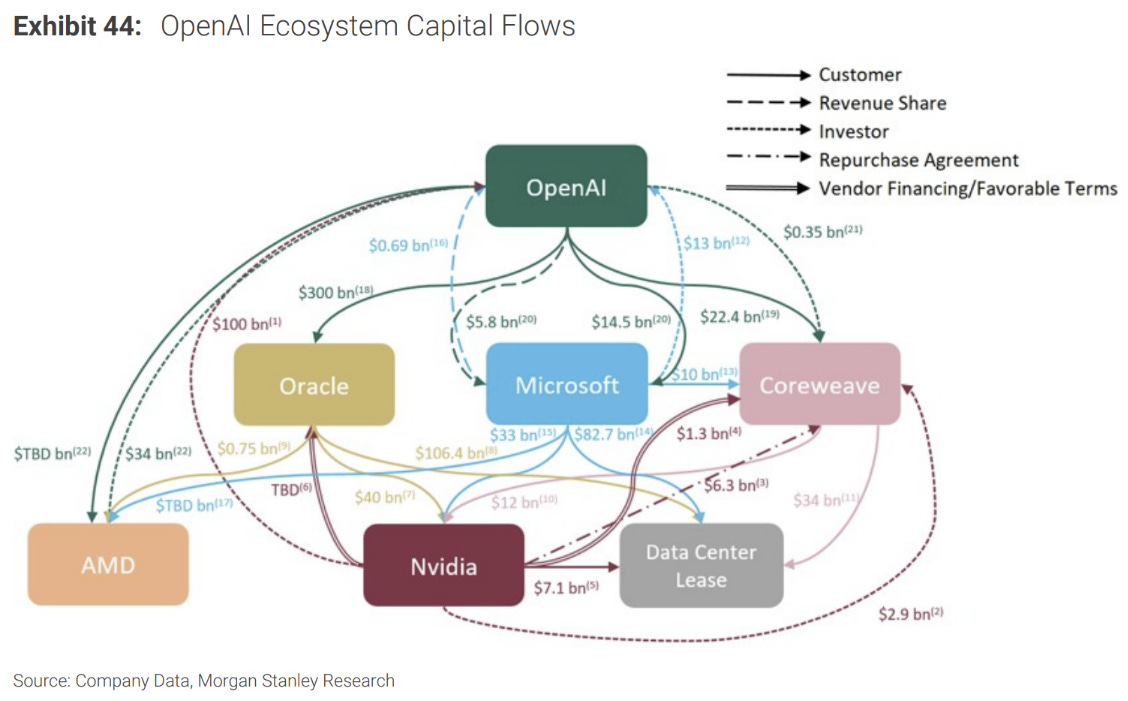
While I haven’t had the time to understand the structure of all the new AI announcements, it does seem that all the value created is front-loaded in the announcement.
I’m not at all equating OpenAI with Enron, but they were very good at doing something similar around the dotcom boom in relation to announcing anything “internet”. Announcement first, justification (and technology) second.
Great post Mr. Farac.
Particularly the plumbing part and your reference to an older and longer article you wrote on why the Fed can't shrink it's balance sheet much more than this.
Appreciate your writings.
Best,
Valentino