

This week we look at US GDP (not bad, given the volatility), the FOMC and the European trade deal (not bad, given the politics).
US Q2 GDP - better than it seems
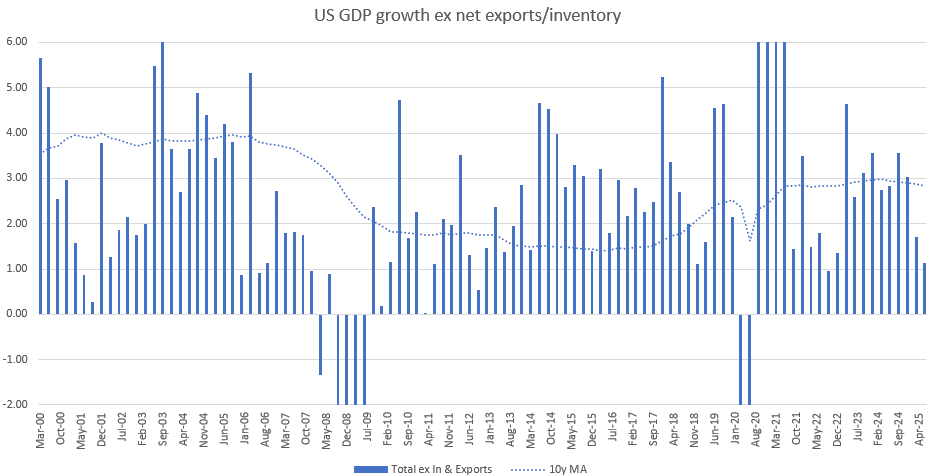
This week’s GDP release has been widely reported as being a weaker turn with final sales (real GDP growth ex imports and inventories) falling to 1.1%.
This is the metric most have pointed to as proof of the slowdown. I don’t think the story is that simple.
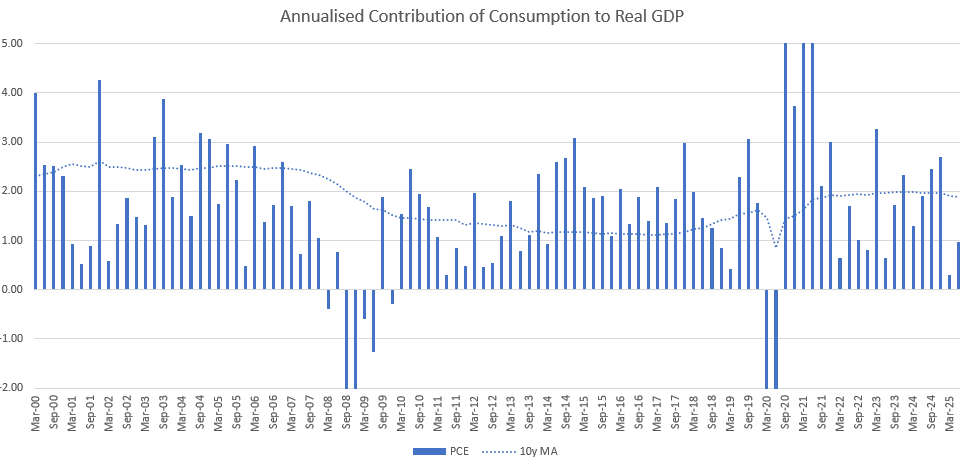
Consumption has been the main source of weakness, but this recovered slightly in Q2. Q1 can be attributable to weather, but Q2 isn’t as easy to attribute. General volatility and uncertainty could be the cause, but consumption doesn’t generally correlate with volatility all that much, and consumption possibly should’ve been brought forward with the threat of tariffs.
Offsetting this argument is that weakness in consumption (well below the 10y moving average as shown above) is that it doesn’t line up with any meaningful disruption in employment.
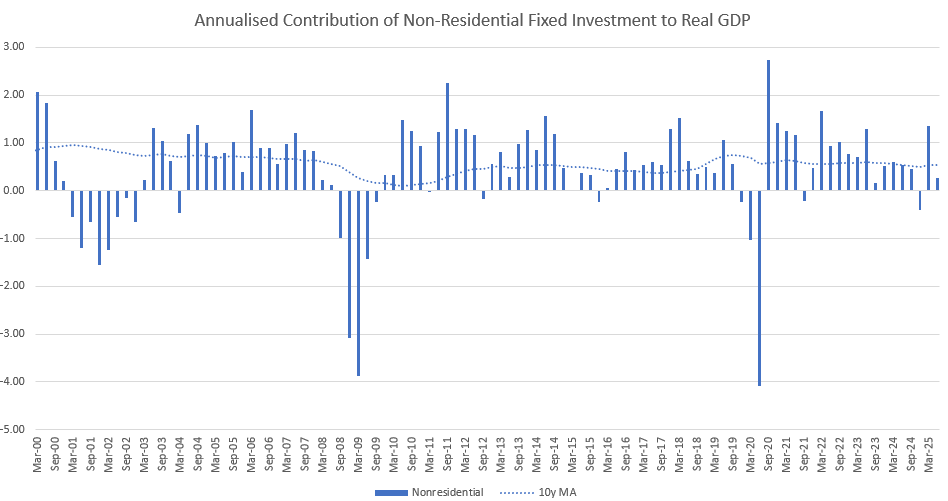
Q1’s lower consumption was offset by a large contribution from non-residential investment. Q2 saw this moderate but still remain positive.
Continuing expansion in bank debt should see this continue to contribute over the year.
While consumption isn’t affected by volatility in markets, non-residential investment definitely is.
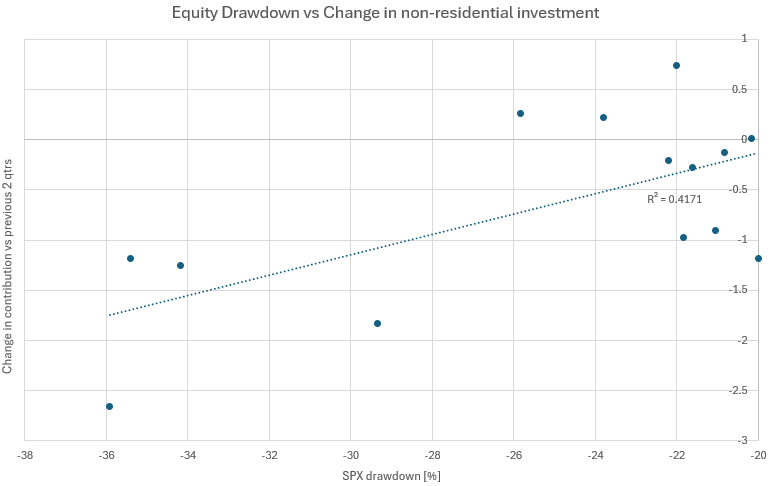
The S&P500 had a 22% range over Q2. The bigger the drawdown, the worse the fall in contribution from non-residential investment.
This shouldn’t be a surprise as investment is the first thing to retreat in the face of uncertainty. The fact that it was still positive in Q2 despite this volatility is still a good sign. The narrative is still intact here.
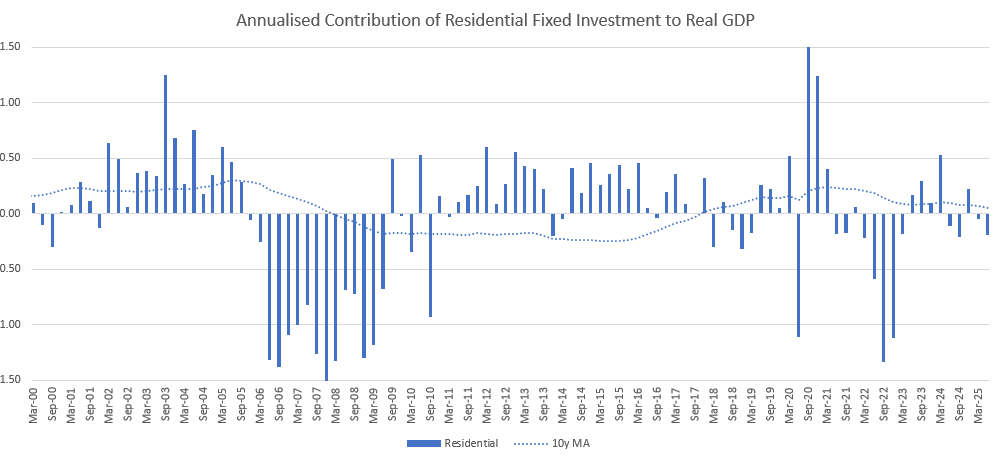
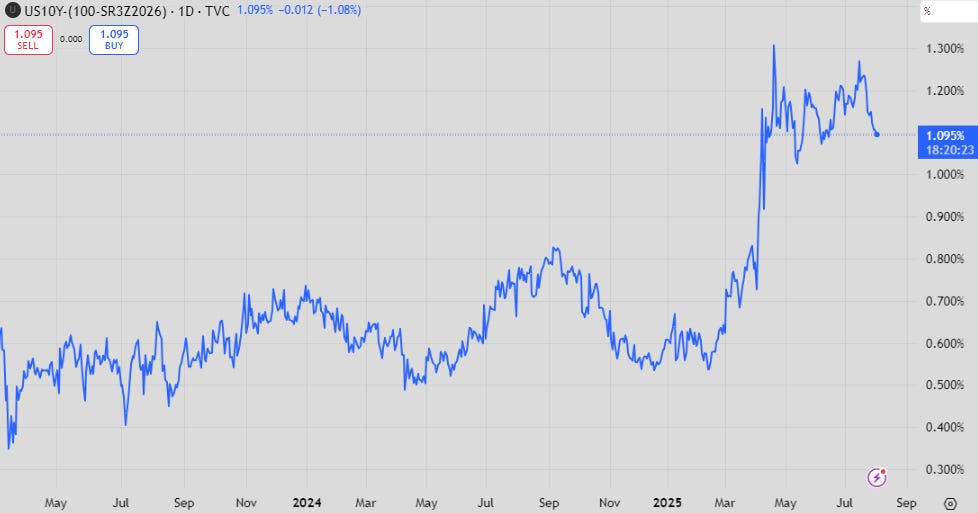
Residential investment continues to struggle with ever higher long-end rates, and a rollover of activity in multi-family. Don’t expect much help here.
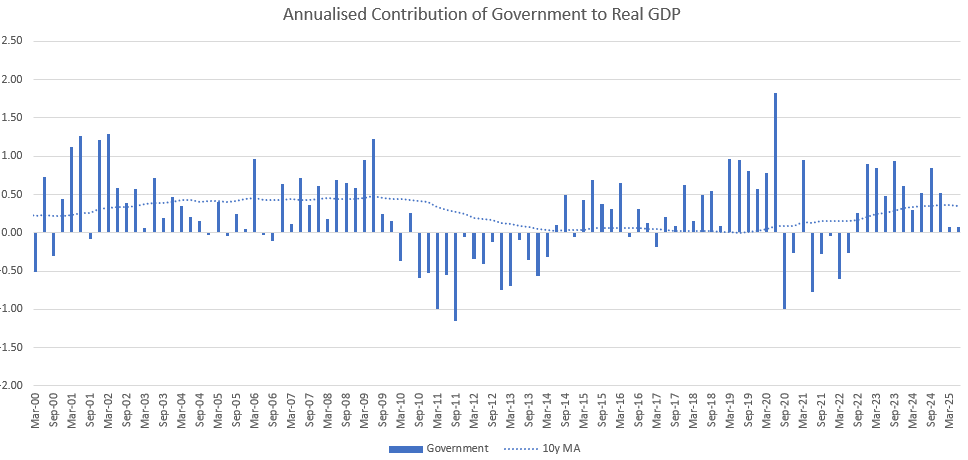
Contribution from government has also been curiously missing…
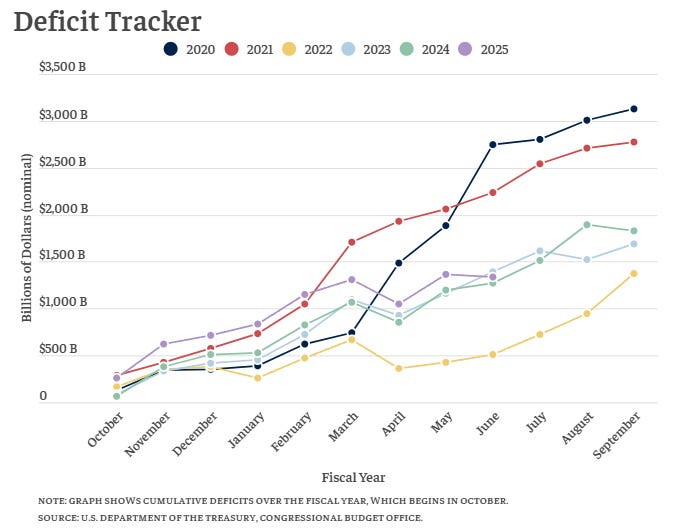
…despite the decent uptick over 2024. Tariffs seem to be causing this cumulative deficit to converge with 2024, however.
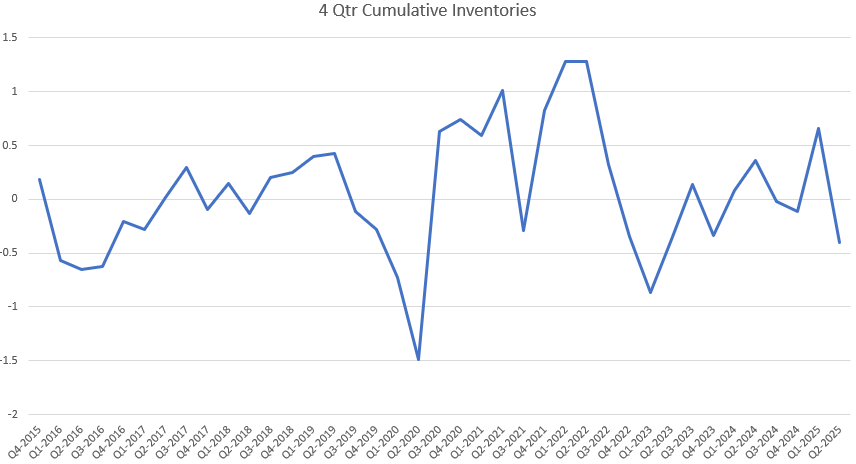
The extreme moves in net exports has been met with opposite moves in inventories as tariffs were front-run and then reversed.
There has been a cumulative drain on inventories which will likely reverse over the year if it isn’t due to genuine economic weakness (inventories are generally run down as production decreases into a recession).
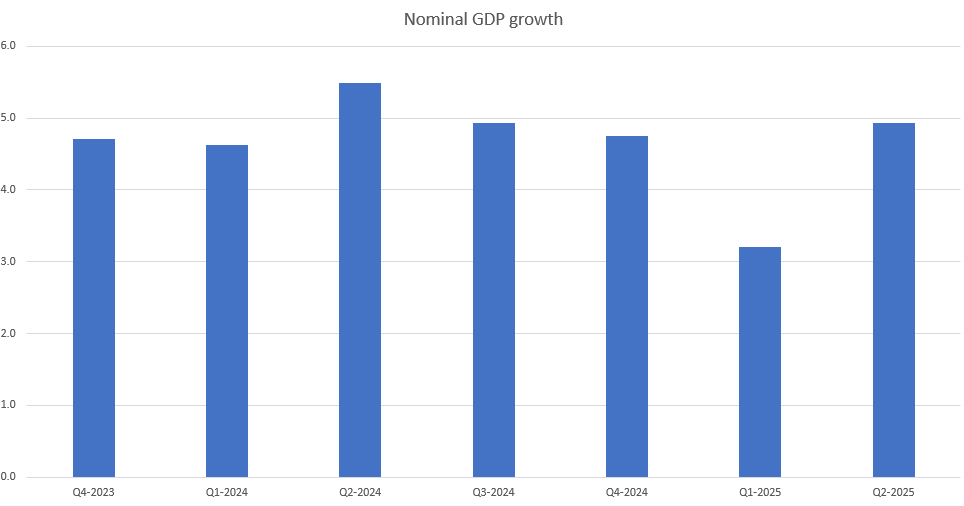
Headline nominal GDP growth picked back up again towards 5% after a drop in Q1.
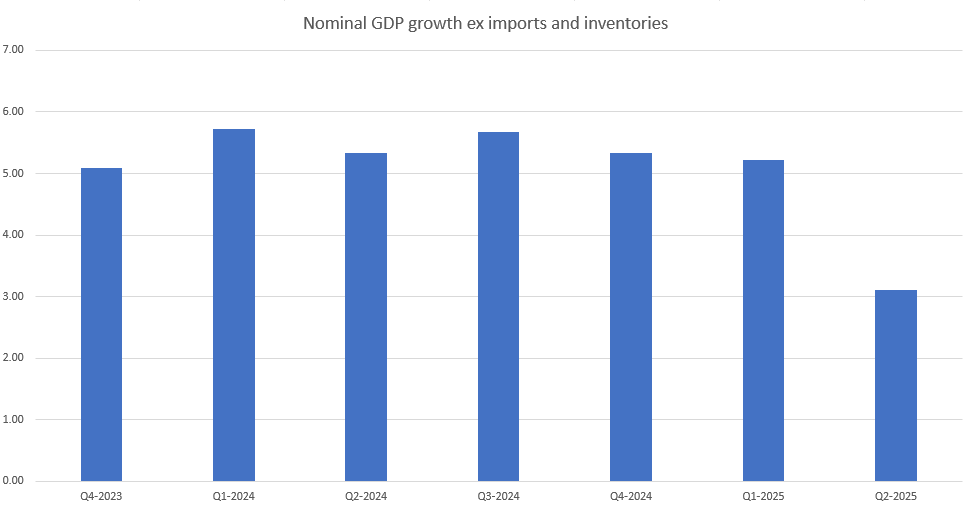
When we remove the effect of imports and inventories, it was in fact Q2 where the weakness is evident. This is the most important measure from my point of view, since my key focus has been the effect of larger budget deficits and a recovery in private sector lending should keep this measure of nominal GDP growth above 5% as it has been.
Does this mean the quarter was actually weak?
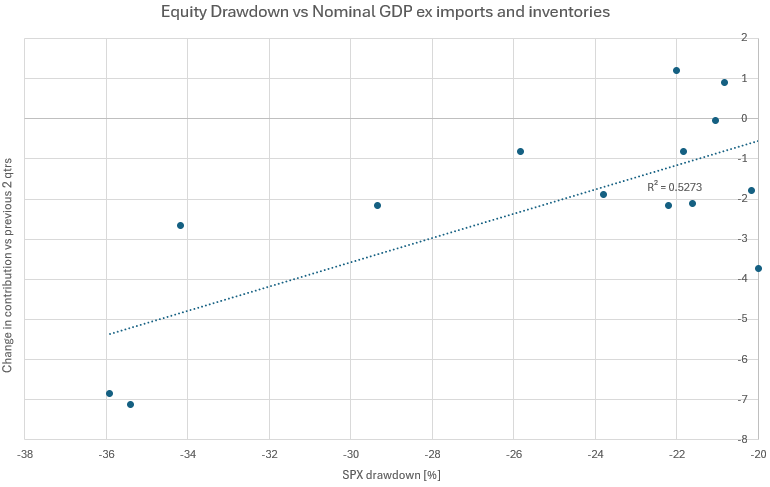
I’m not so sure. An even better fit to equity volatility than non-residential investment is this measure of nominal GDP growth.
The higher the volatility in equity markets, the higher the drop in nominal GDP against the previous 2 quarters.
There have been a number of moving parts in GDP over 2025, but it isn’t enough to invalidate the strength of the debt-funded growth that has defined the GDP growth for the last number of years. More in the link below.
How does US growth slow with so much new debt?

Given the recent moves in markets this post couldn’t be at a worse time! However, it’s worth noting that the first time I posted about this model and forecasted bullish US growth was at the worst of the 4th quarter 2023 equity drawdown (-10%, same as today) so it might be worth a consideration even with the extremely poor risk sentiment at the moment.
FOMC

Jay Powell put some doubt over a September rate cut which markets had more than a coin flip priced in. I’m sure this had nothing to do with the above encounter.
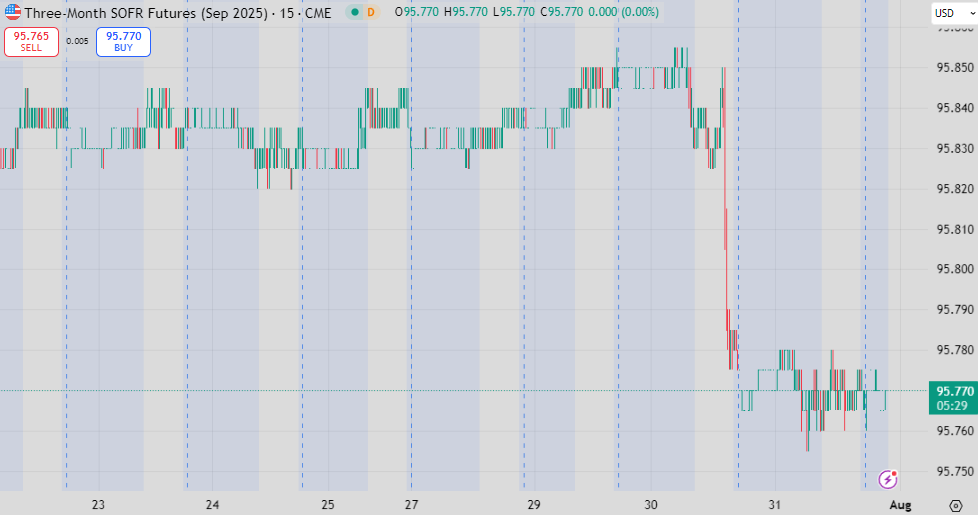
The September 2025 SOFR future backed out 10bp worth of cuts, driving the chance of a cut from 60% to roughly 40%, with some follow through after a hot PCE inflation report yesterday.
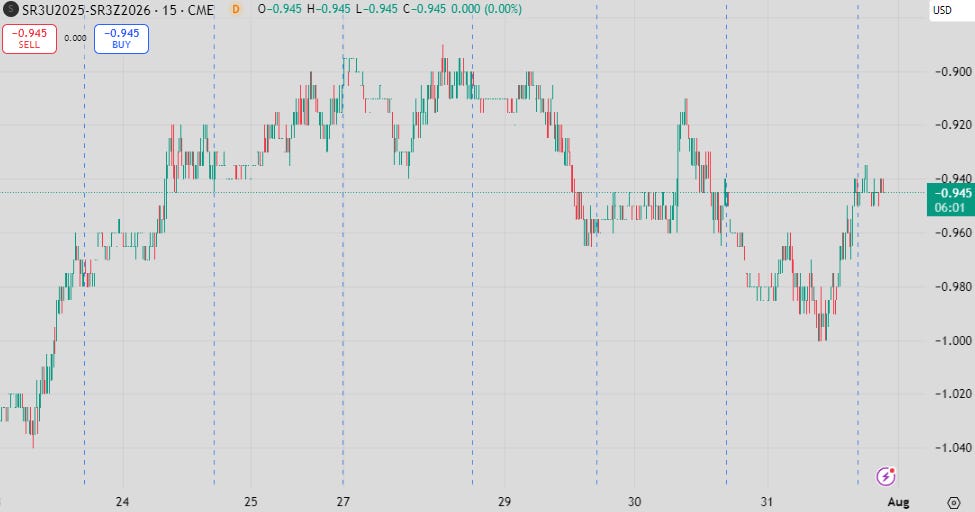
The nadir of futures pricing shifted higher in yield by about 4 or 5bp, with the spread to Sep-2025 mostly remaining unchanged with about 1% of total cuts.
Staying long the short end makes sense from a portfolio perspective, but judging timing of cuts when there is so much conflicting economic data is impossible.
My only conviction trade in the rates space suffered over the week as pricing of cuts retreated.
The European trade deal

Plenty of pearl clutching over the European deal with the US, where Europe appeared to agree to a 15% tariff and US LNG buying in return for seemingly little back.
The Japan deal was likely the incentive, and perhaps a realisation that a 15% tariff would be unlikely to move production out of Europe (as should be their focus).
Either way it is a surprising example of pragmatism from the Europeans, with rising trade tensions with China refocusing them.

If the aim is to keep production in Europe, then China should be the focus and not the US. This stops them fighting a war on two fronts. Certainty increases.
Charts I hate
The image below has been doing the rounds this week.

While it looks like the BLS are just making numbers up, it refers to imputed prices for individual categories, most absolutely tiny in weighting in CPI, making the actual impact small.
It’s always worth remembering that all economic data is an estimate, and only politicians should take them as exact measures (when it suits them, of course).