

The realisation expressed in my post below has ended up with more pain for shorts, with GDP turning out to be pretty good along with payrolls.

The underlying themes outlined in my last big picture theme piece, with an acceleration in debt growth supporting consumption and actually driving trade deficit to be larger rather than smaller…
How does US growth slow with so much new debt?

Given the recent moves in markets this post couldn’t be at a worse time! However, it’s worth noting that the first time I posted about this model and forecasted bullish US growth was at the worst of the 4th quarter 2023 equity drawdown (-10%, same as today) so it might be worth a consideration even with the extremely poor risk sentiment at the moment.
…but more on this later.

In regard to the hard data actually deteriorating we are still early. Higher prices due to tariffs are passing through the middlemen now and we end up in retail soon. This is where volumes (i.e. the “real” part of real GDP) will presumably be affected, but given market performance everyone is waiting for confirmation rather than to bother trading off a forecast, survey or expectation.
1Q GDP
1Q GDP may be seen to be a bit irrelevant given how backward looking it is and how much has changed since, but I think it is important as it highlights the narratives that have (and will continue to drive) the US economy at a base level separate to the effect of tariffs.

At 2.3%, growth ex-imports and inventory was good in a weather affected quarter. Note that we exclude net exports and inventory as they tend to wash out to zero over the medium term (the US has had a slight drag from net exports over the very long-term as the trade deficit has widened over the last 25 years).
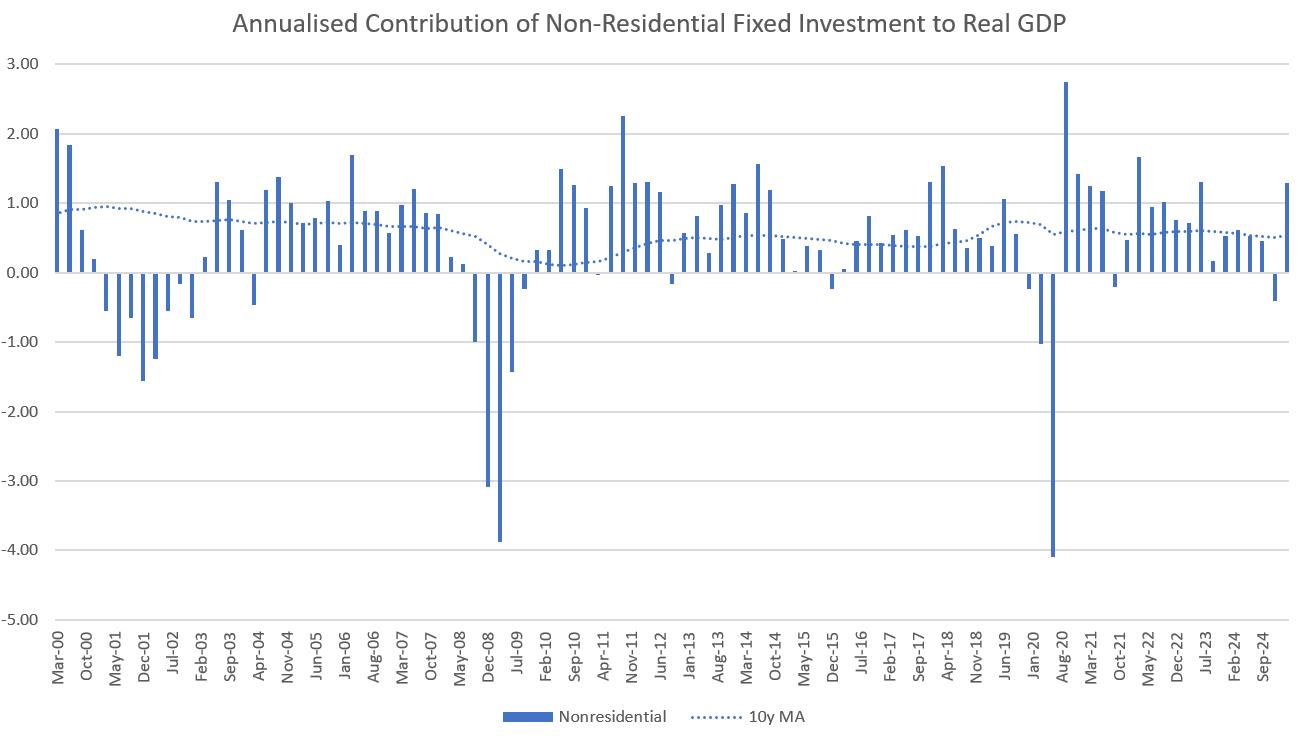
The big surprise was the contribution from non-residential investment, which was likely the destination for very strong Q1 private sector credit growth.
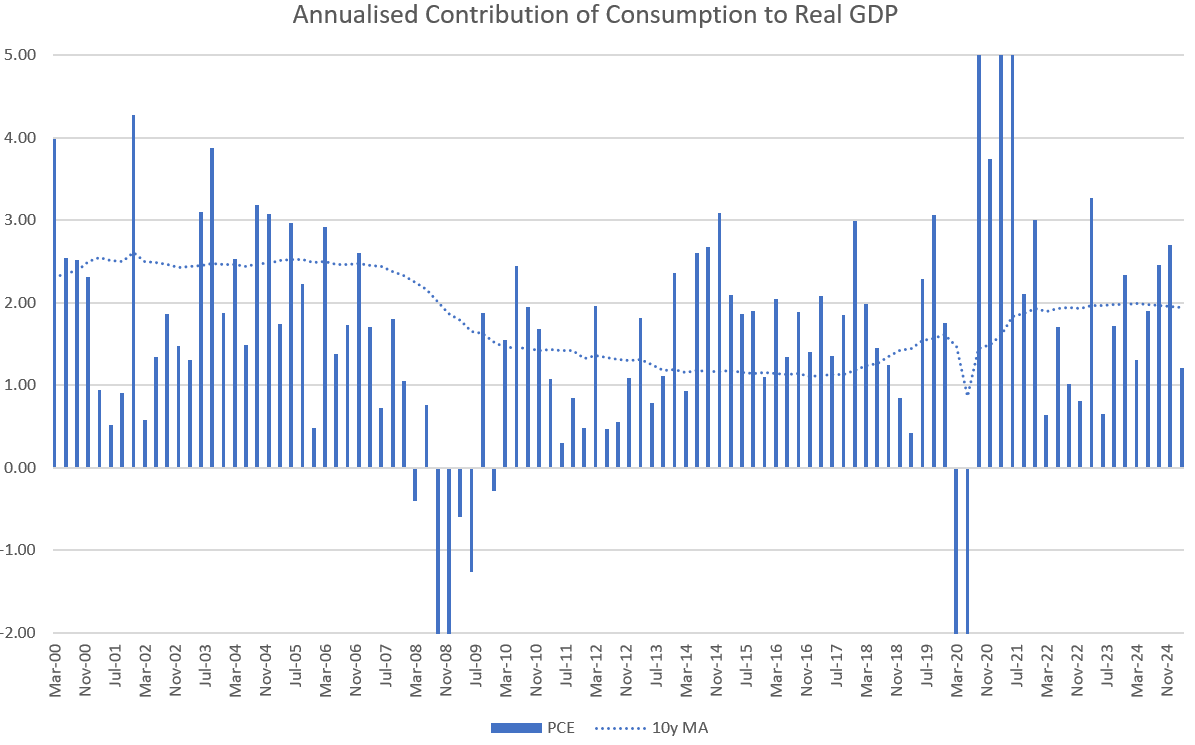
This offset weaker household consumption…

…and a slowing contribution of residential fixed investment to GDP. Higher Q1 bond yields likely had influence here.

As flagged by the Atlanta Fed GDPNow model, front-running of tariffs caused net exports to detract from GDP at about a 5% annual pace.

Compared to consecutive increases in the trade deficit post-pandemic it doesn’t look as bad on a chart as I thought it would. Inventories rose also (as you would expect) leading to a -0.3% real GDP print from an ex-trade, ex-inventories result of 2.3%.

Nominal GDP growth slowed to 3.4% on the full GDP number. Adjusting for trade and inventories puts nominal GDP growth at 6%, a very strong result.
I generally provide a forecast for real GDP given the underlying trends in each main category, and this is a bit difficult at the moment.
When it comes to the underlying drivers of GDP (outside of tariffs), results closer to 3% real and 6% nominal GDP growth are to be expected.
Tariffs, in my opinion, will only change real GDP and not nominal GDP in the bull case. This is a courageous call, I know. However there just doesn’t seem to be a slowdown in debt-based stimulus entering the economy from either the public or private sector. As long as private sector credit keeps on recovering, nominal growth will likely be strong.
Where the change will come is that 2-3% real GDP is more like 1.2-2%, with the difference being allocated to increasing inflation. This will come from reduced consumption as the price effect of tariffs hit.
Essentially the economy will grow the same in USD terms (which is nominal GDP) but grow far slower in “real” terms as volumes decrease. Note that this is a year forecast, not a next quarter forecast, so we obviously can undershoot this average when everything hits.
Unchanged average nominal GDP growth is the bull case. Nobody is expecting this and would lead equities to finish the year more in-line with past year’s growth.
Not a 6 vol asset anymore
It seemed like the only excitement this week came from the huge jump in the Taiwan Dollar against the US Dollar. Traditionally a low-vol FX pair, the daily moves were proper “black swan” events purely on the numbers.

While it gave plenty on X the fuel to talk about it as the canary in the coalmine they desperately want, I really struggle to get excited in the case where it’s the USD selling off rather than rallying against a currency like the TWD.
Maybe I’m too old school but appreciation is usually a result of local happenings, rather than a sharp depreciation which is external and very problematic.

So, what are the leading theories for the large move? While a planned appreciation to placate the tariff gods is popular, it is most likely due to underhedged Taiwanese Life companies that have moved to cover a little more of their USD exposure than they have in the recent past.
Note that the TWD is heavily undervalued on every measure out there, and exporters have been hoarding USD for a considerable amount of time. The speed of the move should raise eyebrows, but the direction shouldn’t.
It’s more than just economic data
Morgan Stanley had a good piece on Q1 company reporting and the effect on pricing and forecasting.

Generally good reporting has led to a bounce in forecasting breadth, ending an extended weak period.
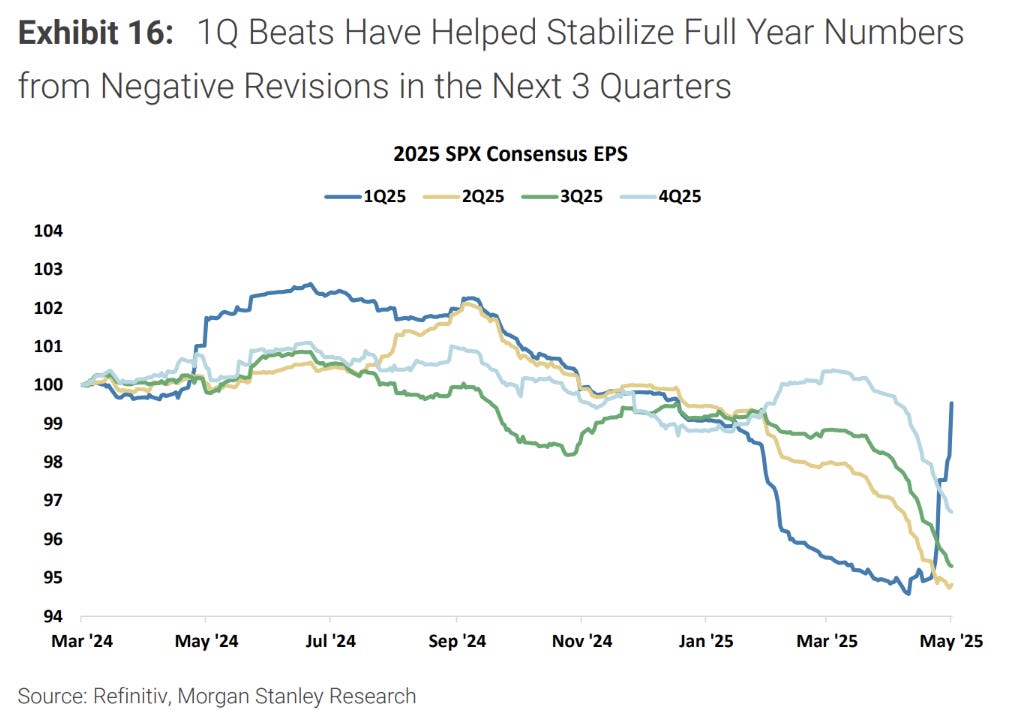
Quite the turn here with an elimination of all of this year’s downgrades.

Who knew that this tends to happen around results where companies nearly always beat in aggregate?!?!
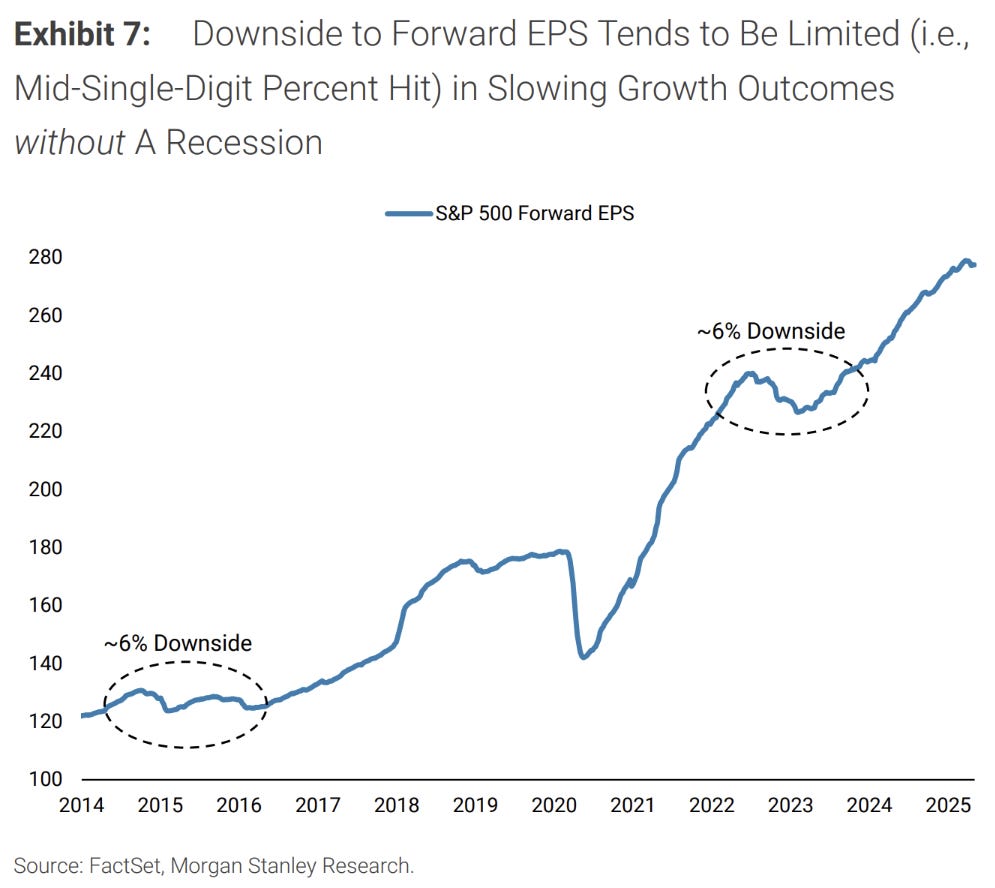
If I’m right about my nominal GDP growth forecast above this is the sort of forward EPS path we’ll see.
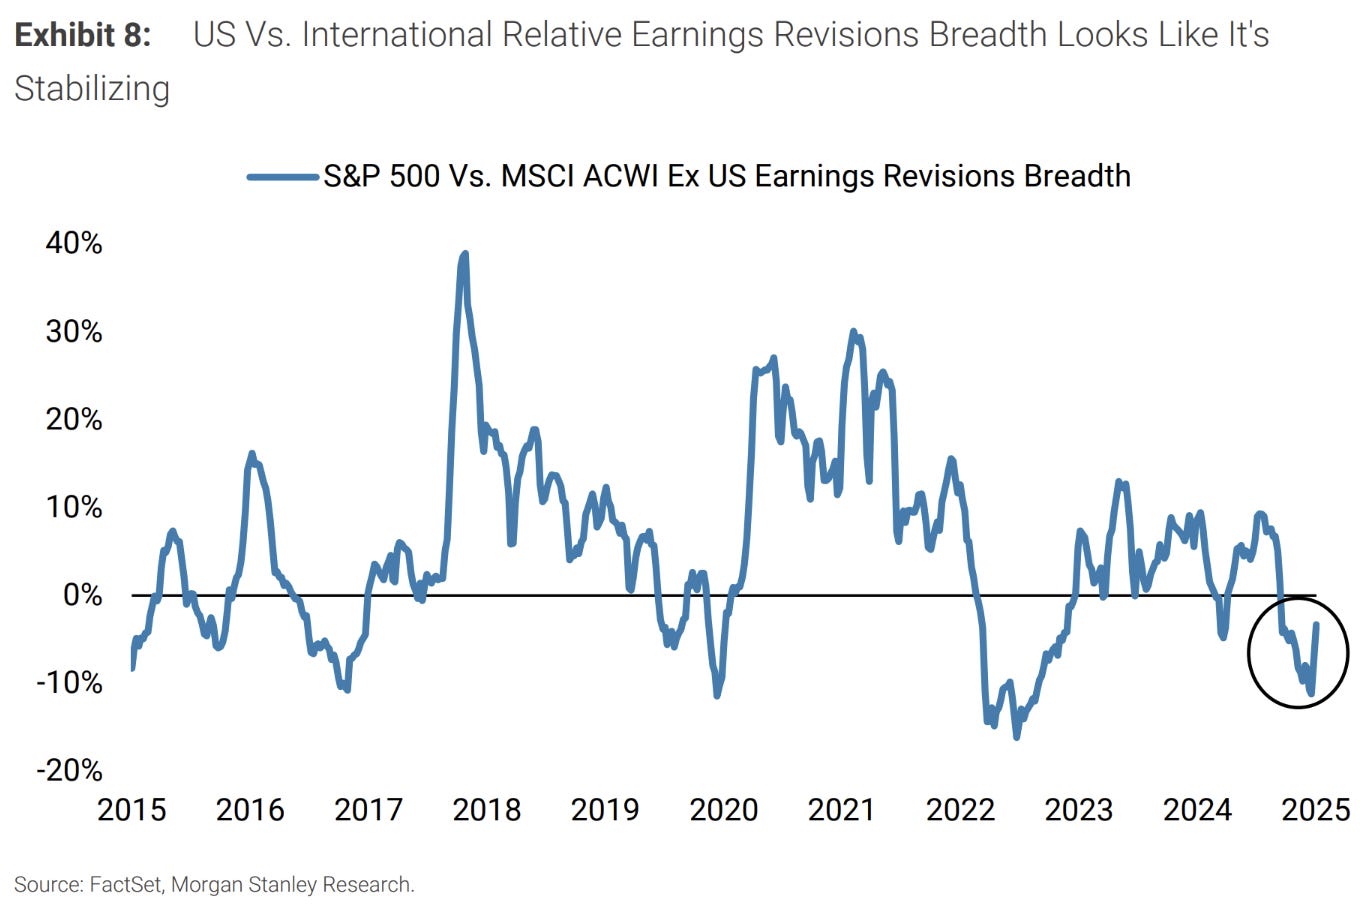
A bounce in US expectations v RoW.

Despite the bounce small caps continue to struggle.
Follow up on 0DTE
The CBOE had someone interesting charts out on 0DTE trading which I was musing on last week.
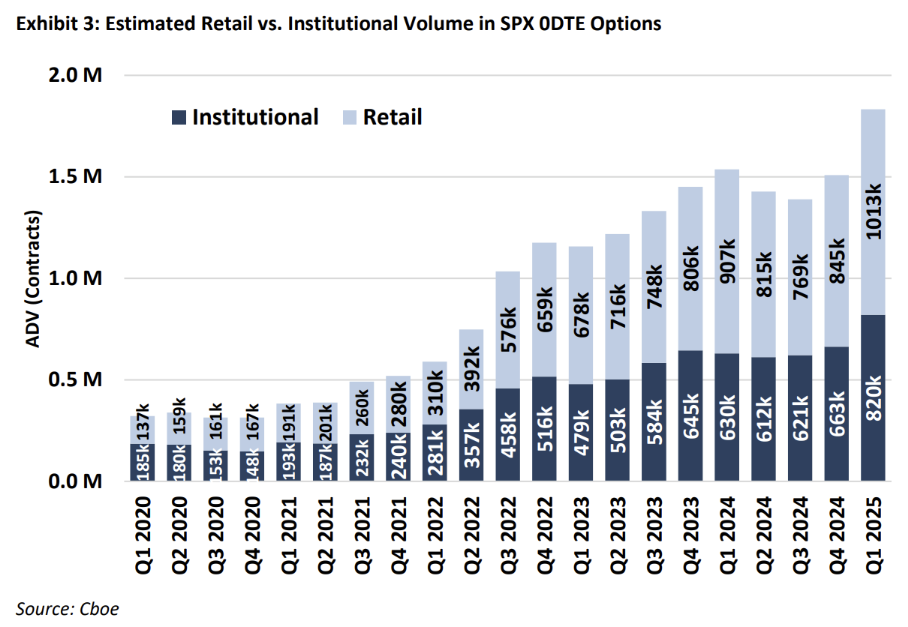
The size of retail supports last week’s charts. Makes sense the retail contingent is so big given that 0DTE could be closer to gambling than investment, but who’s to know these days?

Supporting the “gambling” aspect of 0DTE, retail is far more likely to enter and exit 0DTE trades just before the close, focussing their “investment” horizon to just a few minutes. Quite amazing.