
Charts & Notes: Credit > Government
Credit markets are adjusting to lower risk as government debt rises

Are CBs shifting?
Powell walked back some of the rhetoric surrounding possible back-to-back-to-back rate cuts this week.
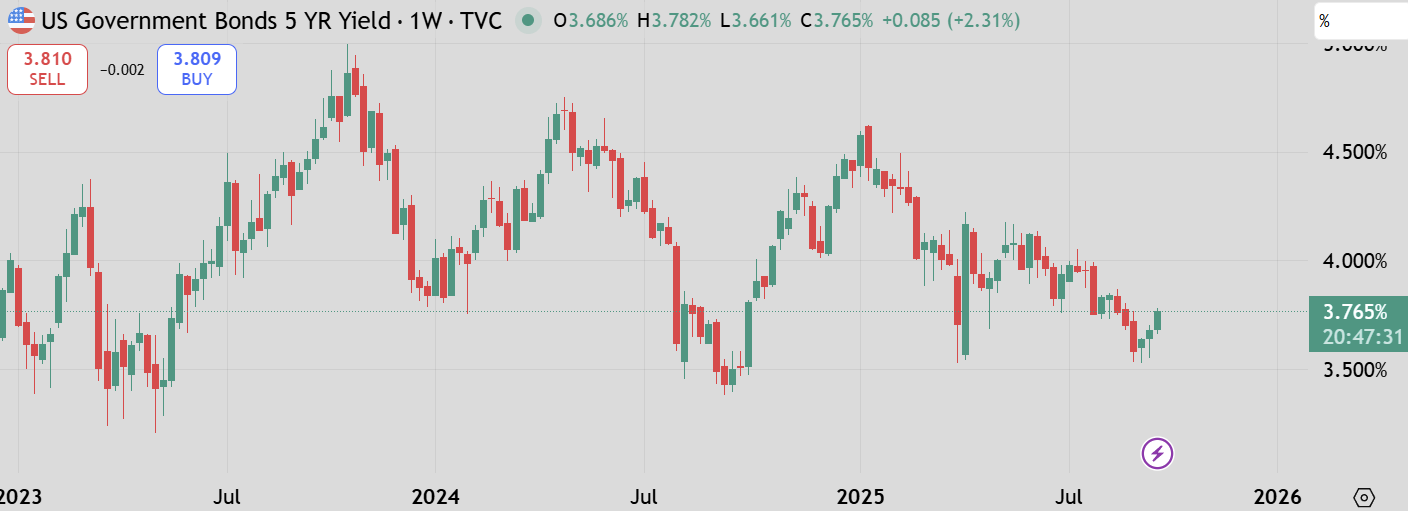
Rates have risen (as I warned last week) but are still solidly range bound.
As the Fed resumed cutting, other central banks may be tapping on the brakes.
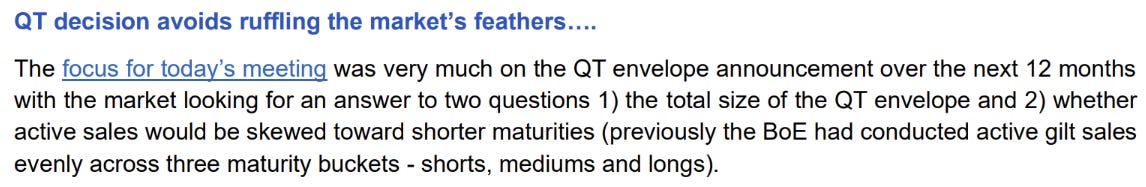
The Bank of England kept rates steady and is concentrating now on its QT programme. They are clearly worried about market blowback by talking about shortening the maturity of sales of its balance sheet assets.
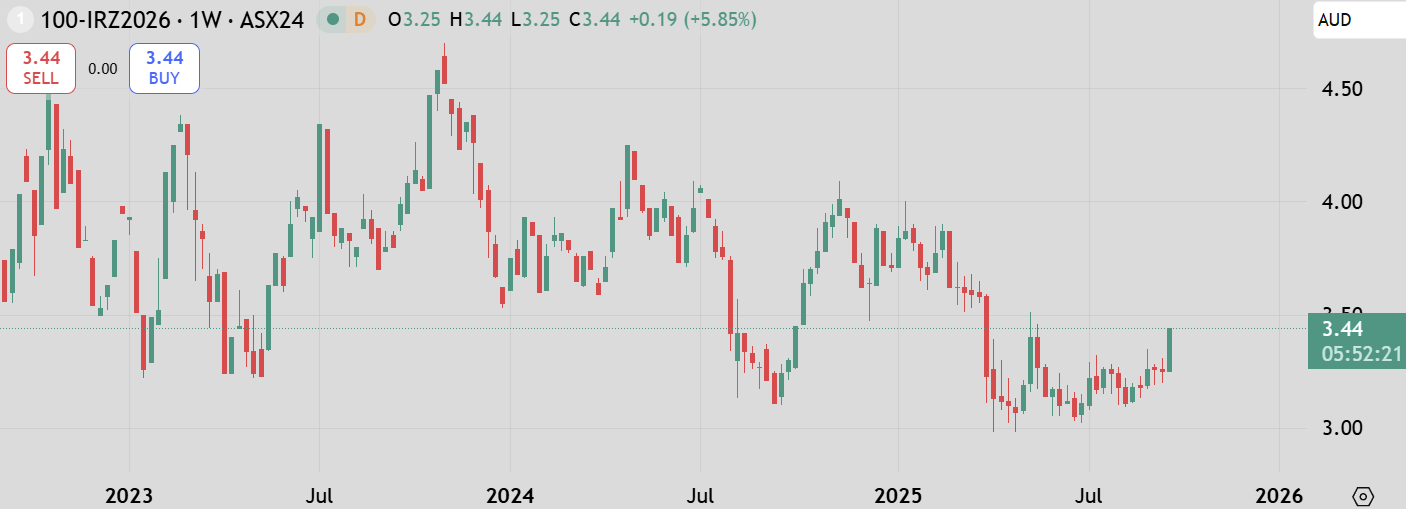
Australian monthly CPI came in hot as well along with a somewhat hawkish parliamentary testimony from the RBA governor. Rates picked up as well, with a very similar chart shape to US yields. A number of Australian banks have removed hikes for this year and early next.
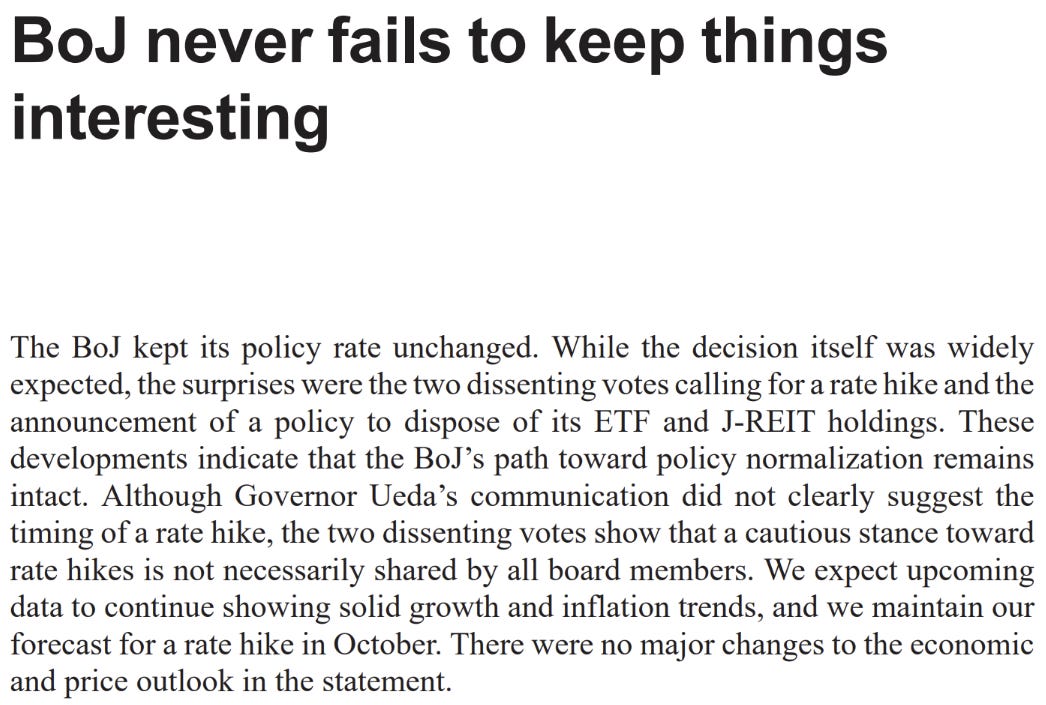
The BoJ may be switching in the other direction as they seem to be cooling on rate hikes. They surprised the market by concentrating on extraordinary tightening rather than regular old rate hikes.
They plan to sell ETFs which initially prompted an equity market reaction, but this was quickly reversed.
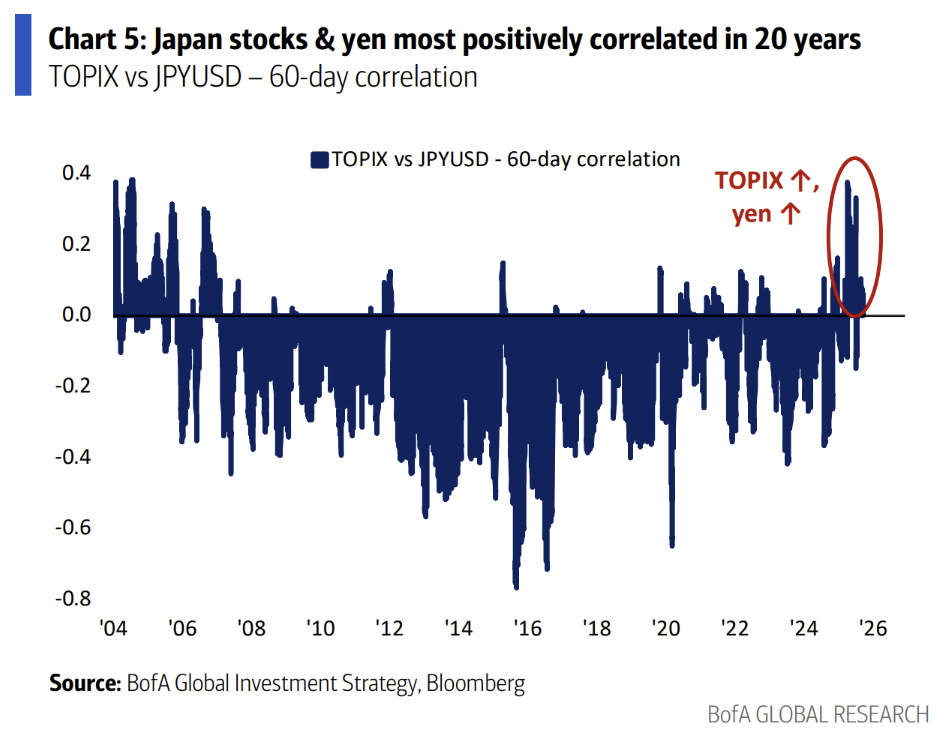
Interesting to see equity and Yen correlation reverse like it has. The market has been signalling this for years. Once upon a time the Yen would be the most reactive to equity market disturbances globally, but that has waned as global capital flows shifted, and western CBs implemented ZIRP. This saw Yen FX implied volatility since about 2018 slowly grind lower.
Some banks are seeing BoJ rate hikes ending soon. Domestic politics and a slowdown in inflation will cause a pause.
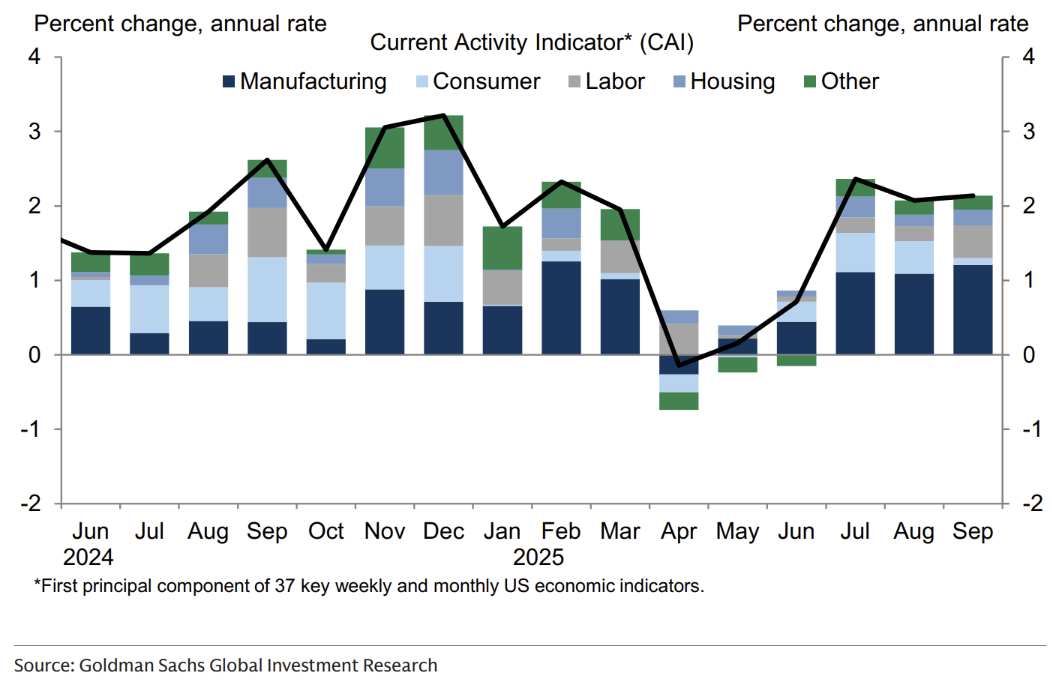
The Fed looks like it has cut into an economy with decent growth.
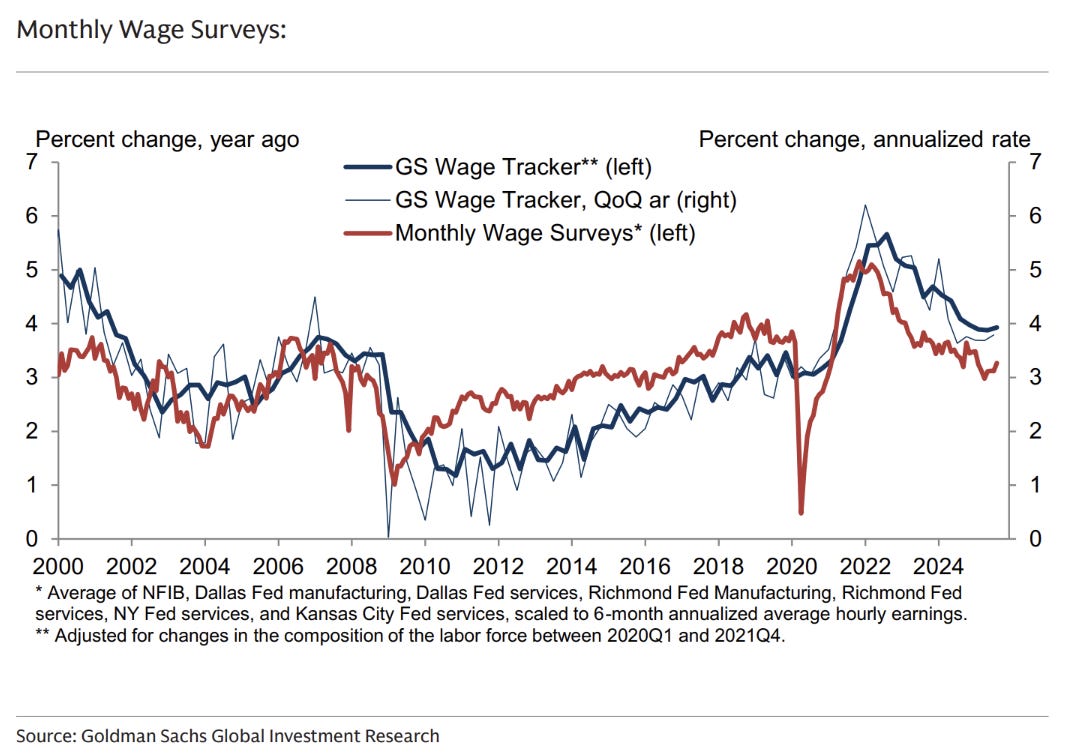
Interesting chart from Goldman’s above. Wage growth is plateauing at above the (new) target inflation rate of ~3%.
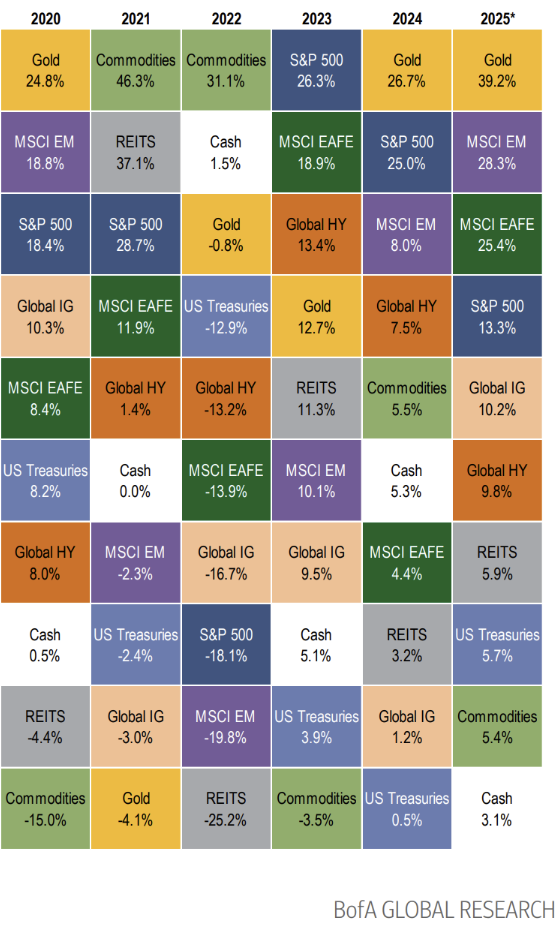
The above return quilt by BofA shows the current leaderboard for asset classes this year. Below we talk about global credit, equities and gold.
2025 has been a very volatile year. It interesting to see cash at the bottom of the pile in this context. Global investment grade credit has done incredibly well as credit spreads plumb new lows.
Global credit
A few weeks old, but I didn’t find room to fit it in previous editions of Charts & Notes.
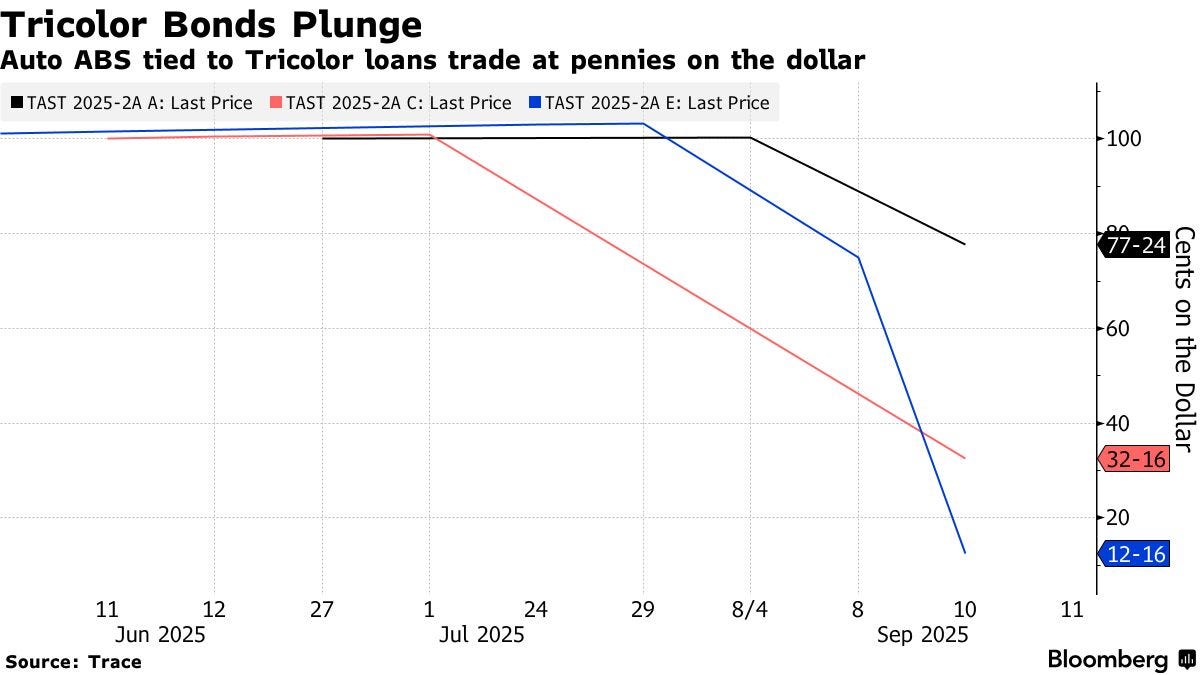
The default of ABS bonds issued by Tricolor captured the imagination of those trying to draw parallels to the GFC. From Bloomberg:
Founded in 2007, Tricolor has focused much of its business on the low-income Hispanic community in states such as Texas, California and Nevada. It previously estimated that over two-thirds of its borrowers were undocumented, based on their lack of Social Security numbers. By 2024, lending surged to about $1 billion, close to five times its volume in 2020, according to a report from Kroll Bond Rating Agency.
While the parallel of low-quality originations mirrors that of ARM from the GFC, this hasn’t spread nearly as far. Clearly the push to deport has seen many leave their car payments with the lenders.
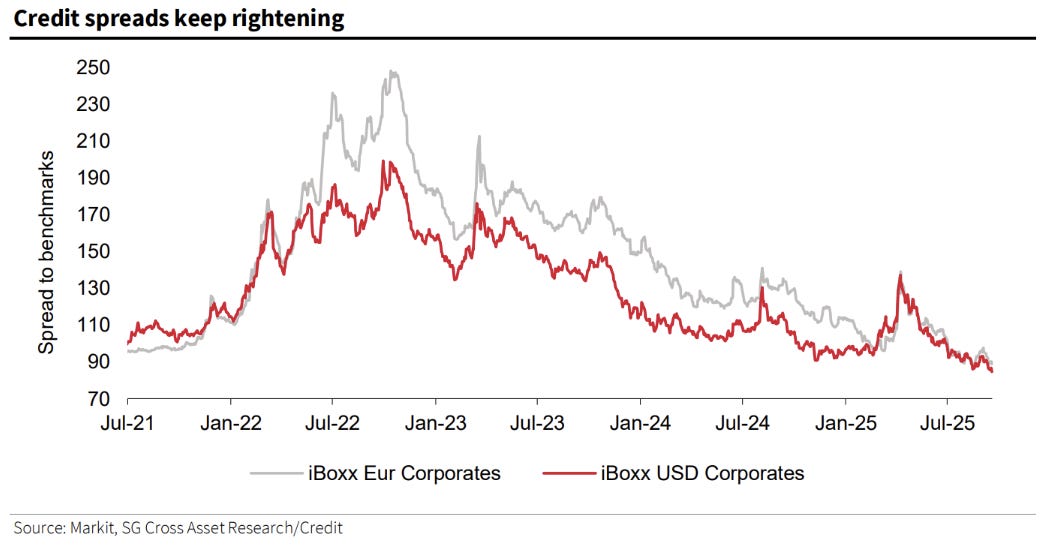
Globally, credit is unnerved.
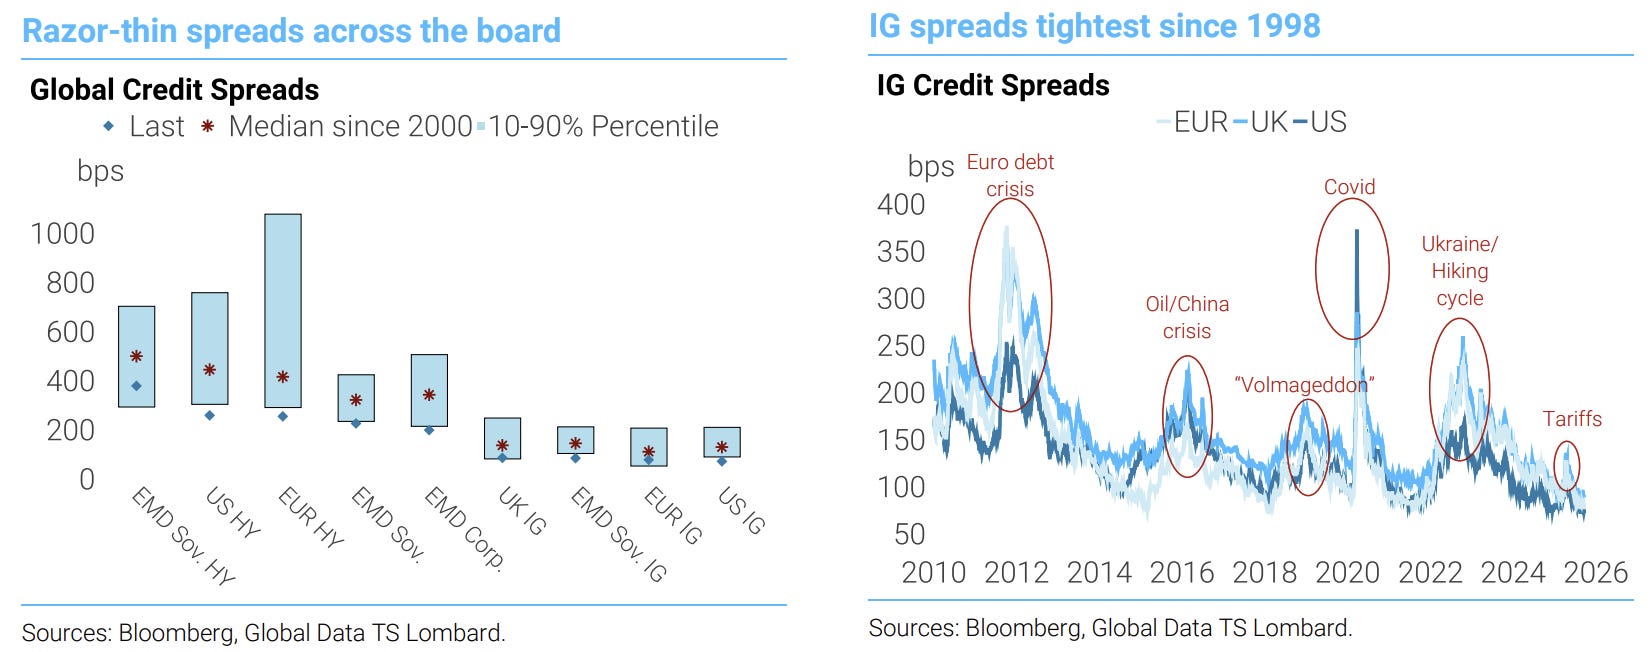
TS lombard have produced the above charts showing how tight credit spreads are, breaching levels from late last year.
US and Europe investment grade is trading similarly…
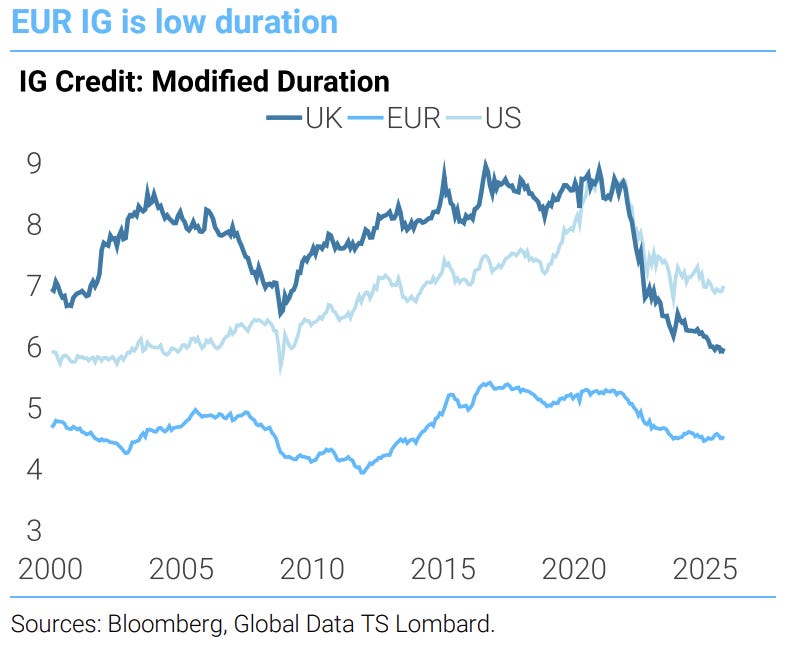
…however, and this is an important point, the duration of credit as a whole is decreasing, and as such should lead to lower yields as shorter-term credit has lower outright spreads.
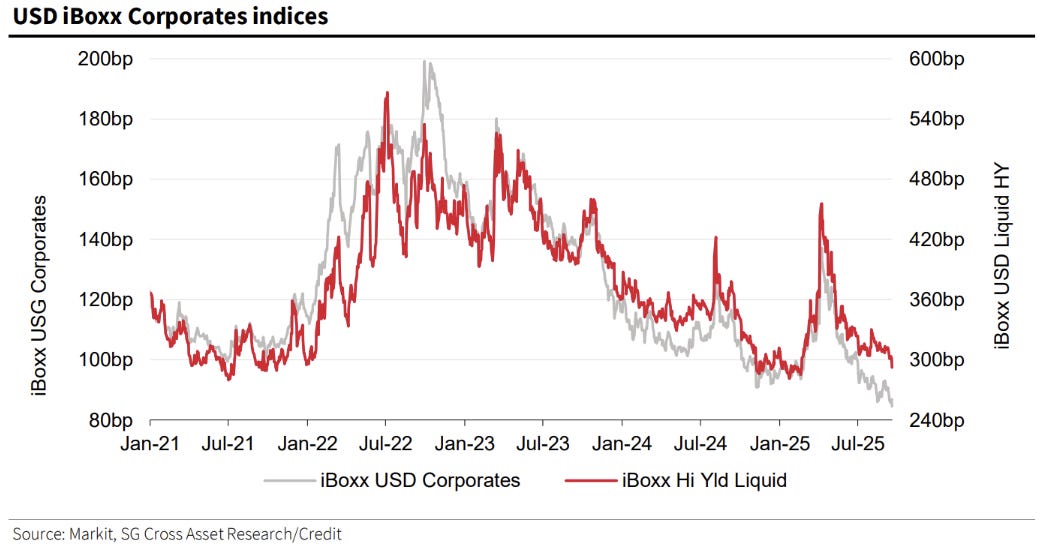
High yield credit has found a base, as opposed to investment grade which keeps on tightening.
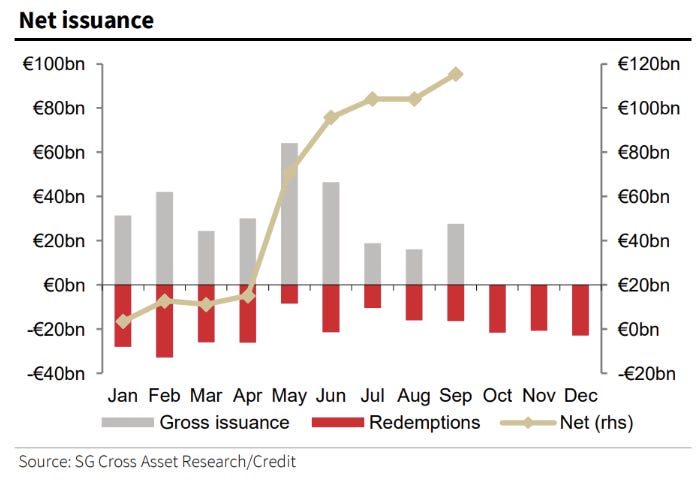
Net issuance jumped after the equity volatility earlier this year.
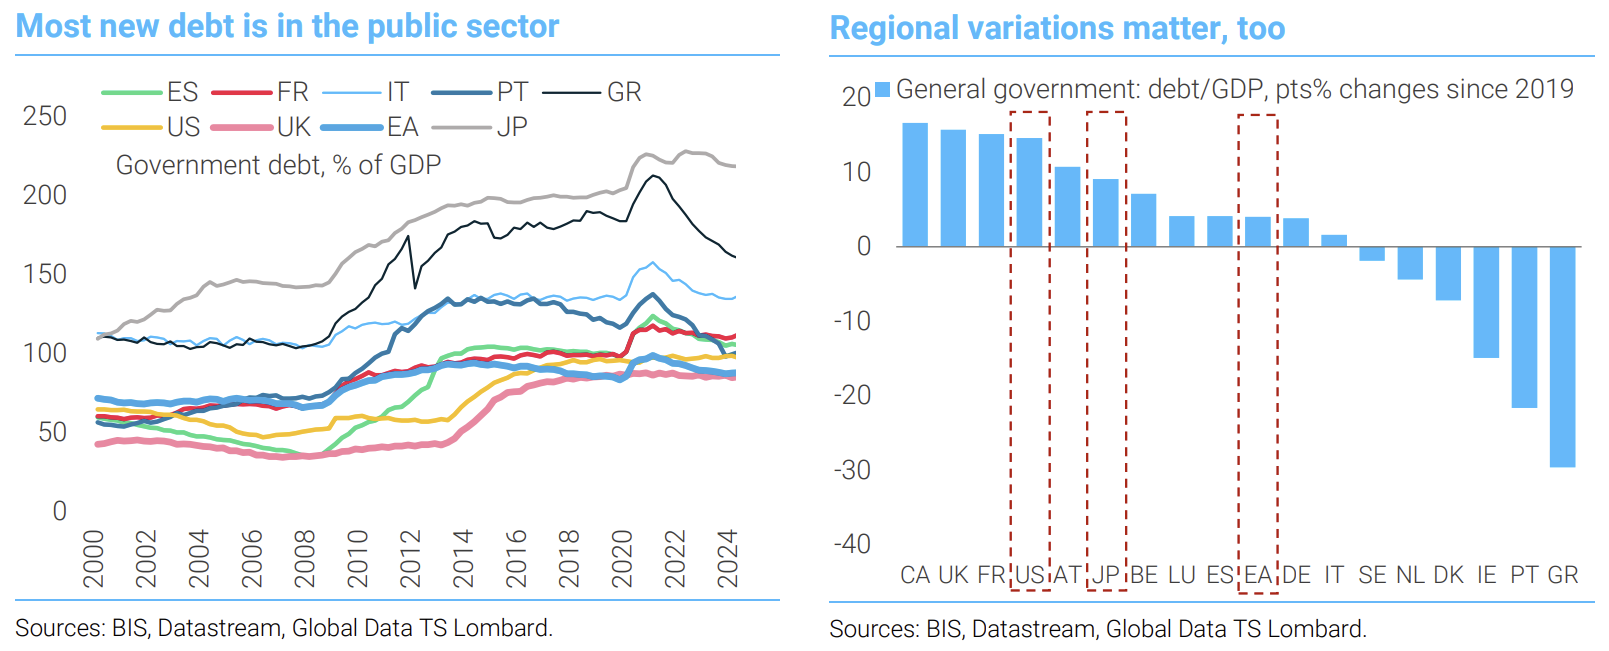
Since the real debt issuance is at the top of the economy-wide seniority pile (corporate → household → government), credit markets should benefit over government…
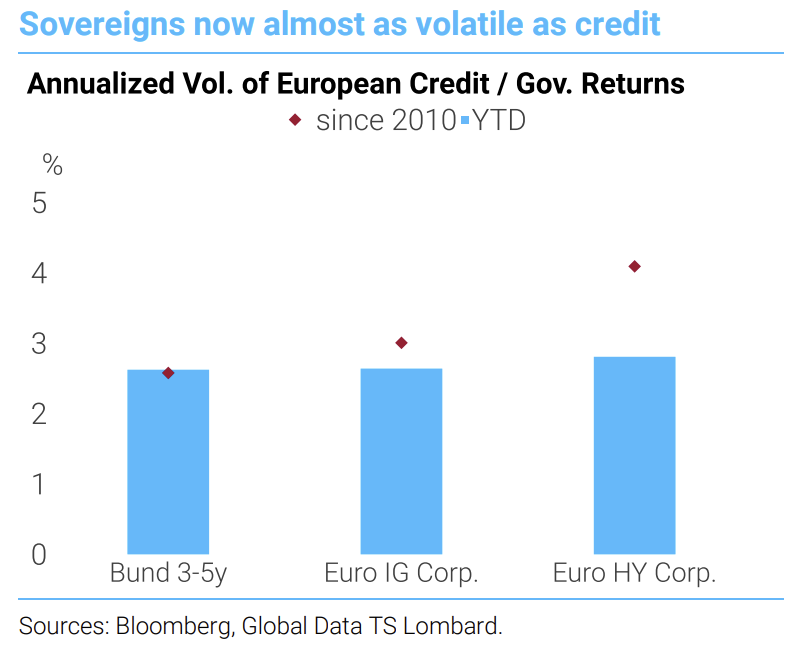
…and relative volatilities between the sectors reveals as such. Lower average duration of outstanding stock has contributed to this as well.
Equities
The slowdown in US government debt growth likely limits the S&P to a <20% rate of return for 2025 rather than the blockbuster 25% of the last 2 years.
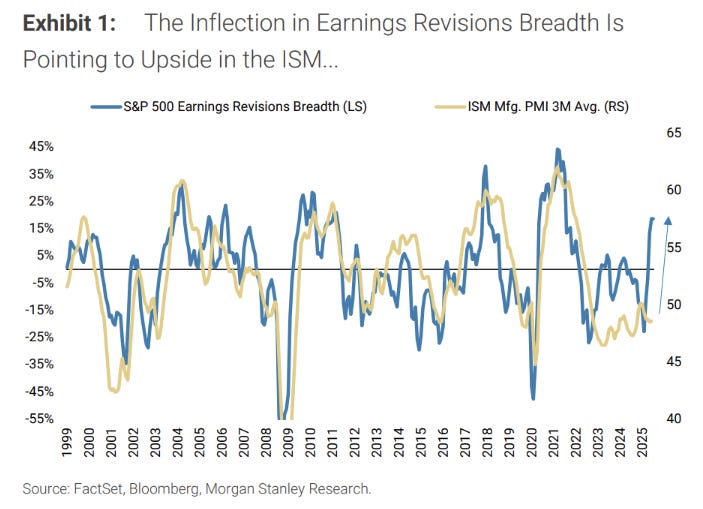
Things are looking positive though, with several indicators pointing towards an upswing in growth.
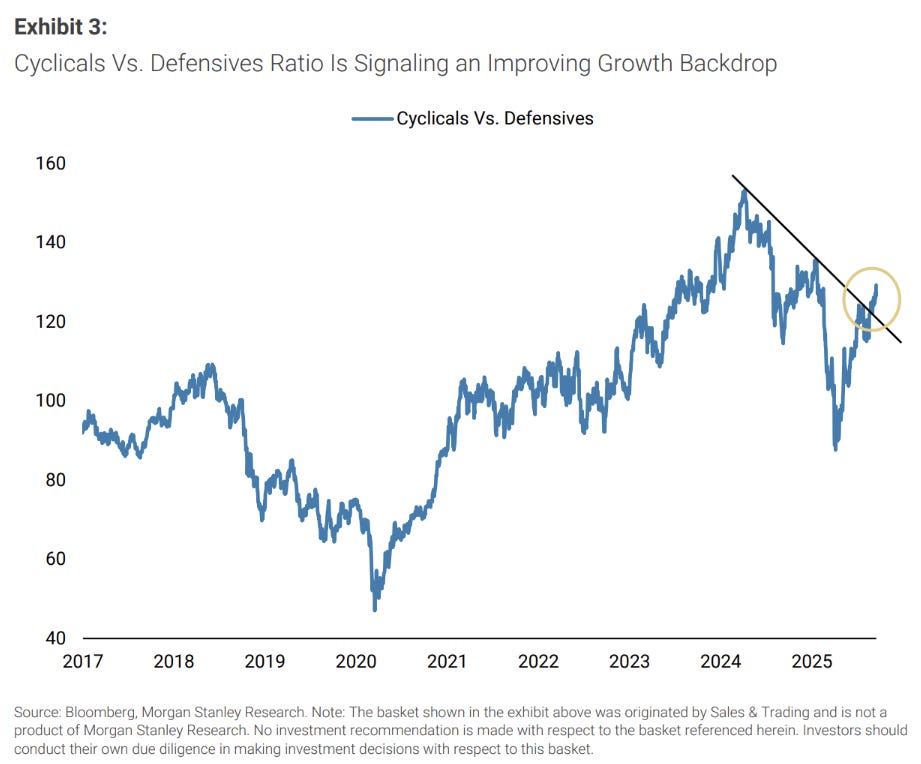
Cyclicals breakout against defensives…
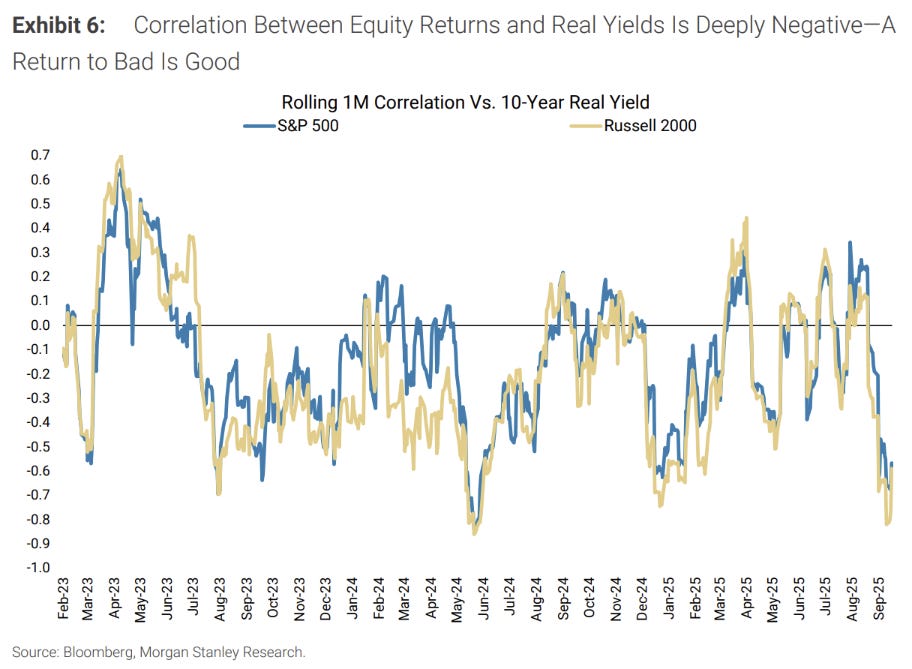
…while the correlation between equities and real yields moving to a deep negative.

Nobody likes valuation metrics, but here they are. The free cashflow yield above…

…and the barely useful Shiller PE.
Many blame this on passive investing, but a better explanation is that most of the world, in surplus with the US, is forced to own US assets. Before the GFC it was debt securities - now its US equities.
Read more below. Help me get me over 10K views for this piece!
Cross-border capital flows have shaped the world

Balance of payments data rarely moves markets on release. The level of the trade balance for countries like China matter somewhat to markets, but pale in significance to timely data about the business cycle.

If your gut is telling you there is little volatility in equities right now, you would be right.
Gold
Gold continues to be the winner on the leaderboards.
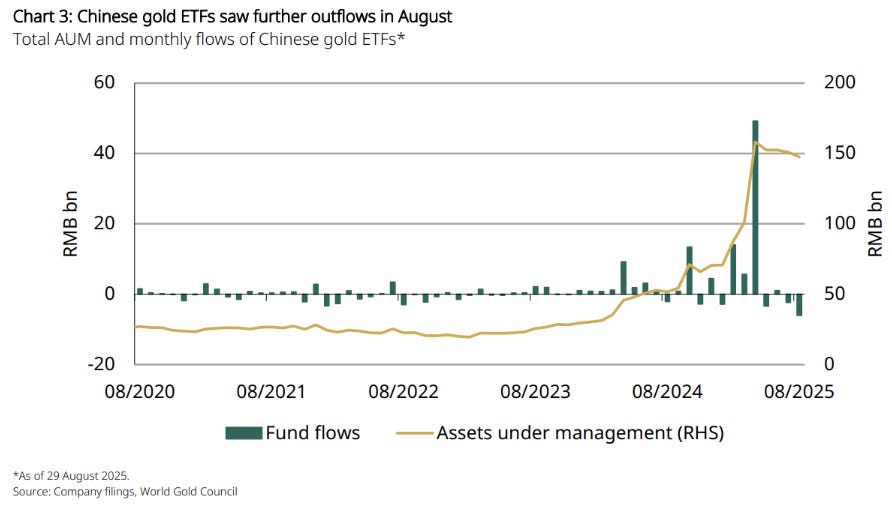
The catalyst for the flow - Chinese buying - has reversed as domestic equities are the current flavour of the month.
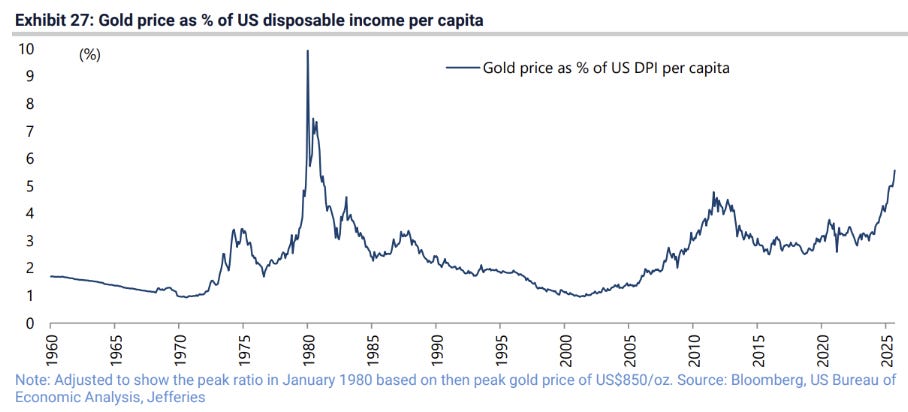
In terms of gold to US disposable income, gold has beaten its GFC fear driven peak.
Not the most useful of comparisons, but I guess it does put it into perspective.
AI & Jobs
Good thread above on the use of AI in radiology and how it hasn’t affected jobs in the sector. The problem Deena highlights is the inability for AI to produce a wholistic diagnosis, but I would argue to inability for AI to take liability for a diagnosis would be far more important.
"The problem Deena highlights is the inability for AI to produce a wholistic diagnosis, but I would argue to the inability for AI to take liability for a diagnosis would be far more important."
This is key. Using highly skilled and costly professionals is half for the skills and half for borrowing their liability insurance coverage. With AI, the user assumes the risk instead of transferring it to a 3rd party. Excellent point.