

Markets - both equities and bonds - have been in an unholy imbalance since January. I’ve written about most of those effects that have maintained the skittish trading in equities and the unjustified strength in bonds.
While analysis of the war itself is left to others, let’s look at which markets are genuinely under pressure because of the knock-on effects of the war, and which have been hit by unwinding of crowded trades and stop-outs.
First-order effects are surprising. The Strait of Hormuz, Iran’s greatest gambling chip, is effectively closed and WTI is still below $80/bbl.
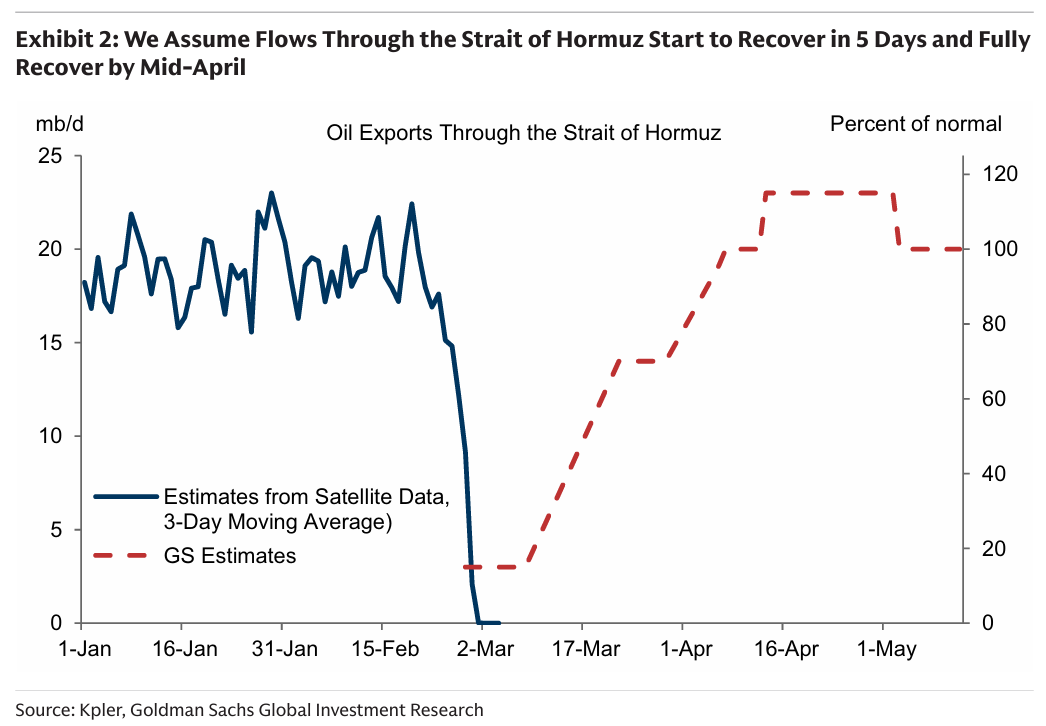
Maintaining prices at these levels relies on a resumption of shipping as pointed out in the GS chart above. They see Brent moving to $100 if the Strait remains closed to traffic for much longer than a week.
To make it clear I have no idea how they can forecast this outcome, and many online seem to have the same impression this piece of “research”. Perhaps they expect the US’ novel offer of insurance and escort for vessels to unclog the artery, but there are a lot of questions around this plan.
In the defence of Goldman, closing the Strait for an extended period of time is not without cost to Iran, either. And it doesn’t directly hurt the US; in fact it hurts the rest of the world a lot more.
The data in the chart reveals the largest drop in traffic in the Strait, ever. No denying this. Pre-conflict, roughly 6 LNG cargoes transited Hormuz daily and reports now suggest flows have collapsed to zero.
The interruption to shipping is also showing in delivered prices (affected by extreme backwardation) as well which are added above the prices you see on your screens.

Crude delivered to China is already close to $100/bbl.
This is the story in oil. Gas is the more immediate worry.
Europe
Europe has some real exposure here but hasn’t moved as much as you would have expected it to, given their reliance on Qatari gas.
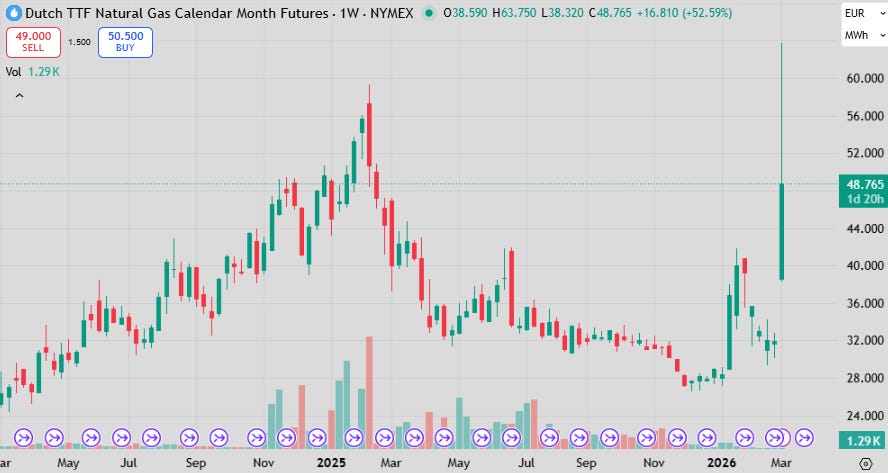
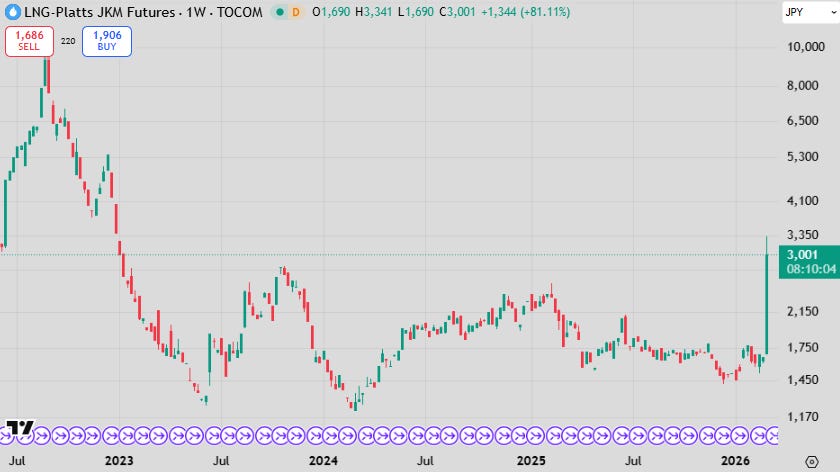
Europe-traded LNG doubled on the start of operations but have subsided since. Still, pricing is below highs set during a cold snap in Europe over Christmas. Qatar initiated a force majeure on 20% of world supply of LNG, affecting its customers in Europe and Asia.
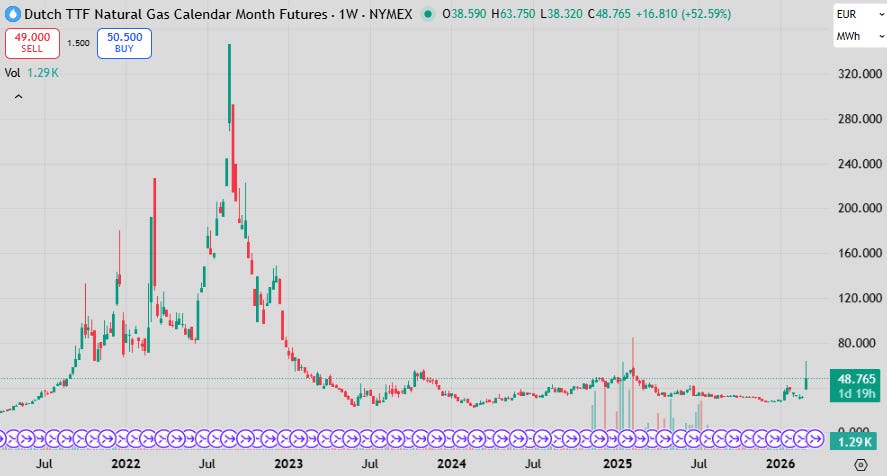
Comparing it to prices over the Russia-Ukraine war, well…
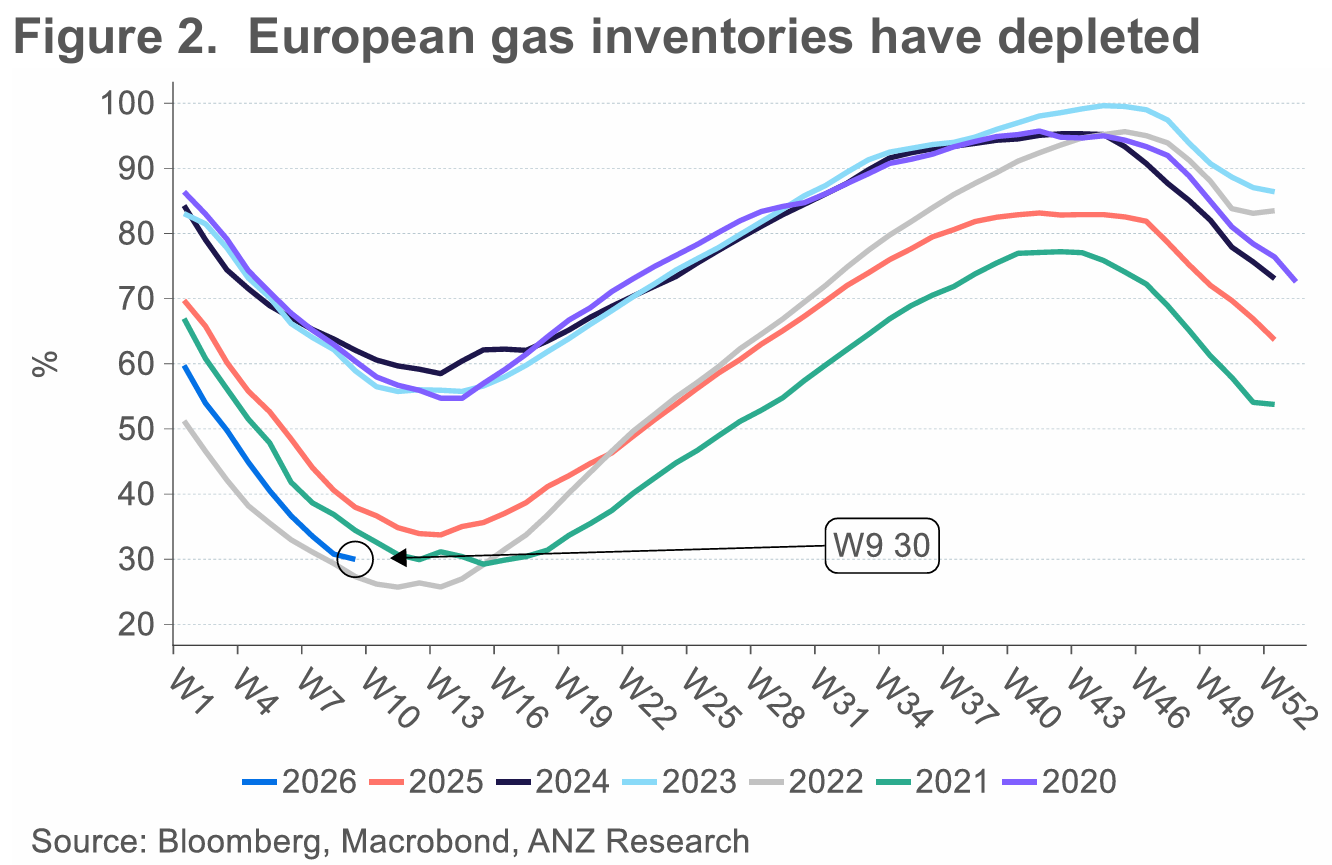
Inventories are lower than normal which has heightened the sensitivity to supply disruptions. Luckily this war didn’t start in December last year.
Most banks are cutting Euro GDP forecasts and bumping up inflation forecasts by about 0.2% down and up respectively. This puts a brake on the growth upside that has recently been priced.
Equities took it personally.
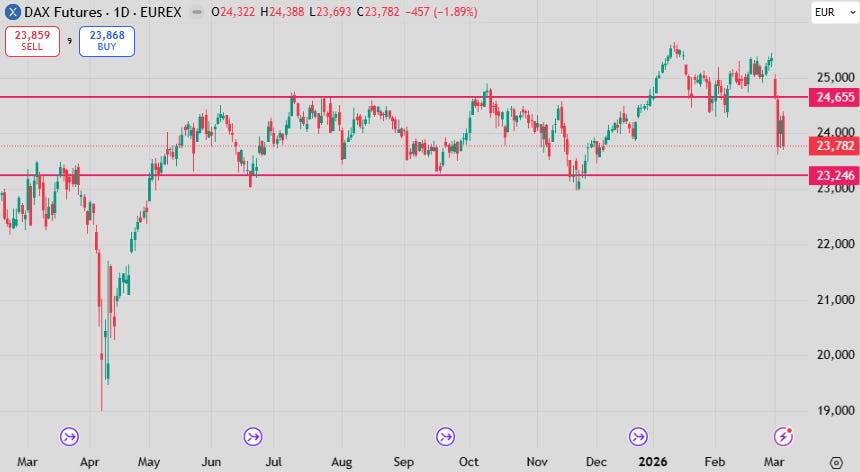
The DAX is back in the range set since last April’s drawdown, rejecting the breakout set in January this year and falling more than 6% at its worst. Rotation out of the US has been a popular theme again, but economic reality of Europe’s place in the world and vulnerability to trade (through its large current account surplus) and energy disruptions (it has no energy).
The DAX awaits deliverance of the promised fiscal spend which at this point seems like it was priced to perfection all the way back in May of last year.
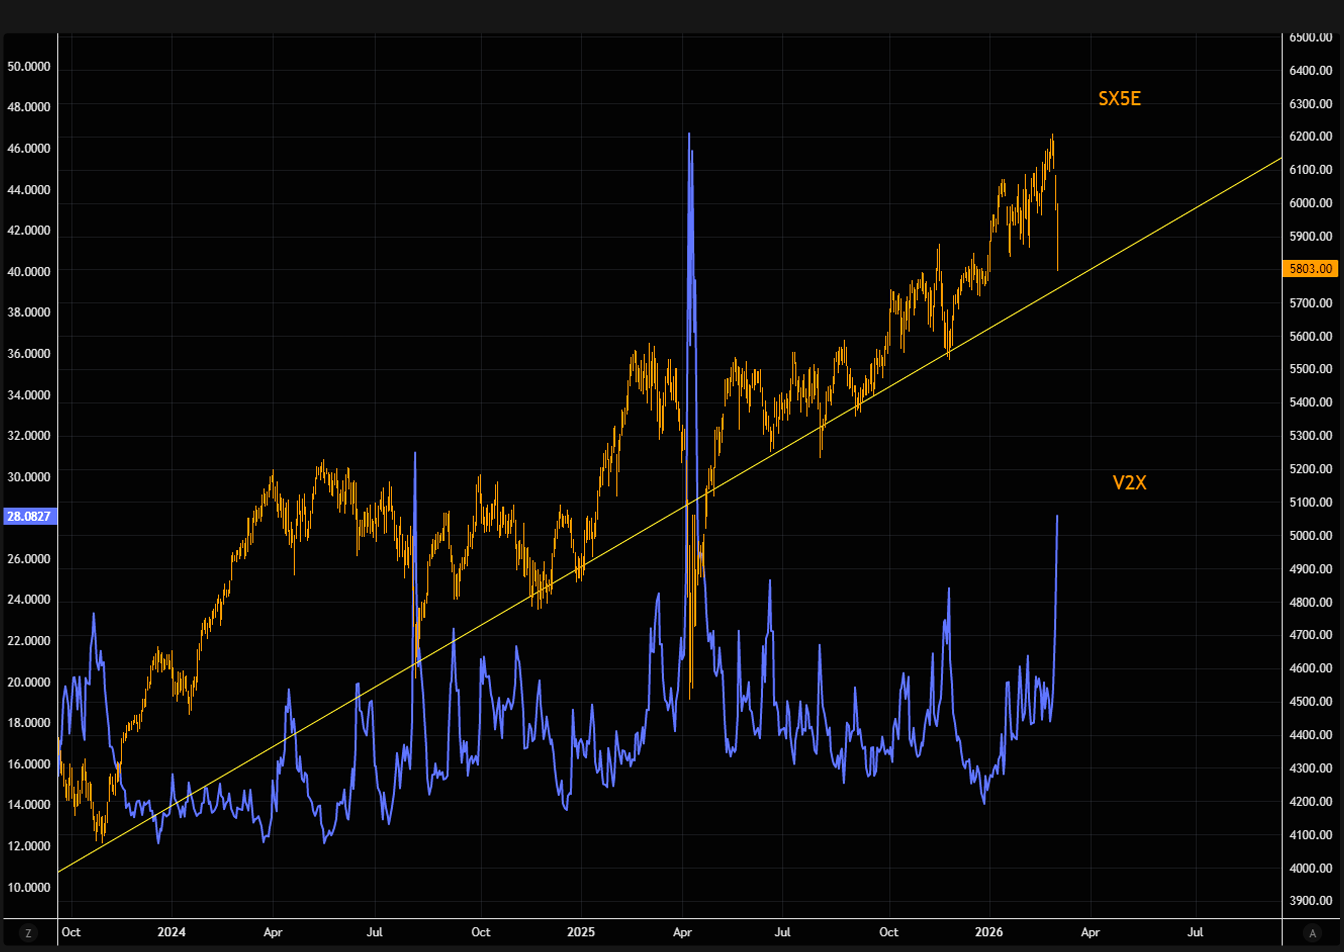
The more tech-heavy Eurostoxx was hit a little harder and resulted in a breakout in of vol indicators, something we are yet to see in the US.
This hit to both Europe (and Asia covered next) caused a violent run back to the USD.
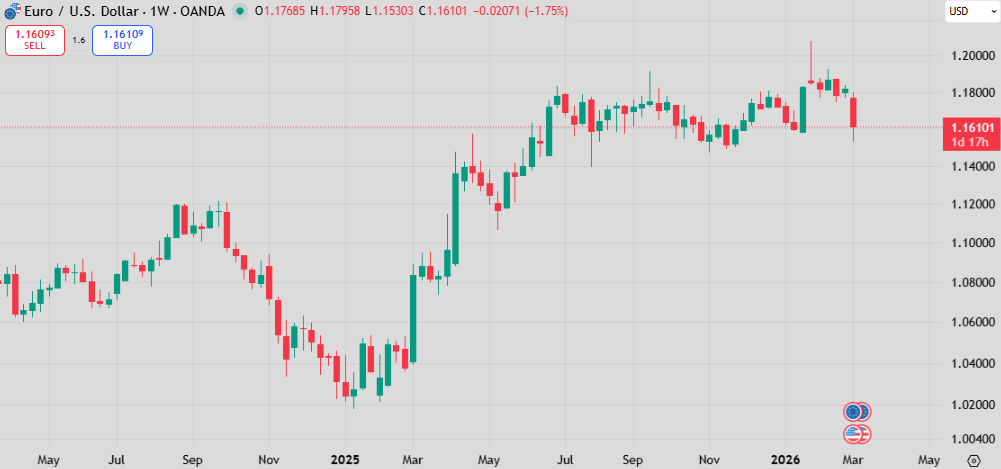
The EUR fell nearly 2%, but this only puts the cross back to where it was before the Greenland story came to light in January. The USD is still weak relative to fundamentals.
Asia
60%-70% of Asia’s LNGs needs are served by the Qataris, so the effect there could be worse than for Europe.
Asia LNG benchmarks have doubled in a comparably worse move to what happened in Europe.
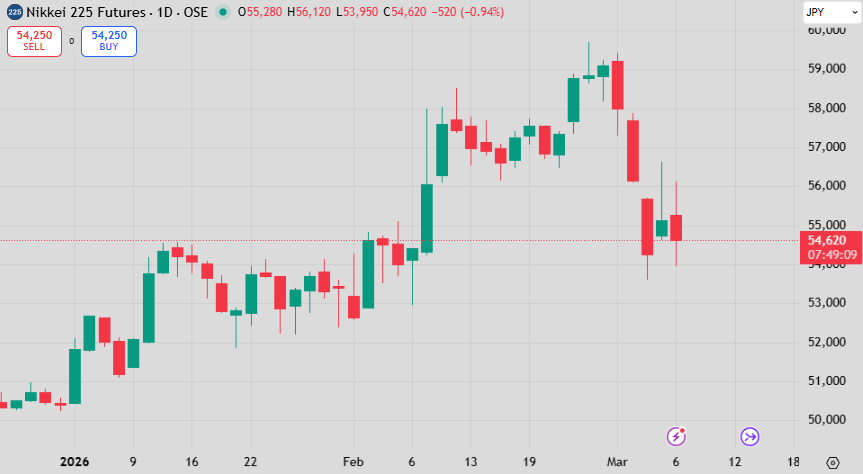
Japan is the most exposed to the disruption in LNG flows. The Nikkei fell >9% from last Friday and is experiencing intraday of more than 3%. In the context of how it has traded more recently these sorts of moves aren’t uncommon, and the index is still up well over the year.
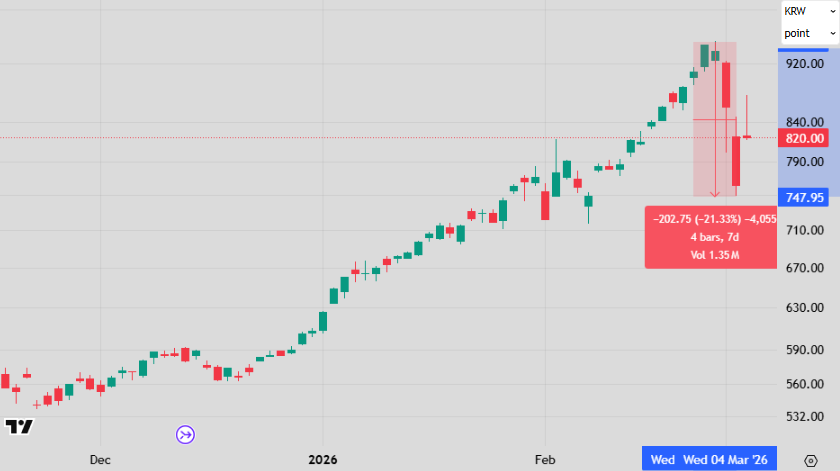
The KOSPI captured the imagination of the market for the first few days of the week. Falling 20% and recovering half, it is worth remembering that the index is also still up a lazy 35% this year. I think we can chalk this up under “market clearing” rather than anything related to energy.
The bigger issue might be if Goldman’s are wrong as the Strait doesn’t open up anytime soon what the replacement will be for crude oil imported into Asia. Nearly everyone is exposed here, with most countries having 4 to 6 months of reserves (China being the outlier here with much more in strategic reserves, but more exposed through effectively being Iran’s only real customer).
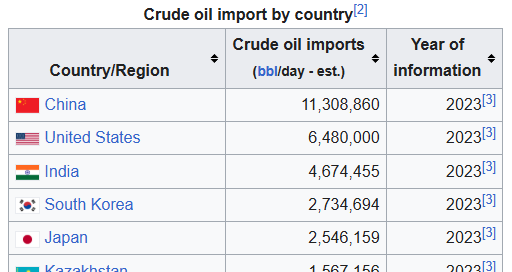
Asia tops the list for biggest importers in the world.

If these reserves decline, there is little to cushion the blow, and this sensitivity will surely affect US decision making on which way the war goes. But this also means Iran’s supposed friends won’t be there anymore (if they ever really were).
Bonds
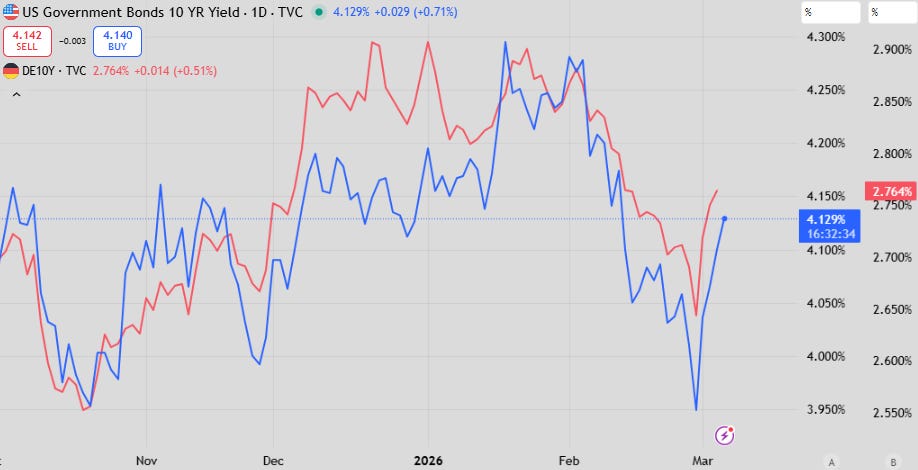
Bond yields are back to mid-range. Some like to attribute this to rising inflation forecasts because of oil disruptions, but I would like to think of this more as a market clearing event as well. Bonds got far too ahead of themselves.
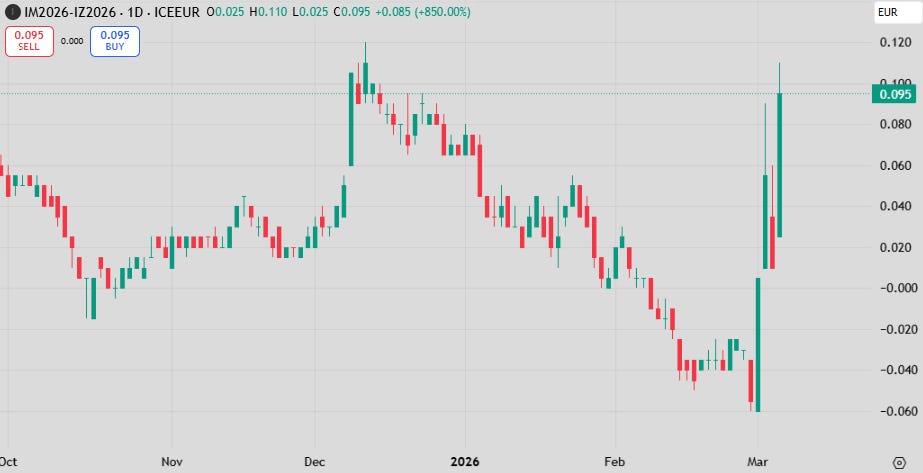
The short end felt this as well as the curve experienced a parallel shift higher. ECB pricing went back to pricing hikes in 2026 (above) after spending 3 months grinding out a new cutting path for the ECB. Once again this was greatly affected by one-way positioning.
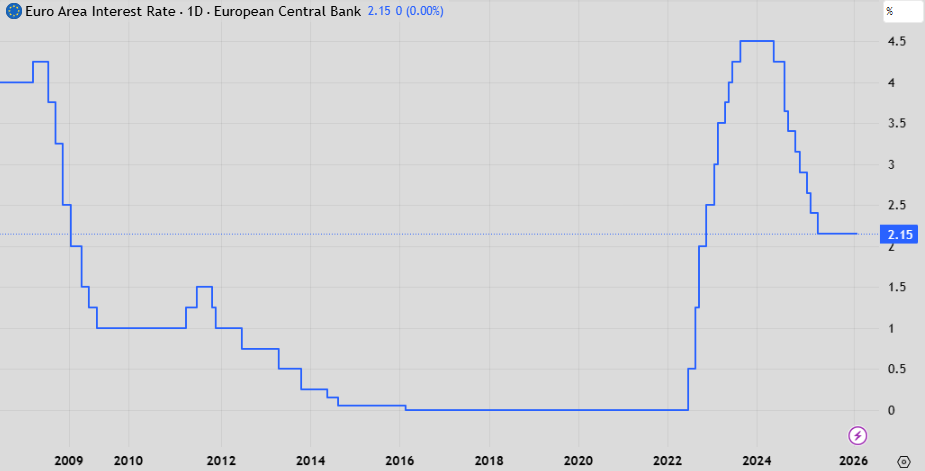
The ECB did deliver hikes into the Russia-Ukraine war (being a very inflation sensitive central bank) but the global environment was very different at the time. In the worst case here the effect on growth would likely be larger than that to inflation.
The comparison between rising USD and falling bonds is out of line with history. The flight to safety big would usually be across both assets but moves like this as the first reaction (bonds did have a very short-lived rally on Sunday night) highlights how bonds have abandoned their role of the 2010s.
Japanese yields didn’t rise, but they hardly fell either. It’s a different world.
Equities
Amidst all of this, software actually managed to rally!
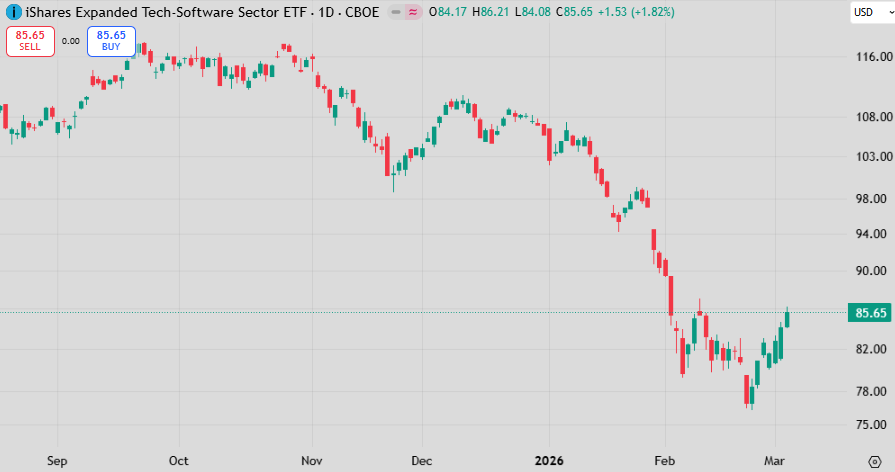
More closing of shorts (market clearing) probably is responsible, along with Block’s decision to fire a whole firm’s worth of people.
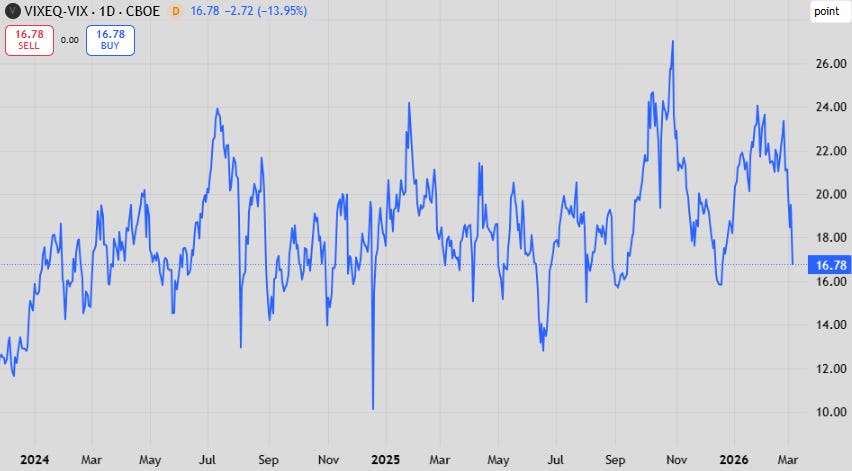
The spread between S&P500 constituent and index volatility fell as well, despite the index being immune from the falls seen in Europe and Japan. It was the start to the Iran war that fixed this imbalance.
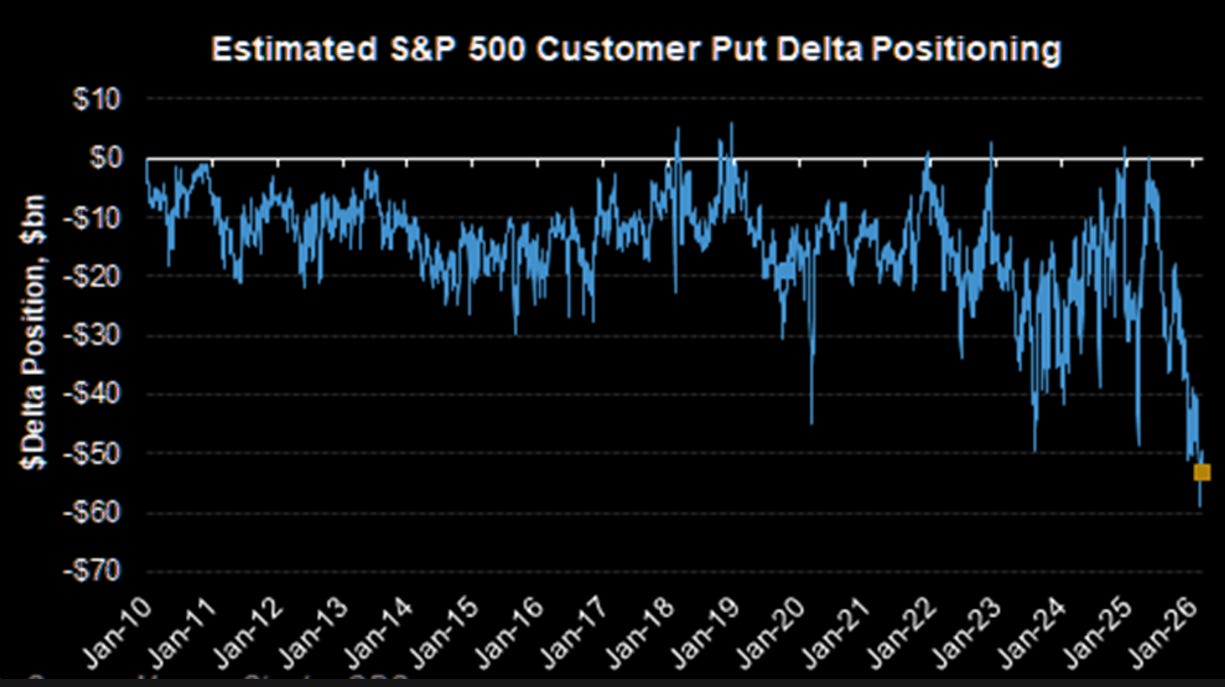
Taking positioning data for what it is, it doesn’t seem like anyone is going to be caught without hedges on. The skew is so extreme for a reason, and while I don’t love positioning data, it does explain the pricing we’ve seen in traded volatility markets.
The US has outperformed nearly all other DM. This might be related to heavy downside positioning, but also to the fact that the US is largely energy independent.

Hopefully I don’t regret posting a BCA chart but here I go. Their analysis above indicates that the US has been the price setter for world oil for a while through effectively being the marginal producer. This is a powerful position in itself.
The uncertainty of war
I’ve outlined some of the bearish outcomes above. Obviously, this is the focus of the market, and the market will trade lockstep with WTI crude futures.
There is also a bullish case. The regime is overthrown and Iran’s production floods the world market once again. This seems impossible given how Middle East wars have gone over the last few decades but is always a possibility. Iran is also a different country though.
If there’s one interesting thing to come from this conflict, it’s that Qatar seems to have finally picked a side. Iran’s strategy to fire on their Gulf neighbours to put pressure on the US to end the conflict has clearly failed.
Great piece, Mr. Farac.
Thank you!
Thank you, your clear, precise views are refreshing every time!