

“When forecasting doom goes wrong” is my new long-form newsletter about the folly of forecasting through the lens of the call on oil prices for March & April.
When forecasting doom goes wrong

If Donald Trump and Scott Bessent were President and Treasury Secretary in 2008, would Lehman Brothers CDS have ever traded over 150bp?
There is a lot more to this than most who just say “China”. Behavioural aspects are extremely important as are the limits of knowledge around systems that are as large as the global oil market.
Northern hemisphere summertime and a World Cup may explain the realised vol crush in equities.
This week’s US CPI this week which has all but invalidated the end of month FOMC meeting as a risk on the horizon wasn’t really something the bond market took much notice of, staying in a bear market and barely lower in yield form the highs we saw pre-CPI.
This is just one of the clues that the low confidence trading in equities outside of single stock vol or what looks like semiconductor stocks finally entering correction territory. The S&P500 is holding gains even with the NASDAQ down over the month which should be a good thing…but it feels anything but. It is OPEX week and Friday is a large expiry which is pinning the index in the 7500 to 7600 range.
By printing such low realised vol, implieds have followed. Momentum has stumbled and the setup is there for put buying. There seems to be no consistent themes driving anything.
Even the Yen has been quiet, pausing its constant devaluation (that’s just what it does now) with far smaller intervention drops than we’ve seen previously.
The only bullish market I follow has been the Hang Seng which is perpendicular to recent Chinese data which is worse than what most thought. However, this is a good news story for the oil market which will be supported by Chinese absence for longer.
The negative CPI and bonds
US CPI on Tuesday printed negative at the headline level and zero at the core level (versus expectations of +0.2%) which was followed by a slightly softer PPI on Wednesday.
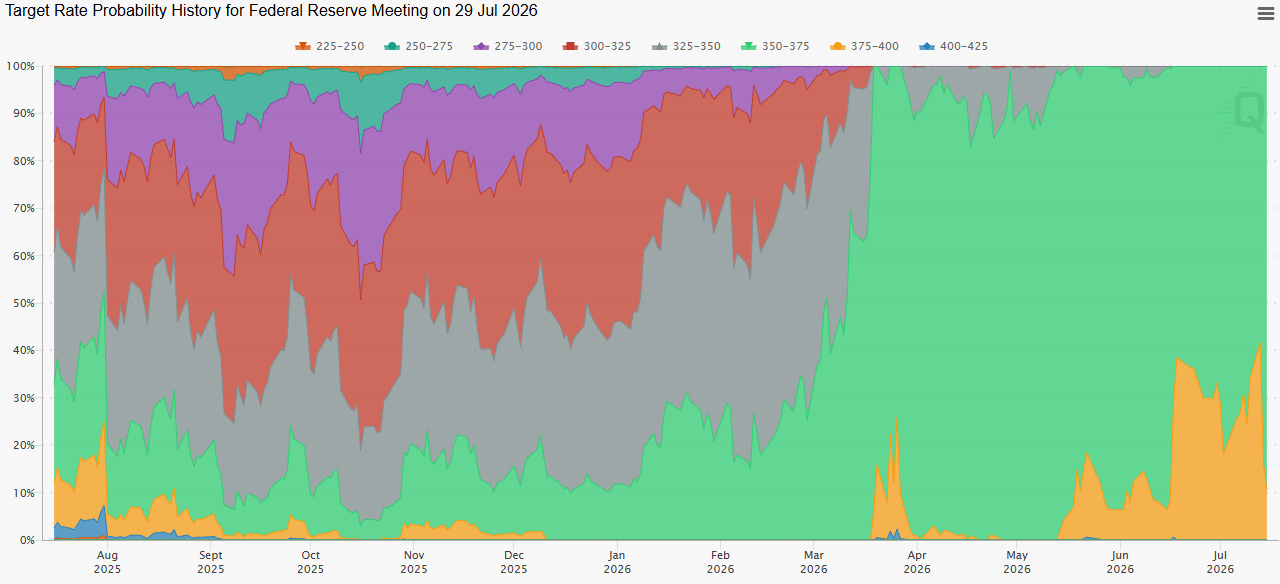
The move in the front-end was around 12bp, which moved the chance of a hike from around 50% to 10% for the July meeting. September remains a live meeting, with roughly a 45% chance of hike priced.
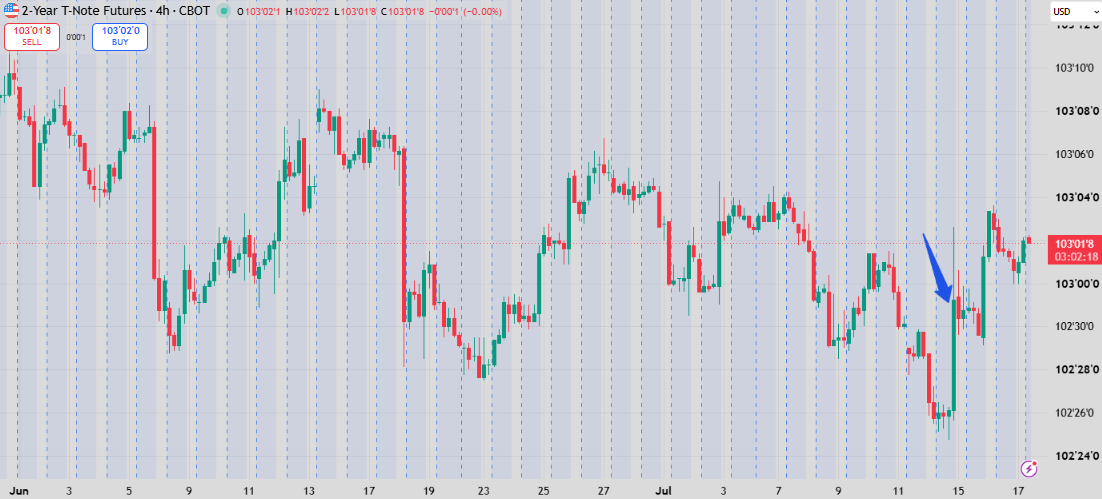
The headline shock of a negative CPI was clearly more meaningful than the market shock.
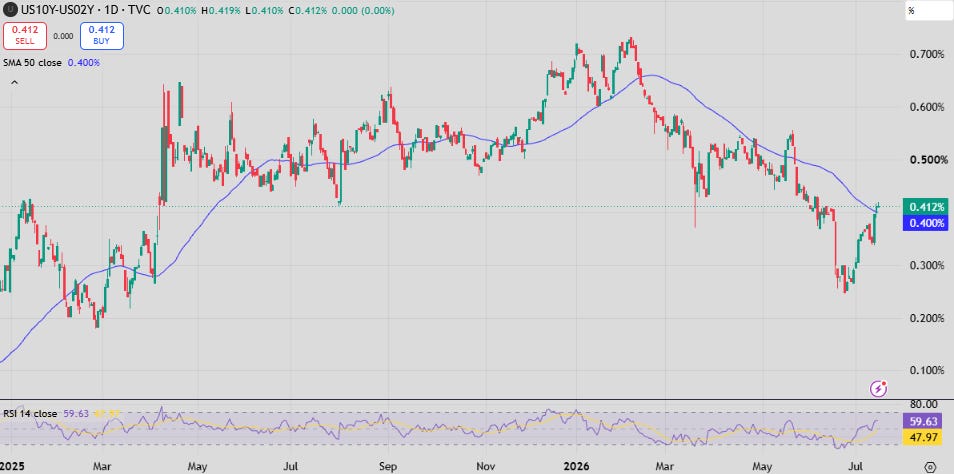
2-year futures moved around the same but didn’t rally enough to break the uptrend in yields which started just before war broke out. The 2y-10y curve steepened back up above where it did when the famous MoU was signed.
Of course, a steepening curve means that the longer end of the curve didn’t decide to follow the lower short-term track for rates.
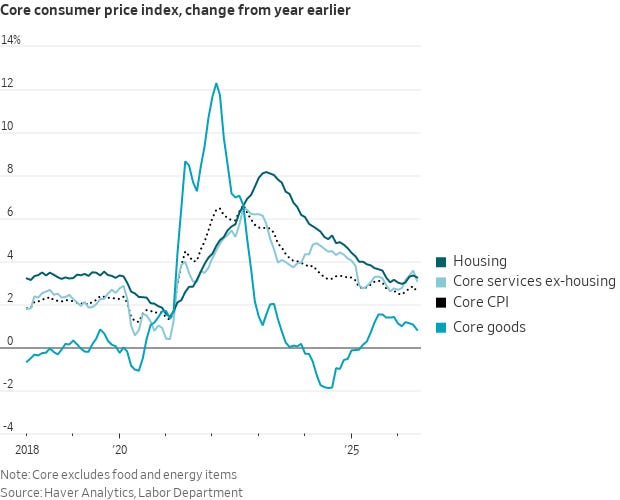
Why? Despite inflation being a broad-based weak number as core goods and housing costs dragged, it was energy and Hormuz that still has the long end fixated.
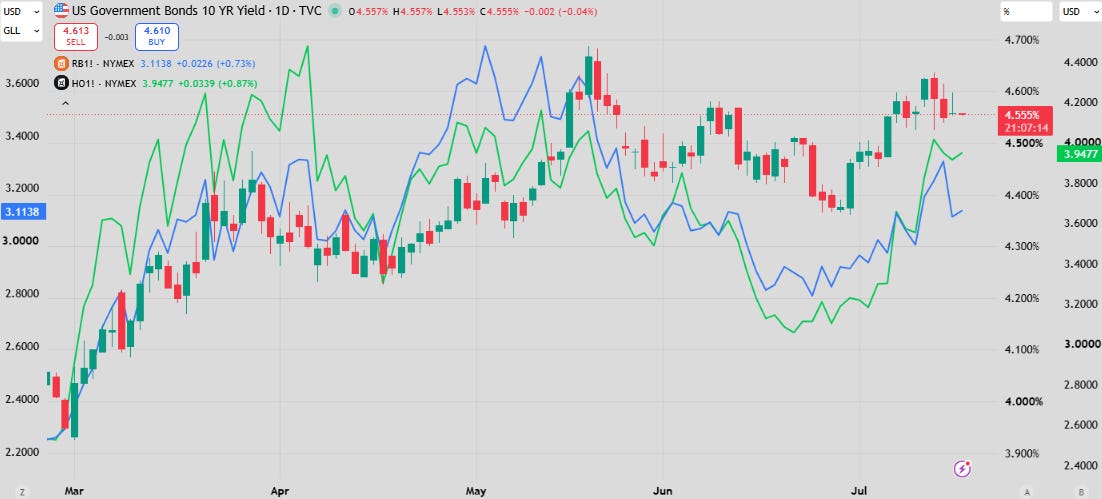
The chart above tracks the US 10y yield against Gasoline and Diesel futures. While crude oil prices came down, product pricing still strengthened and the drop of the MoU and ceasefire has only seen that accelerate.
In fact, the exact bottom in gas prices was on the survey date for June CPI, and they have almost fully reversed at this point.
The summary is that evidence of core disinflation is dwarfed by tightness in product markets globally with US still exporting, Russia ending exports after Ukrainian attacks on refinery infrastructure, and a Chinese production a question mark.
The bond market is reflective of these risks which equities (on the surface) seem to be ignorant of.
Correlations once again, sorry
The VIX at 16 is hiding some serious volatility under the hood, mostly driven by wild swings in tech.
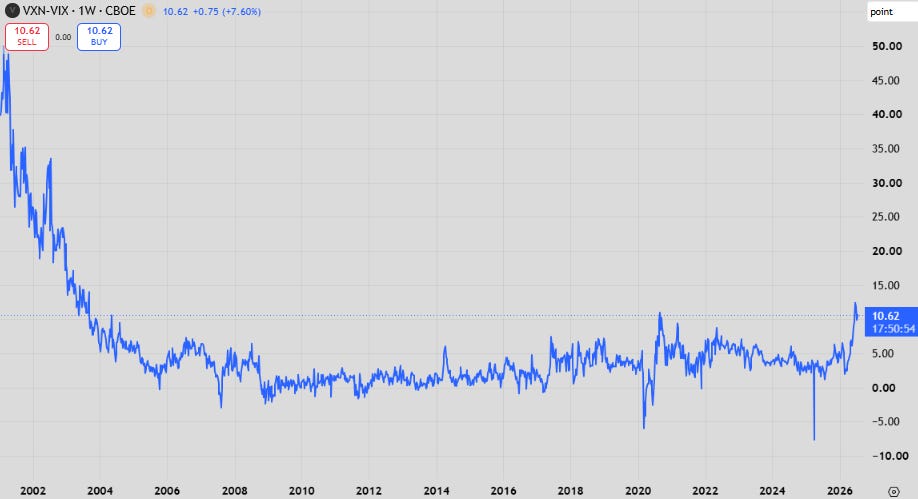
Headline NASDAQ vol (VXN) is as elevated as it has ever been over the VIX (S&P500 volatility index) since dot-com!
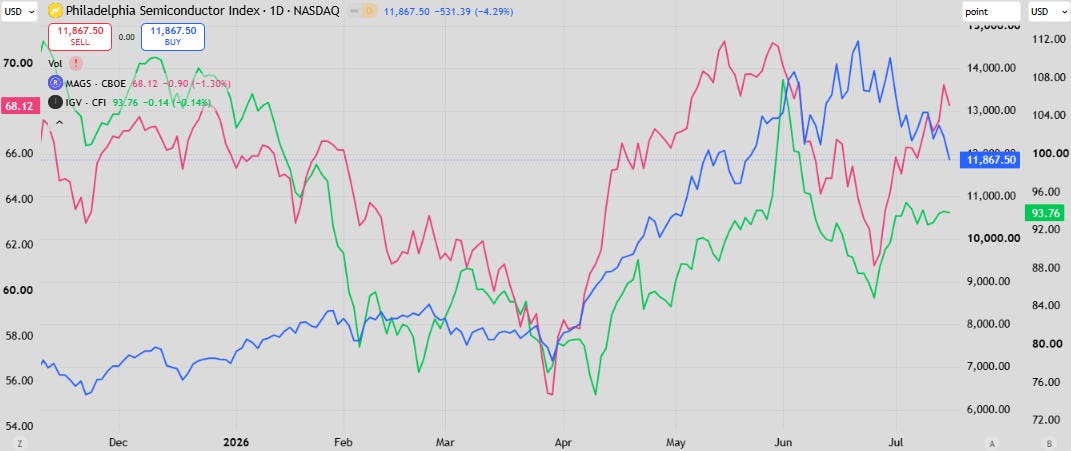
Most gyrations are driven by correlations between MAG7 (hyperscalers; cheque writers), SOX (semiconductors; cheque cashers) and IGV (software).
Once upon a time all of these sectors were correlated being “tech”. Now one cannibalises the other in a virtual game of rock paper scissors. AI demand up is good for hyperscalers/semis bad for software but only up to a point. If it gets too good for semis, hyperscalers start to hurt. Software seems to only dead cat bounce to satisfy the negative correlations.
All of this has happened without a distinct theme driving it. The top in semis could well be technical - a period of consolidation after an incredible 6-month run. Or it is truly the top and they will once again become cyclical after the capex hump is crossed.
Essentially this is the “it’s not a bubble” versus the “it’s a bubble” argument. I don’t think it’s a bubble, for the record. You’re going to get volatility as that fight is fought.
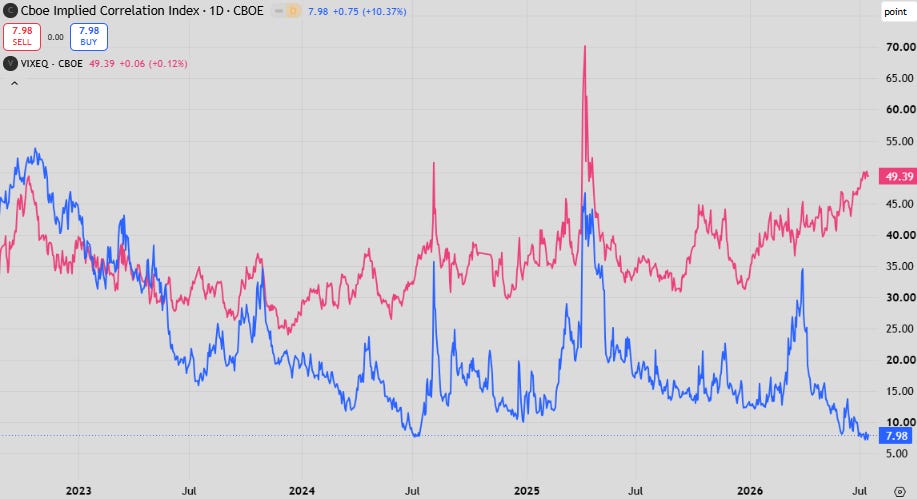
These trends are pushing correlation down while pushing single stock volatility higher.
I’ve mentioned and pointed it out before and I know I sound like a broken record. But it’s just getting more stretched with correlation reaching even lower lows while everyone gets more nervous.
It’s a real problem. It makes me nervous knowing how blow ups like LTCM happened. Misestimating correlation benefits in spread trades are the way you get your portfolio level volatility badly wrong because that correlation benefit is so powerful when calculating trade sizes to a certain volatility target.
In the more general S&P500 index these trends have extended to correlations between financials/healthcare, which has added to SP500 correlation woes. Good banks results and skipping of a July hike also helped here.
In my mind the constituent volatility is the “source of truth”, which translates to some big moves in the index either up or down if that correlation breaks.
Concerning Chinese data…
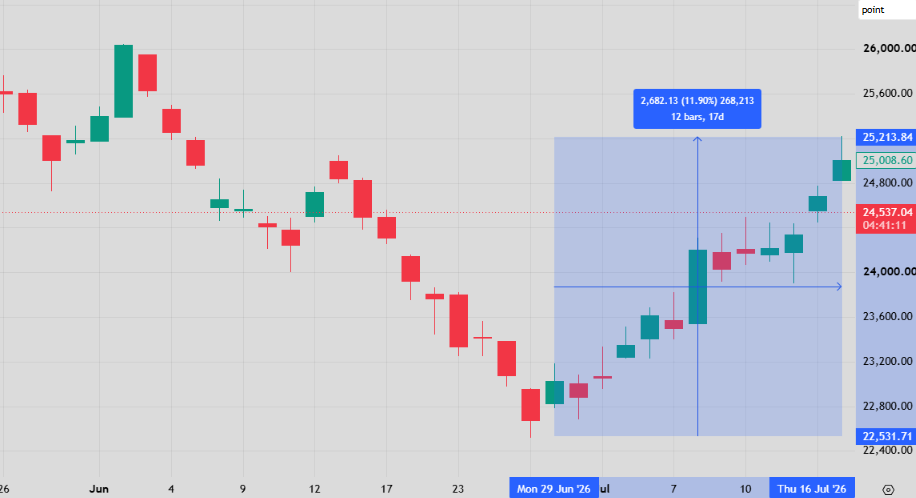
…although you wouldn’t know it from the Hang Seng which has completed a 12% turnaround on Chinese tech enthusiasm, bucking the broader trend. I don’t think this will last.
The perennial “stimulus hopes” (China’s version of “Iran wants a deal”) has been rumoured again but has yet to arrive in any decent size from past chatter. This week’s data was bad enough that hopes are back again.
China’s data dump this week put imputed quarterly GDP growth below 4% annualised. This is significant.
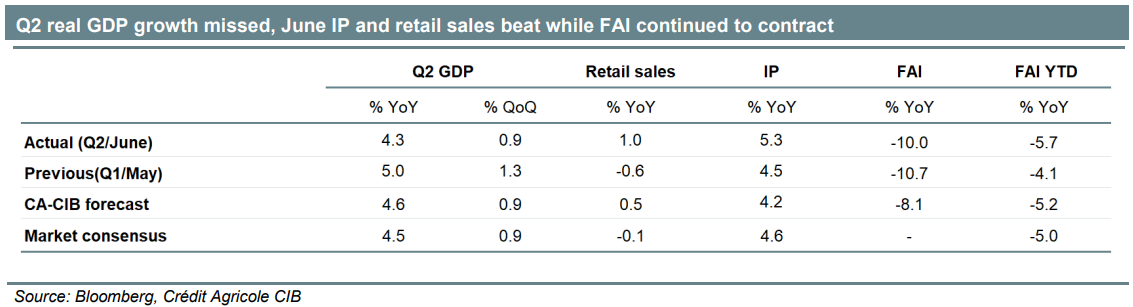
These numbers mean they will likely miss the 4.5-5.0% growth target for the year.
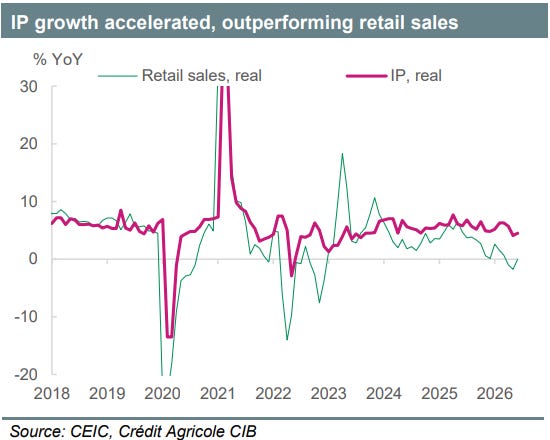
“Good” points in the data included rising growth in industrial production from tech and (surprise, surprise) export sectors.
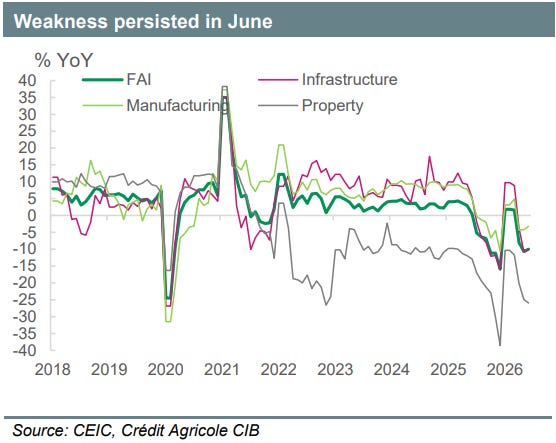
Investment was once again the drag, worsening in a property sector yet to find a floor. There has been plenty of cope about the this being the bottom in Chinese property but I’m not really sure how you can get to that conclusion.
Pressure is definitely increasing on the party to offer some sort of stimulus, but the last few years has shown that the ideological aversion to household stimulus is still strong amongst the leadership.

Stimulating supply side and foreign demand is A-OK though!
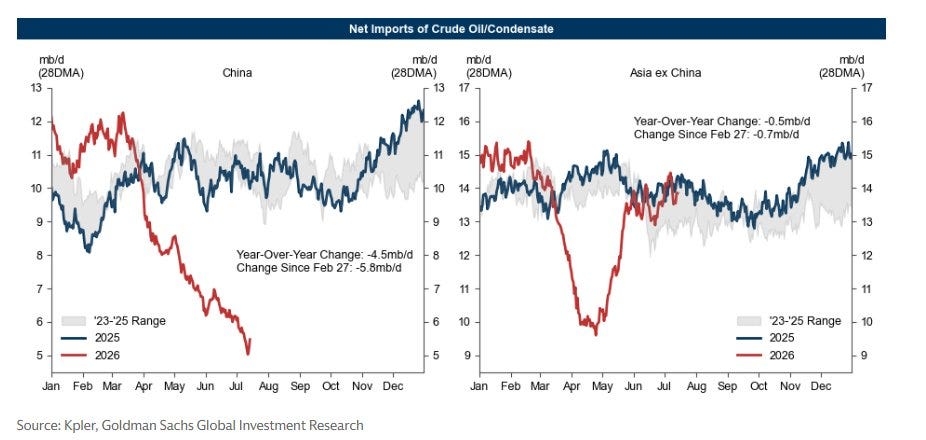
I’m not sure how you could consider China’s charity to the rest of Asia as anything else. Goldman’s chart above highlights the fall in Chinese imports from end March to now fully paid for the recovery in Asian ex-China imports.
It may seem like it’s smart as those barrels were bought for far less than a barrel today. But they have to be replaced. And they are unlikely to be replaced for less than they were bought since everyone else needs to replace theirs as well.
I choose to see it as it is, stimulus to their trading partners to try and salvage export (and thus GDP) growth. The salvage operation has just got bigger after this quarter’s GDP result.
I do, however, think that weaker Chinese data means that China is likely to stay out of the crude market for longer. The cost of a cleanup domestically would outweigh the opportunity cost of those lost barrels by a large margin.