

With April data starting to trickle through, let’s look at how tariffs are affecting the economic data.
US CPI
At first glance the April CPI, despite offering a big bounce from March’s very subdued reading, had little tariff effect coming in lower than consensus.

Both headline (0.22% vs. -0.05% in March) and core (+0.24% vs. +0.06%) CPI were below expectations and the year-over-year rate for headline fell a tenth to 2.3% while core remained steady at 2.8%. A roll off of some stronger numbers saw shorter-term trends in core improving, with the three-month change falling nine tenths to 2.1% while the six-month change edged down by 6bps, remaining at 3.0% on a rounded basis.

Core goods prices rose by 6bps (vs. -0.09% in March). While not particularly widespread, some categories seemed to show initial signs of being impacted by the early February tariffs.
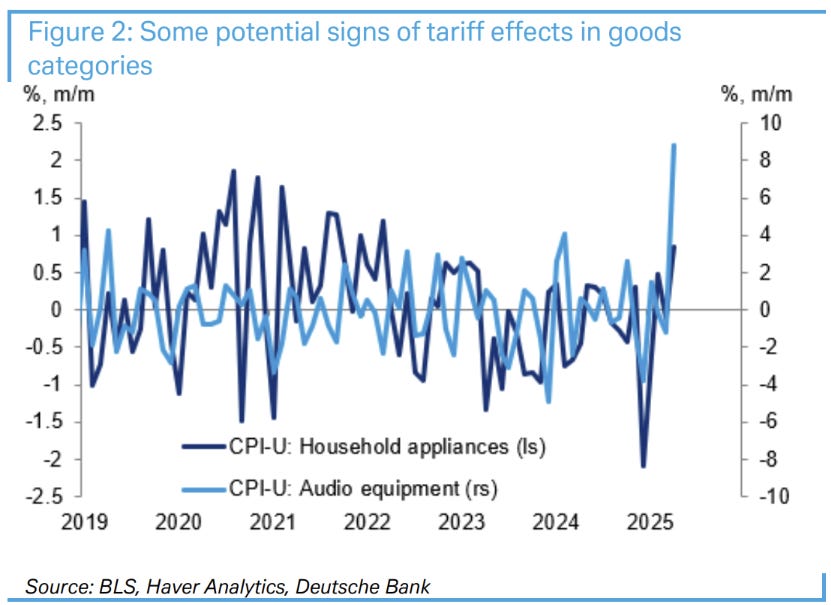
Household furnishings and supplies grew by 0.22% (vs. +0.21%) buoyed by an +0.8% gain in appliances, the largest price gain since early 2022. Other recreational commodities also saw large gains, e.g. an 8.8% spike in prices for audio equipment and a 2.2% rise in prices for photographic equipment and supplies.

There is a lag between rising wholesale used car prices affecting retail used prices. This tends to be about two months but can become more compressed supply shocks and other volatile periods such as the pandemic. With wholesale used vehicle prices showing an increase in April, the corresponding weakness in CPI used vehicle prices in April is unlikely to last into May or June.
Without a used car price effect, the two prior categories added about 0.1% to total core inflation. If we split the difference, we can assume that the tariff effect in April was somewhere in the region of 0.05%. Small, but without that the core CPI print would’ve been closer to 0.2% which at an annual rate would be getting closer to the 2% target.

The chart above details the expected effect on core goods inflation from a 10% rise in tariffs on Chinese goods.

This chart, while from the BEA, was cribbed from Parker’s (@Econ_Parker) thread above (click the image to go through to the thread). Parker always gives a great rundown on CPI and employment data and is well worth a follow.

While the absolute contribution of core goods was small, core services showed some weakness as well, making the April core CPI print ex tariff effects quite subdued.
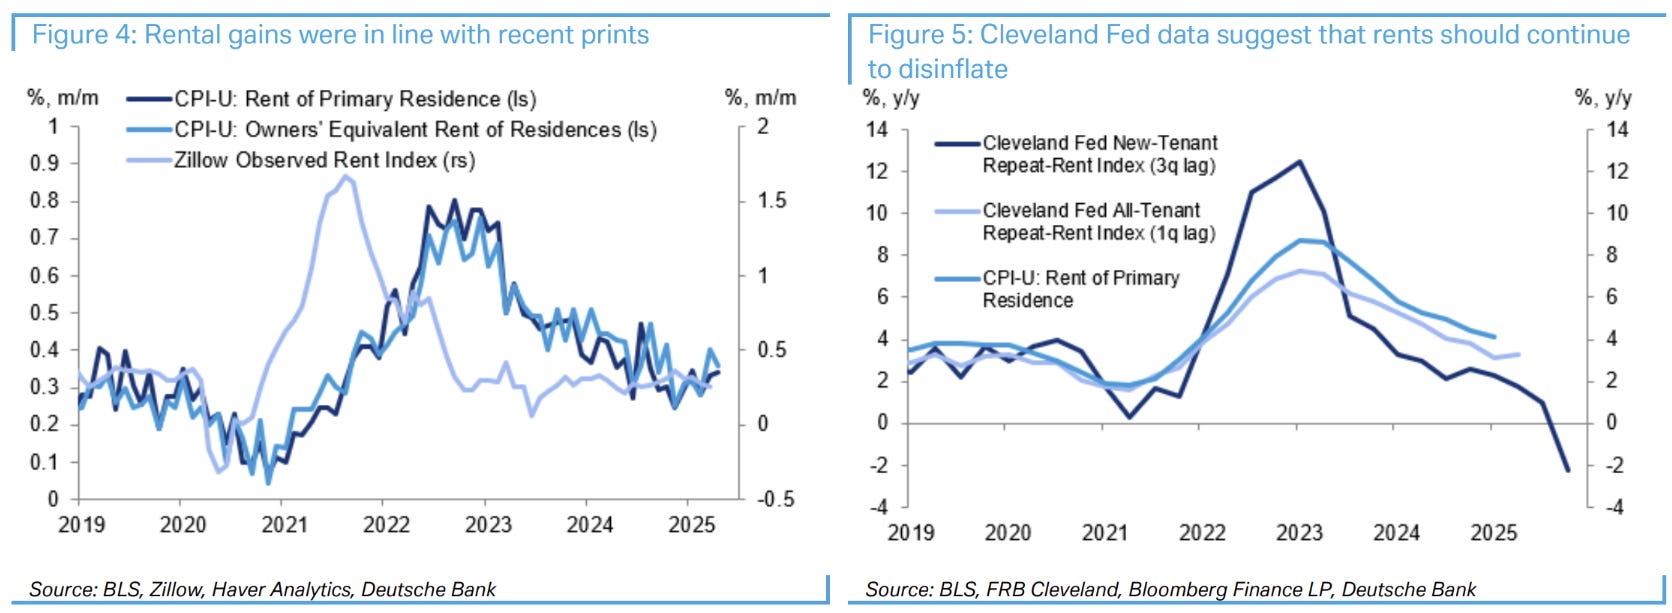
Rents were in-line with recent prints, leaving the weakness in services to other categories including airfares, which was likely due to falling crude oil prices.

I made a thread above primarily assigning the continued steepening of the curve to the continued outperformance of US nominal GDP and a short end that will find it difficult to price out too many rate cuts given the environment.
Since it is difficult to know how exactly how much of any rise in core CPI is due to tariffs, any acceleration in inflation is likely to be played down, with the weakness in underlying inflation over March and April only solidifying the point.
China exports
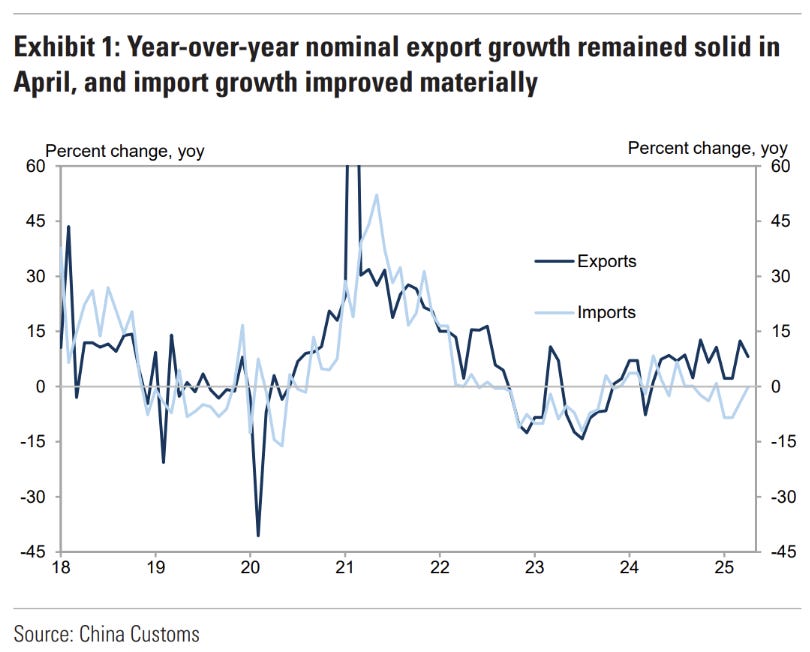
While Chinese exports remained strong in nominal terms…


…there was a fall in exports to the US, but the RoW maintained its growth. Have exports been rerouted? Quite possibly.

Chinese PPI continues to show considerable weakness…

…now down 2.7% on the year.

Labour costs are also very weak, and this is before any major tariff impact. This puts the “social agreement” between the people and the CCP at risk. China may be close to deflation, but stagnating wages will still be a problem.

The lynchpin of continued growth is the increase in debt, and not just in the US. China continues to grow debt at roughly twice the pace of the US (in USD terms), while only being an economy two-thirds the size.