

A short note for a short week.
Realised vol fell considerably this week, with the S&P500 daily true range falling from >6% to around 2.5%.

While BofA’s point may be that a 20x multiple is the ceiling for near term trading, this doesn’t mean we necessarily head back to a 20th century earnings multiple.
There are a few reasons why this is the case:
Interest rates will be lower than over the 20th century. A P/E multiple is the inverse of the earnings yield of a stock which is related to interest rates.
A large part of the index is “capital light” in that tech doesn’t have the same limitations on earnings growth in regard to PPE. This might be changing however as AI certainly isn’t as capital light as the rest of their businesses.
The US trade deficit is larger than in the 20th century, inviting more capital into the country that is chasing less assets (someone is currently trying to change this one).

The pickup in volatility has been broad based with some asset classes like Treasuries surpassing that of the pandemic. Once aggregating global assets SG’s vol index above is still only approaching the long-term average.

Correlations have spiked…

…as de-grossing of position sizes affects everyone in hedge fund space.
Gold and the Swiss Franc
Gold continues to accelerate and has gone parabolic.
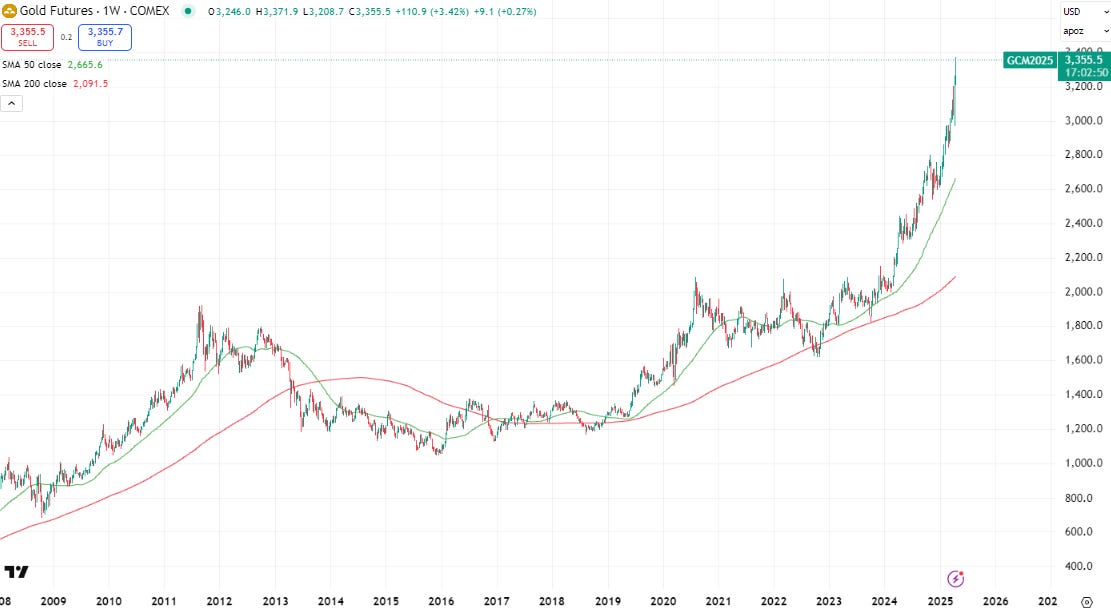
Indicators seem to point to Chinese activity as the driver, along with central bank demand which I pointed out a few months ago.


The chart above matches with the start of the gold rally at the beginning of 2024. While goldbugs prefer the explanation of the confiscation of USD assets as part of sanctions towards Russia which may have encouraged central bank demand from around the world, the accumulation by the Chinese seems to be a factor as well.

This may be driven by expectations of currency devaluation, encouraged by the slow rise in the CNY fix recently. There are strict limits on individuals moving capital into other currencies within China, but gold ETFs seem to offer an opportunity to do just that.
The shock devaluation of August 2015 would have been a good comparison to validate this theory, but unfortunately Chinese gold ETFs only started growing after 2015 (although it was easier to get money out of China at that point, with restrictions increasing subsequent to 2015).
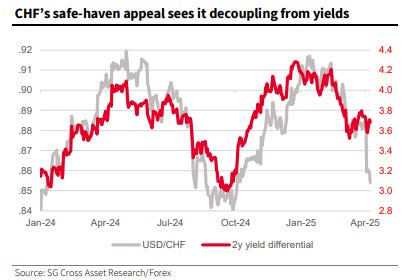
The Franc saw safe haven flows as well, with a distinct decoupling from cross-market yields a tell-tale sign.

This causes an issue for Swiss policy makers as the strong appreciation has a deflationary impulse which is why historically the SNB has had to intervene in the currency.


As well as intervention, further rate cuts are possible and have been partially priced.
Bases trade unwind fallout

The move higher in Treasury yields relative to other regions hasn’t resulted in a stronger USD, breaking the ever reliable (sometimes reliable) interest rate differential factor in FX pricing. This isn’t a law of course and both markets can travel in different directions, but it is unusual.

Recent high-frequency TIC data hasn’t shown any selling of Treasuries by foreigners, so the jury is still out on this explanation for higher yields (not one that I share fwiw).
The chart above highlights the split of US Treasury ownership over the long-term. Foreigners have become less important as banking regulation has increased the proportion owned by the financial sector.
China markets
China continues to trade well in comparison to the US.

Without an iron-clad plan on fiscal support however, Chinese growth forecasts are coming down, despite Q1 being quite buoyant.
Nomura highlights the rise in the services balance between the US and China. the largest line here is “use of intellectual property”.
You likely saw this video this week. I was one of many highlighting where expensive luxury bags are actually manufactured. I can’t say I understand why these videos are a help to China in the current environment - they seem to suggest that the IP associated with these designs is worth nothing and thus can be stolen.
This creator has been around for a while. She offers just a glimpse of the incredible size of China’s industrial machine, where now 2 out of 3 manufactured goods emerges from.

Falling growth expectations are expected to see a reaction in the form of rate cuts and a lower RRR.

This continues to weigh on the Chinese banking system in the form of falling profitability through lower net interest margins. Quickly growing balance sheets will find themselves with a smaller and smaller buffer.
Thank you for your weekly charts, Mr. Farac. I really appreciate them and thank you for the time you take in putting them together with your thoughts.
Best,
Valentino