
Charts & Notes: Japan is pure macro
Japan is easily the most interesting macro market (for now anyway)

While I concentrated on the risks in private credit last week, movements in Japanese bonds and currencies made some people worried.
One very widely spread post made some crazy predictions. Be warned, my ranting response is below (nothing too new for long-time Charts & Notes readers).
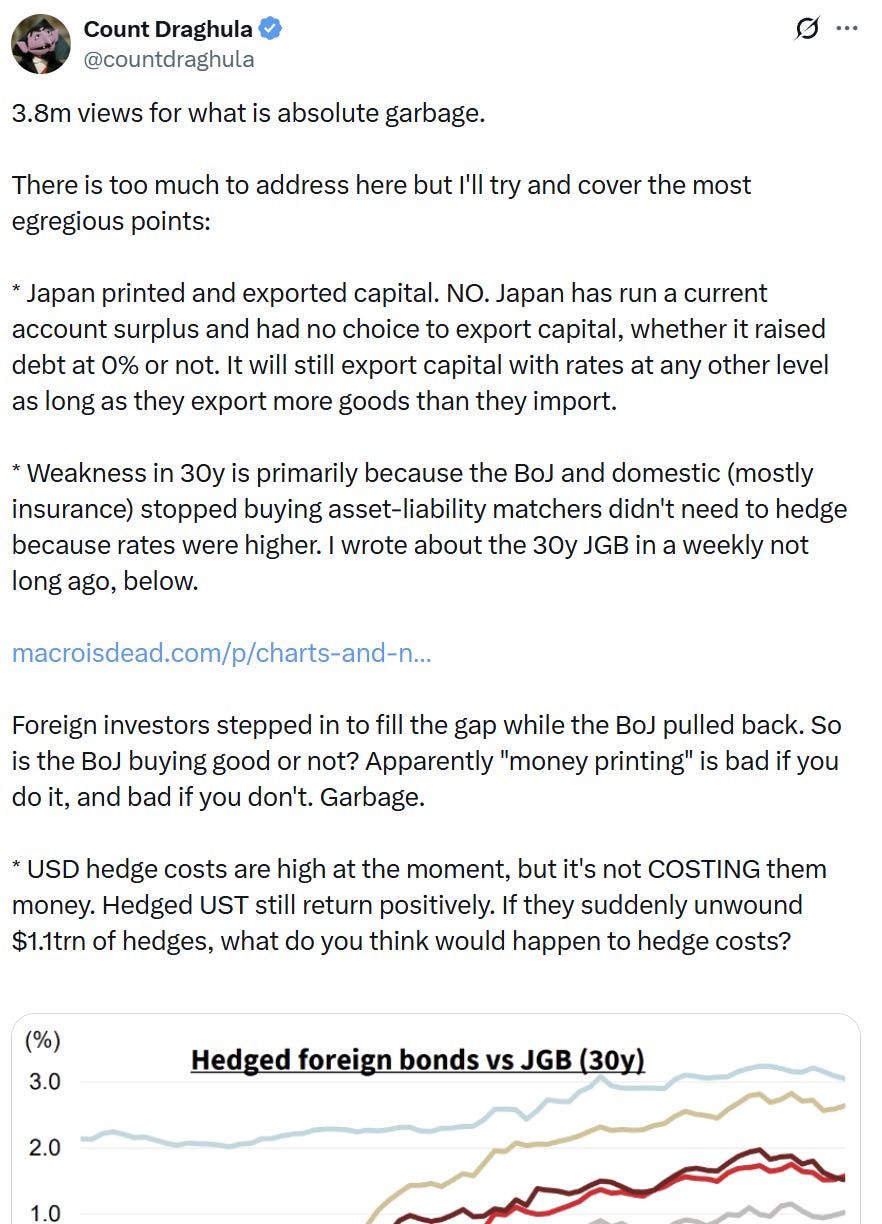
You can appreciate that the moves are important without resorting to “it’s the end of the global system as we know it”. I didn’t comment on it last week because this week was quite an important one when it comes to the forces driving the Yen and Japanese bonds weaker.
Where my view differs is my belief that bonds are actually trading better than you would expect given nearly every single factor is suggesting higher long-end Japanese yields.
The two key events this week was the new Prime Minister’s fiscal plan, and inflation.
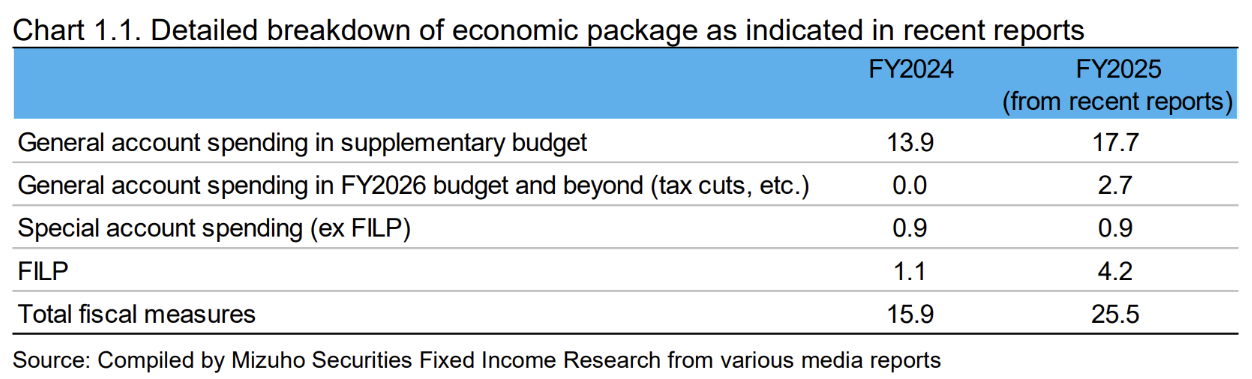
Spending is expected to be about 25 trillion Yen more than last year, Mizuho forecasts that the increase on JGB issuance will be lower at 10 trillion Yen after accounting for increases in revenues. Market participants are almost certain to interpret this as confirmation of the Takaichi administration’s proactive fiscal stance.
The market has been concentrating on the 30-year point of the yield curve but it’s likely to be the 10-year point that will bear the brunt of increased issuance.
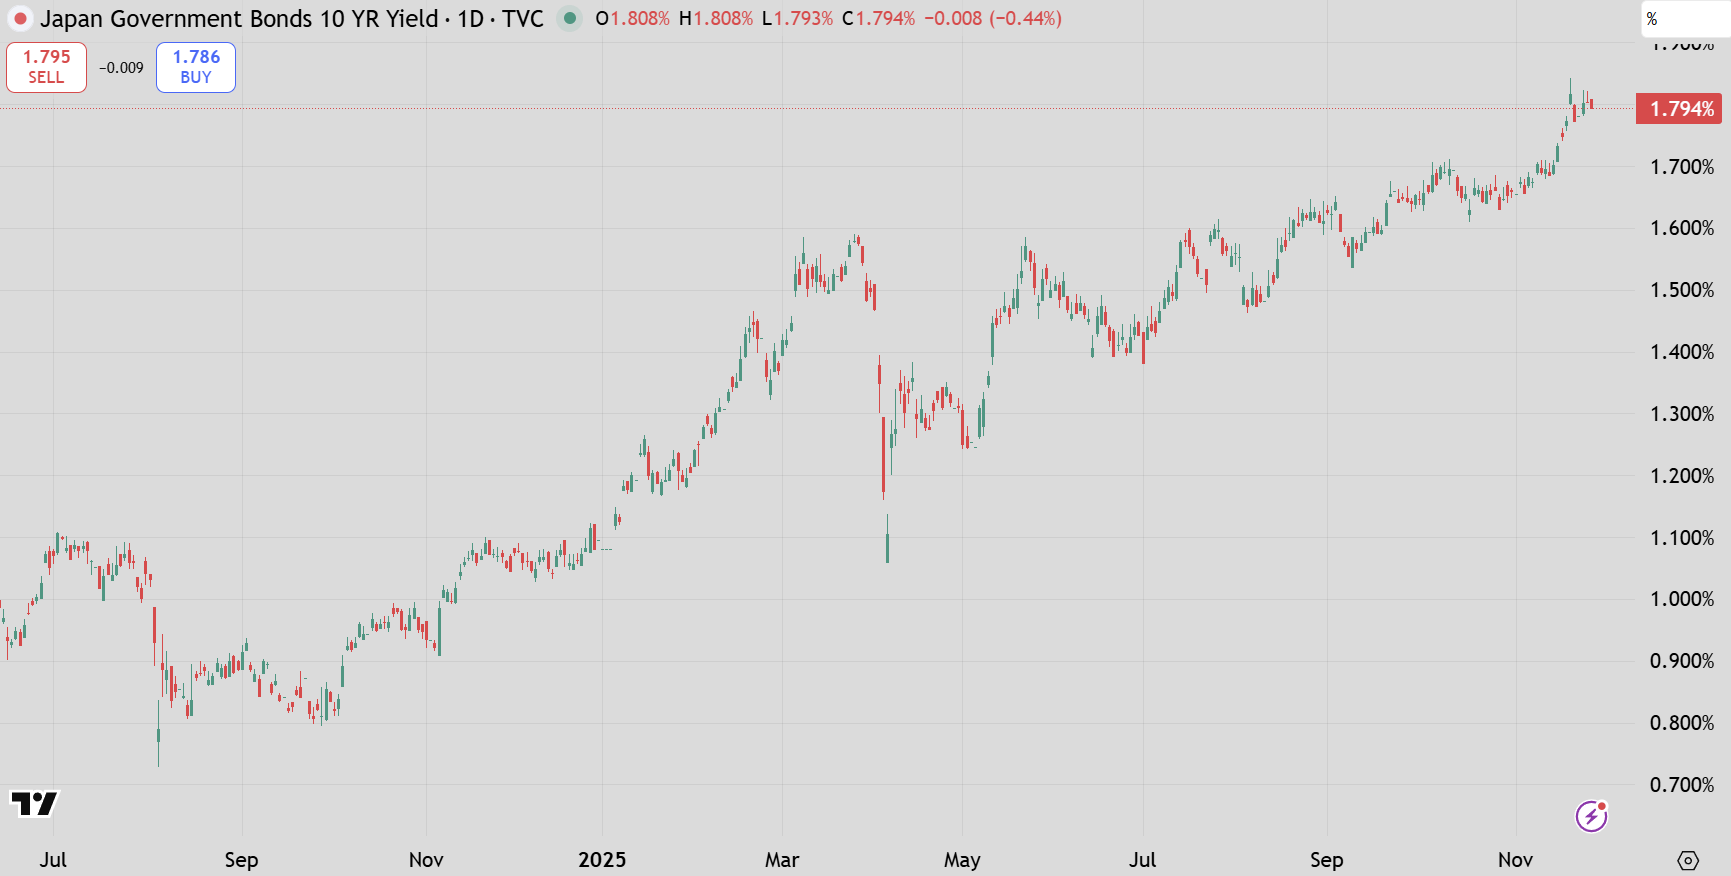
Why? The MOF wants to shorten average issuance maturity because of the lack of demand in the 30-year sector (explained by the primary headwinds of decreasing domestic buying across insurance and the BoJ).
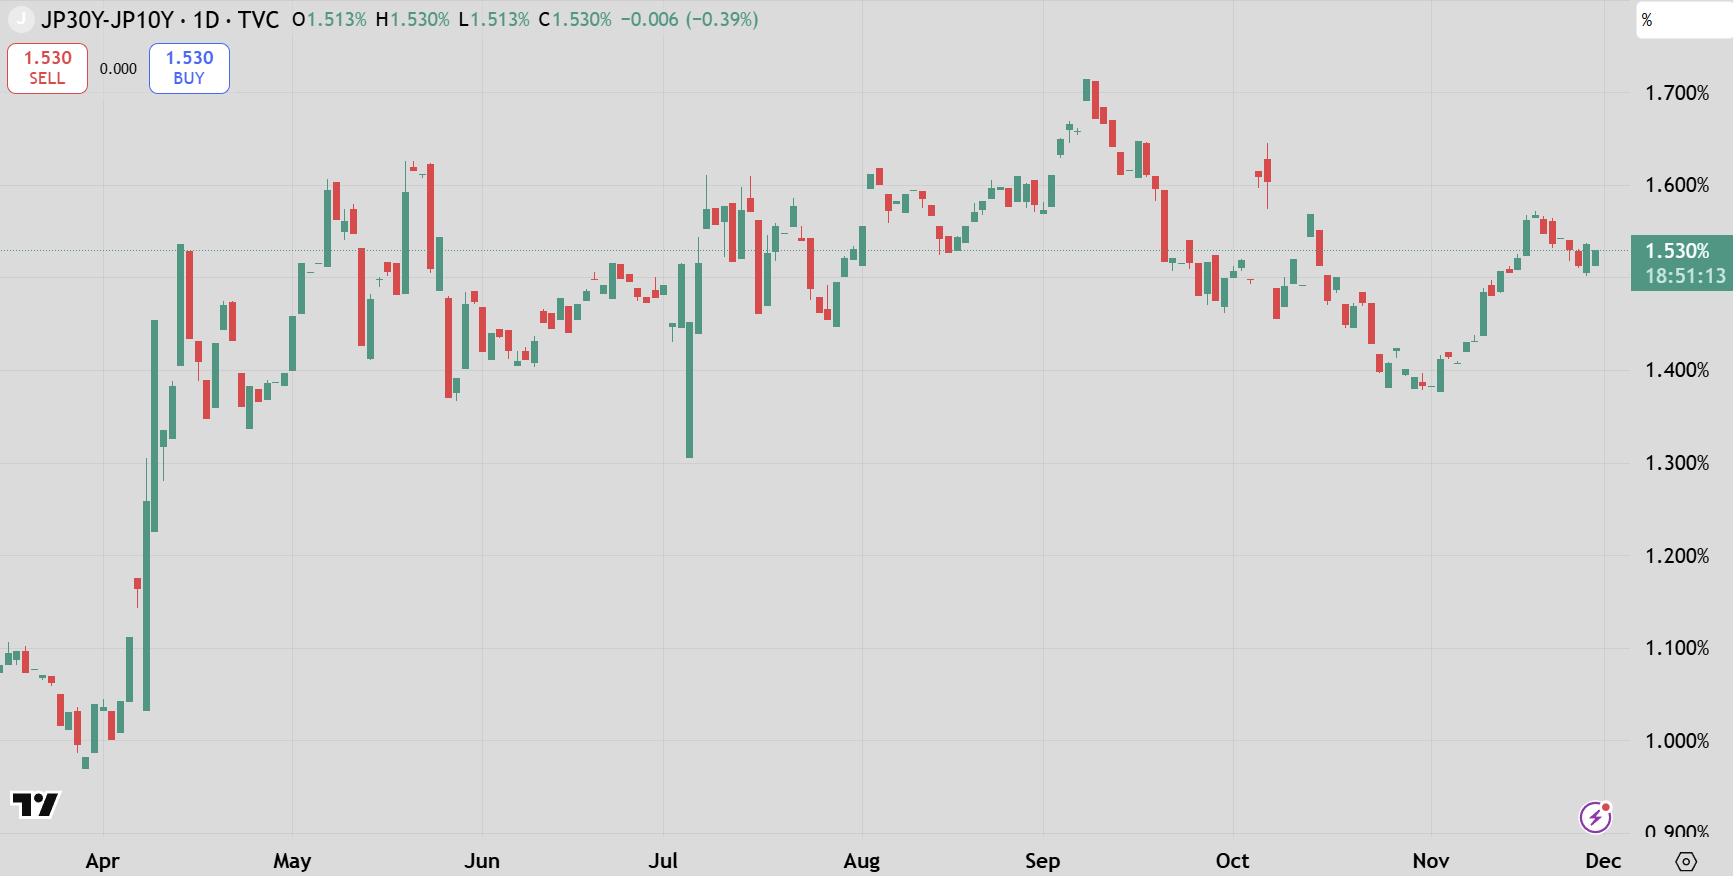
Since Liberation Day 30-year JGB yields have risen by about 0.8% but the 10/30-year curve is about the same. With rising rate hike expectations, the 10-year part of the curve should get richer (i.e. the yield should fall relative to the 2-year and 30-year), as this is the general relationship.
This was happening up until September, where you see the peak in the 10/30-year curve above. More recently it has gone the other direction likely because dealers are expecting to see (and probably want) issuance in the 10-year sector.
These effects are very technical and apart from providing some education on how the yield curve twists and turns with all of these macro happenings, it is mostly designed to show how prices and yields moving aren’t the end of the world.
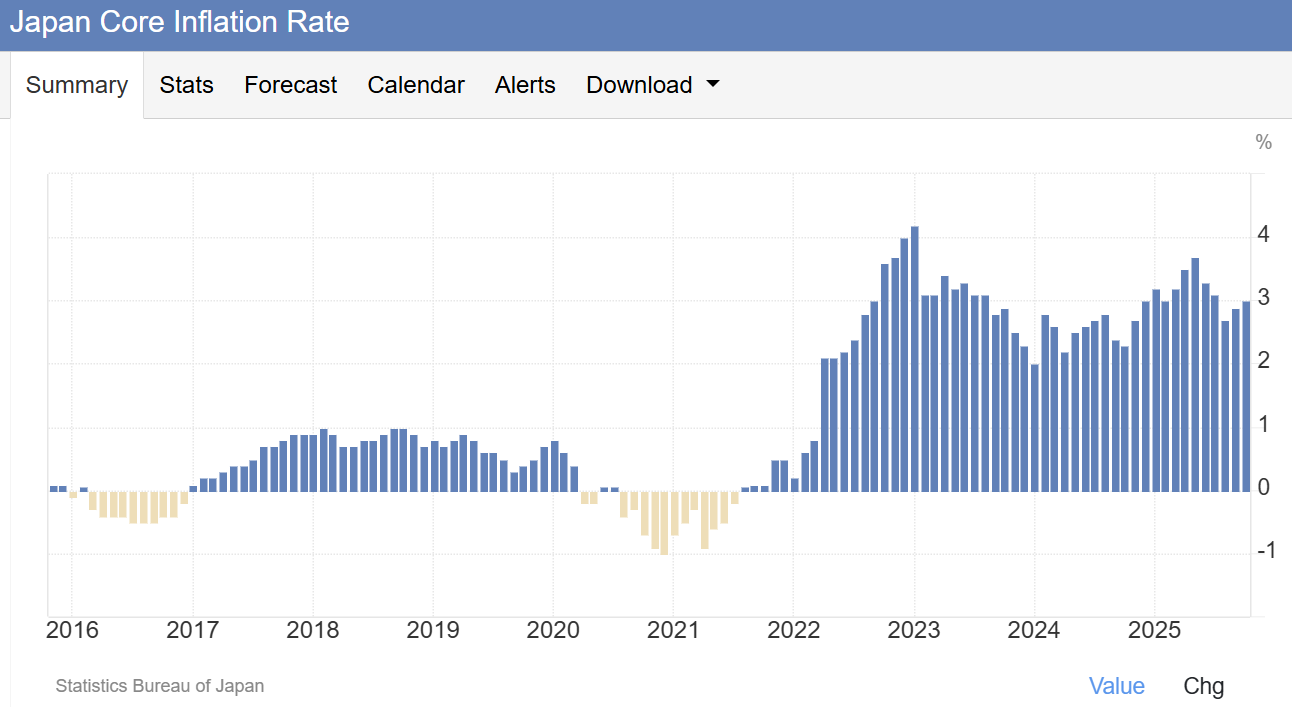
Last week’s inflation prints were in-line with market expectations so in general not that interesting.
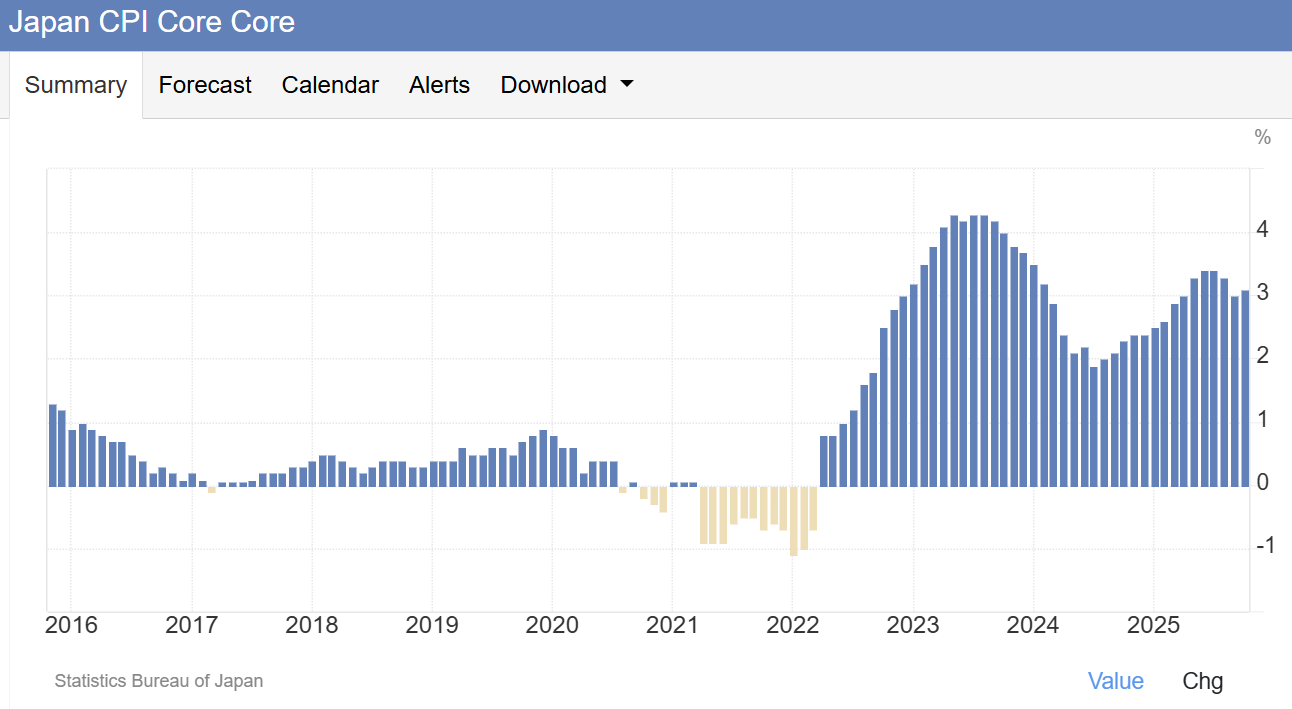
The levels might surprise some. Core and Core-Core (ex-housing) are printing near 3%, with YoY figures rising more recently.
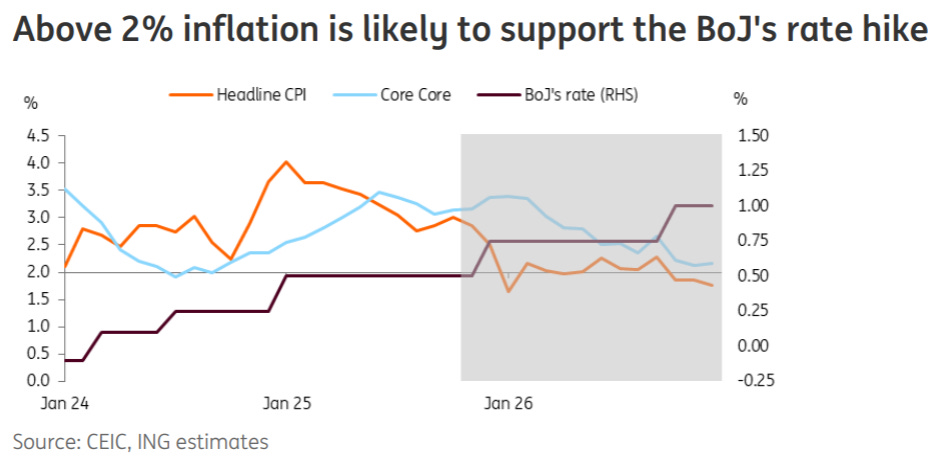
Inflation numbers at this level should keep the BoJ hiking and put it at odds with the Takaichi view on rates.
Most of the market has inflation moderating next year, as do inflation break evens. There have been some one-off effects like rice shortages driving some huge price increases that should subside.
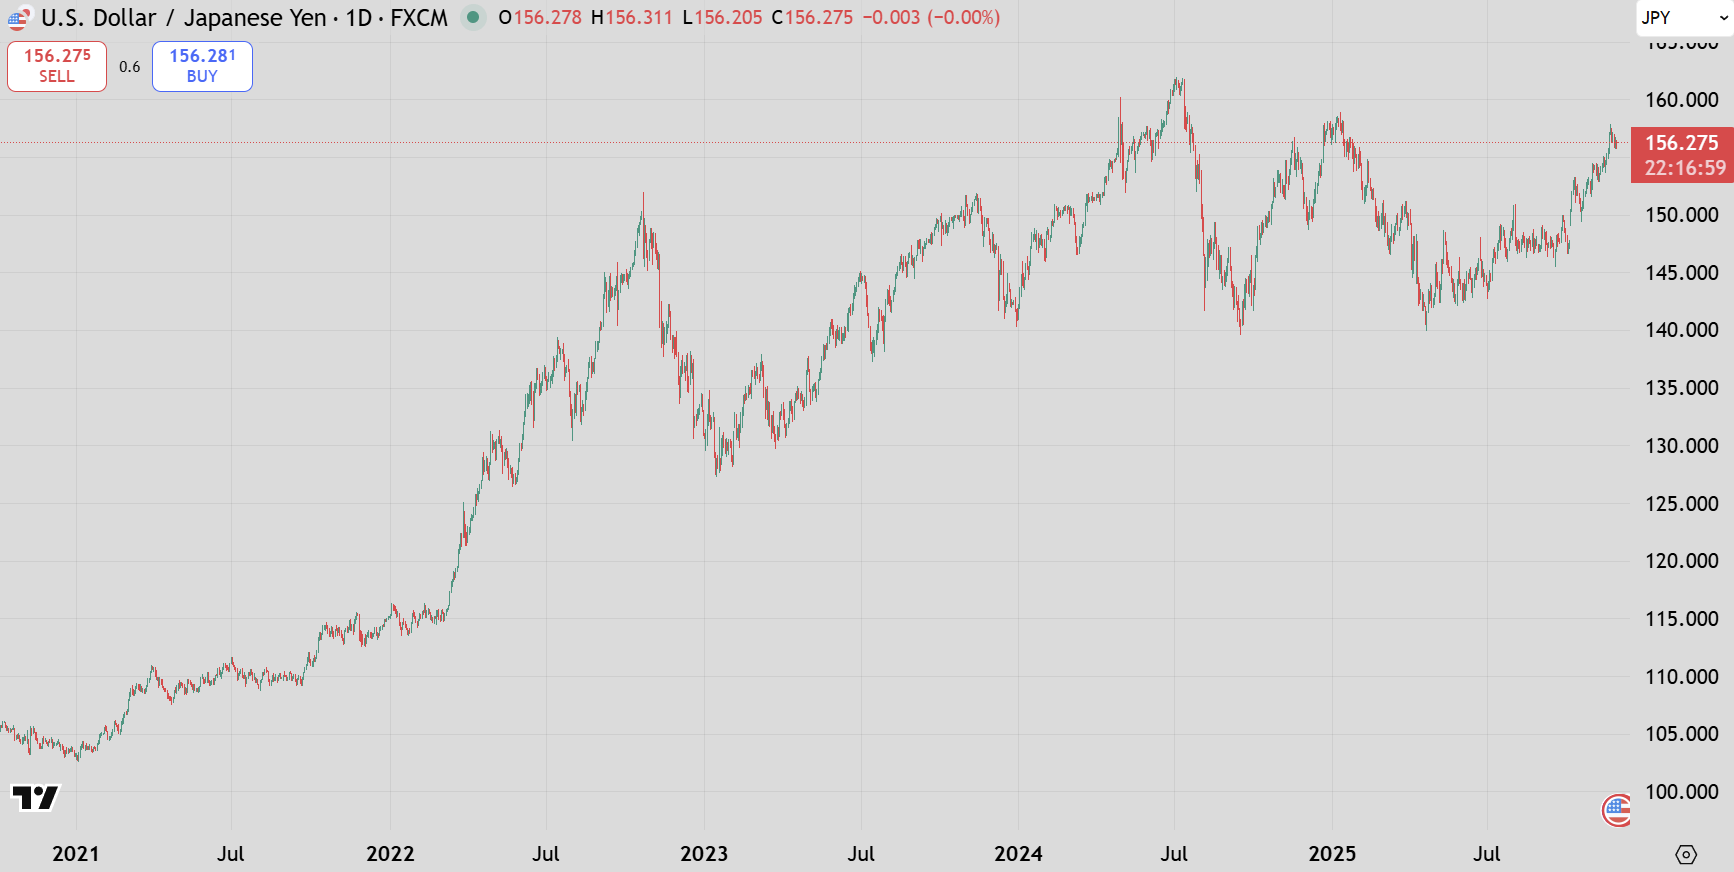
The Yen is a little different. It has sold off by more than yields would suggest and USDJPY is back towards record highs.
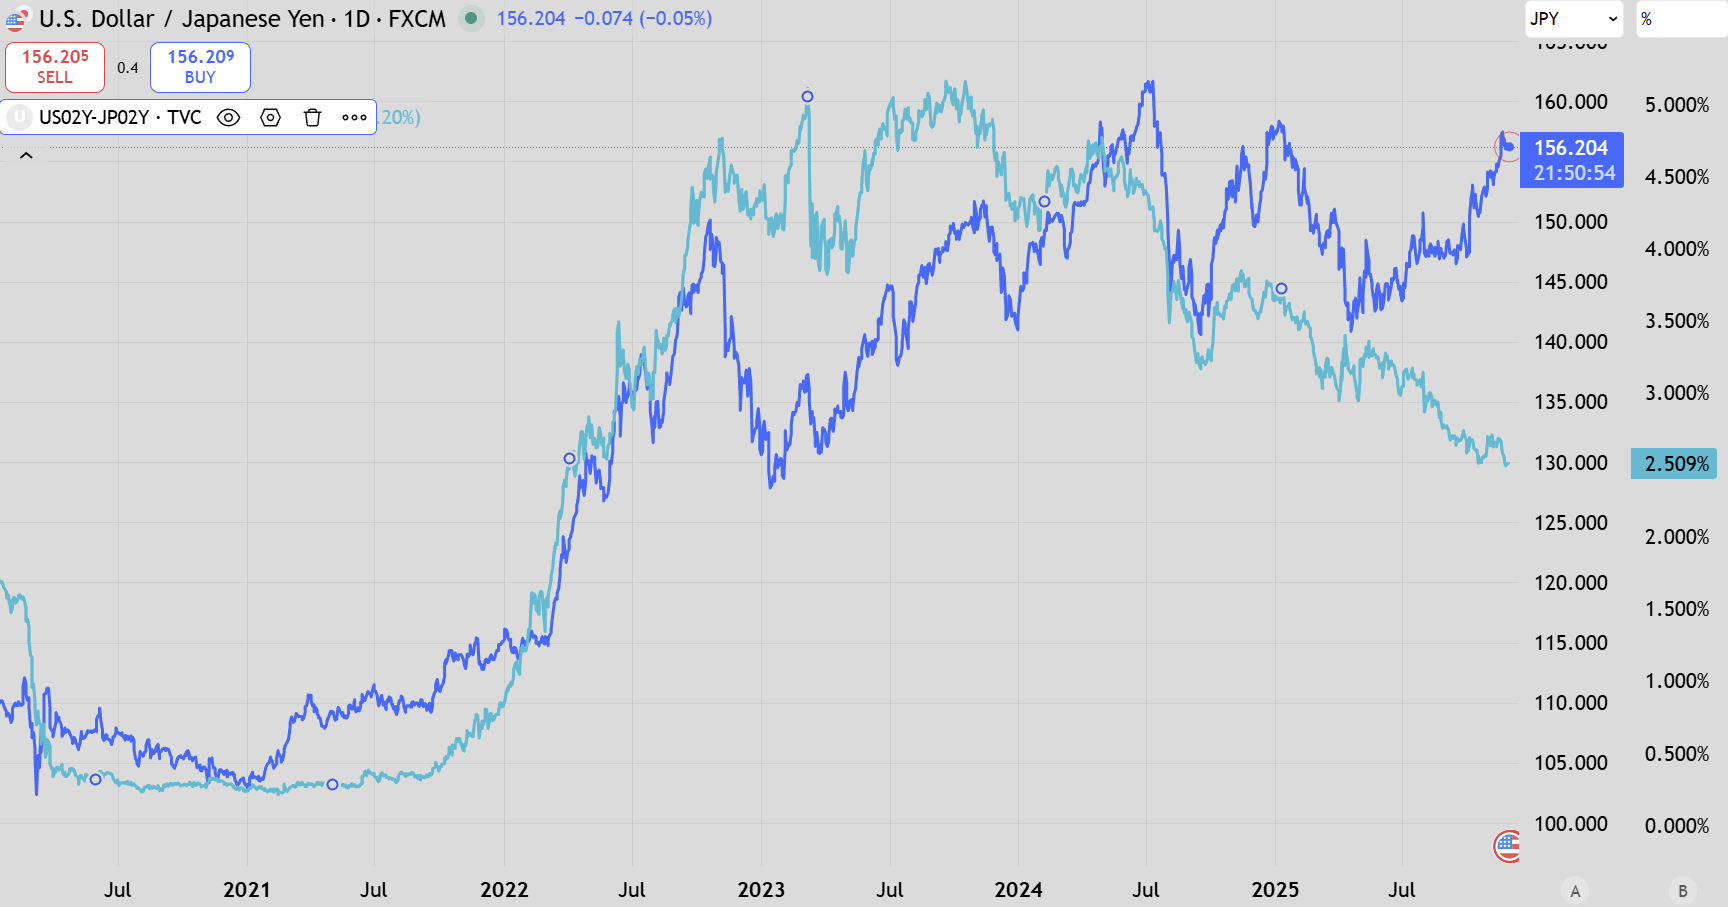
This is at odds with interest rate differentials as seen in the chart above. US yields have outperformed globally and, when compared with Japanese yields, indicate that USD/JPY should be trading lower rather than higher!
The chart above shows how directionally aligned the currency has been for the last few years…while the levels may not perfectly align, most of the time rate differentials inform on the direction of the currency.

This has broken since Liberation day. Reduction of USD hedges (because of elevated costs) is likely the explanation however it’s very easy to look like a fool trying to explain moves in FX land!
US data is back!
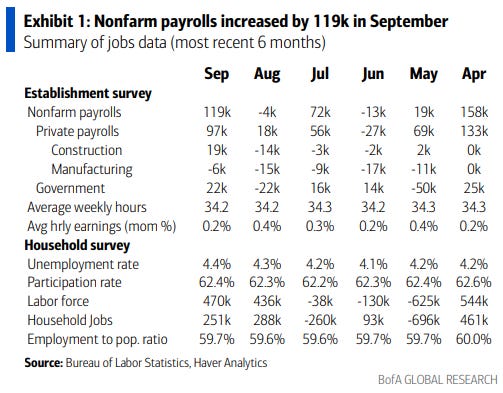
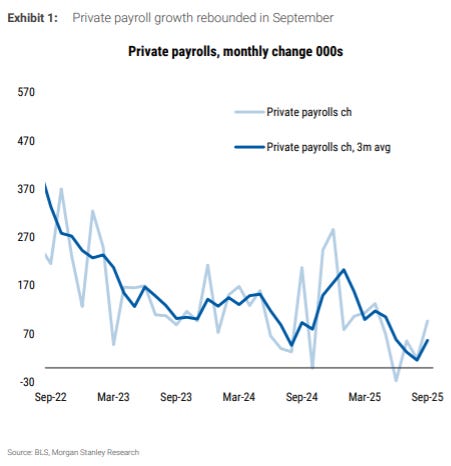
Employment numbers made a return and were a mixed bag in September: 100k+ payrolls with 4.4% unemployment rate.
September surged by 119k, higher than the market’s consensus. However, the last two months were revised down by 33k. The unemployment rate increased from 4.3% to 4.4%, but for reasons of an expanding labour force.
These numbers make a hold in December more likely in my opinion. It doesn’t really matter though because the Fed will end up getting to 3% one way or another.
I dislike betting on individual meetings, and this one doubly so…
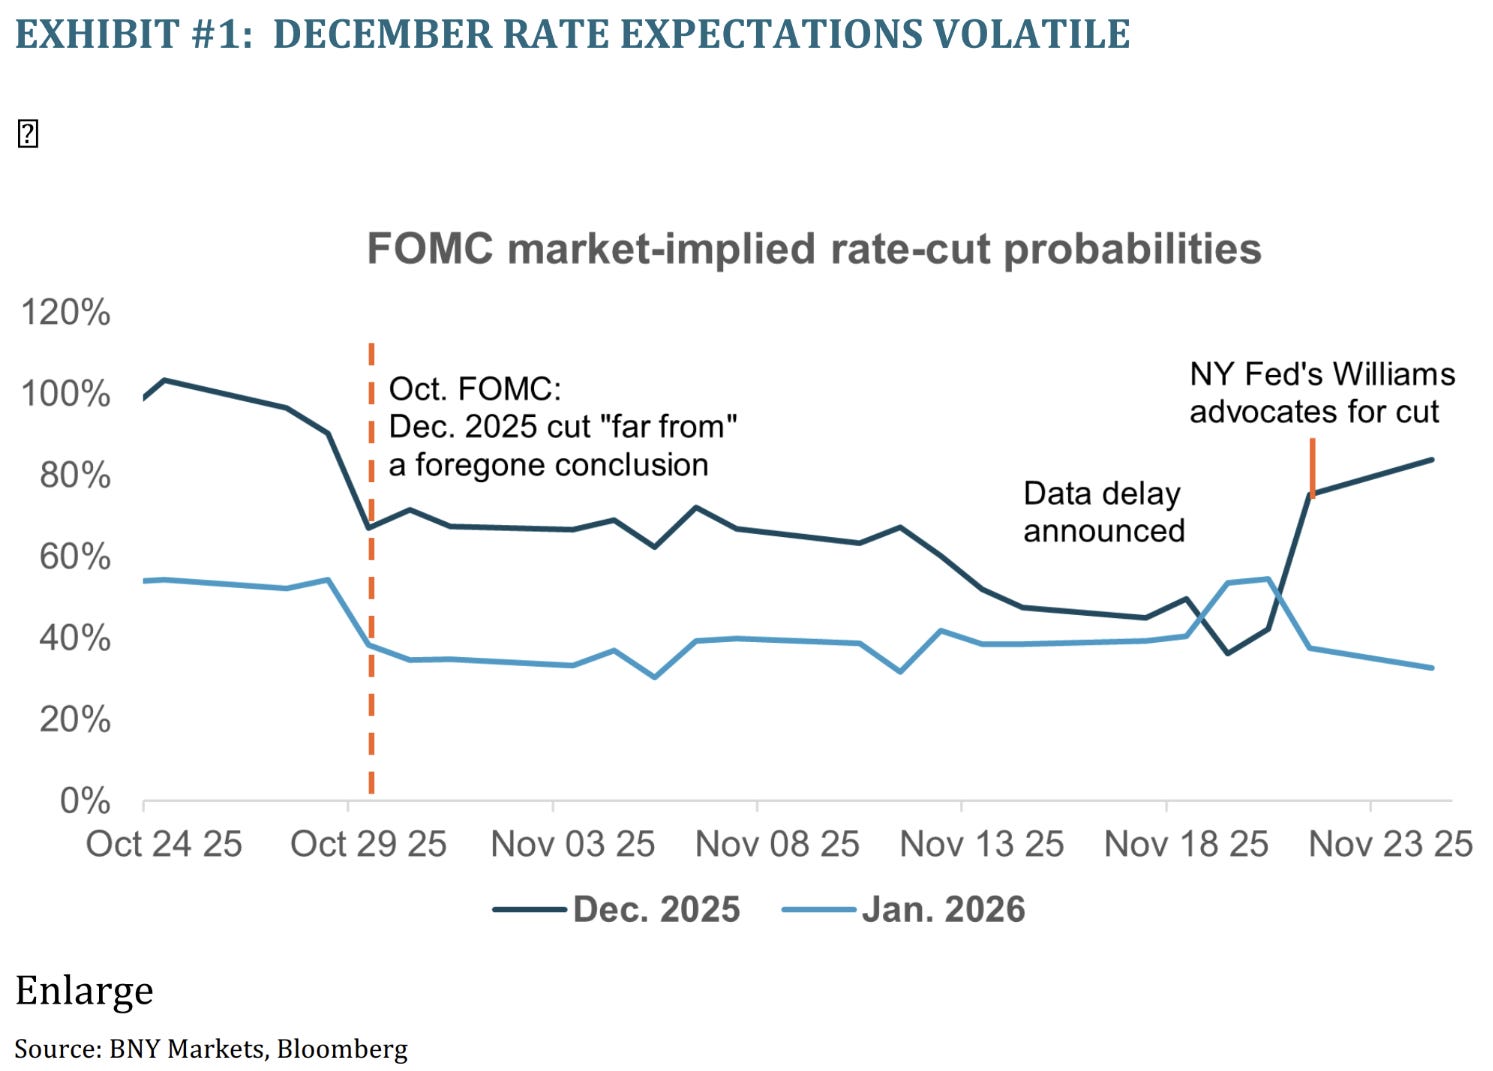
..probabilities are flying all over the place.
There won’t be any more key data released before the meeting and this factor would be what would tip me over into the “no move” bucket.
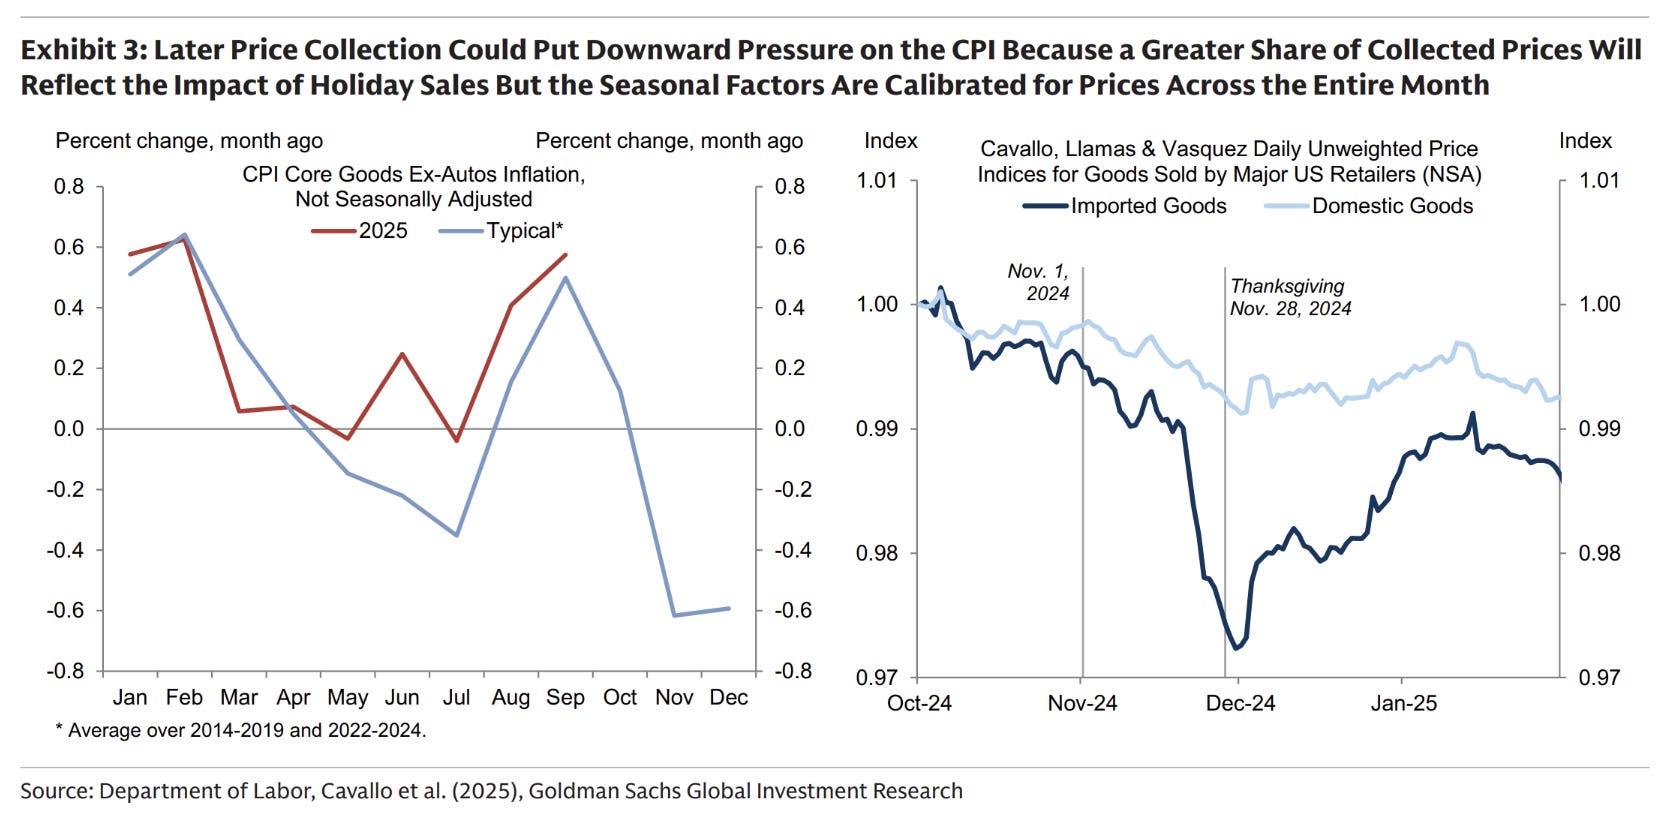
Speaking of data, Goldmans did an extremely boring piece on bias in delayed economic releases. The only interesting part was the chart above relating to CPI - so keep this in mind when playing the chocolate wheel of economic releases!
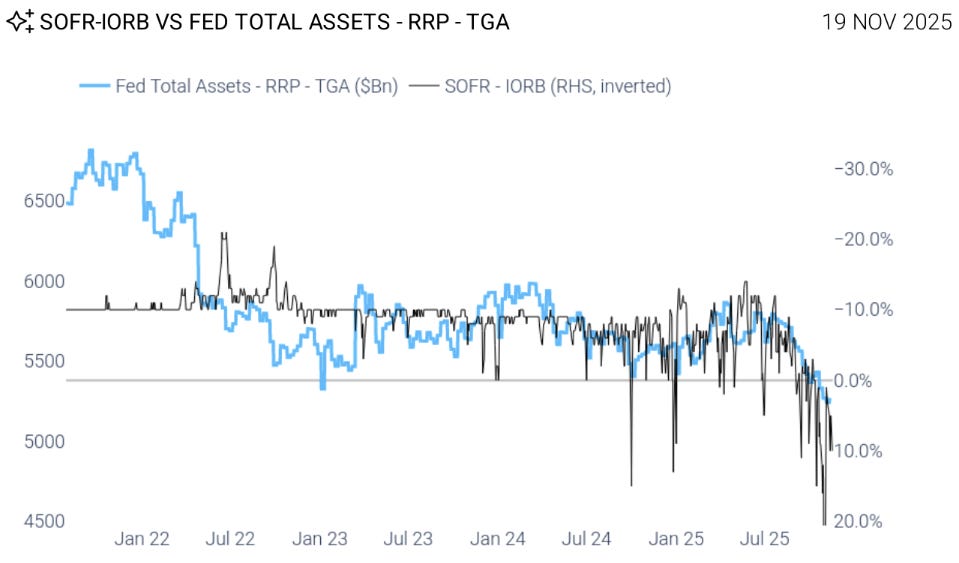
More on point is the release of funds from the TGA. The monetary vacuum caused by the shutdown will be reversed and will drive strong equity performance into Q1.
Remember that US equities had one of its worst relative years in 2025, especially against Europe and Japan. It’s time to make up some ground.
Macro is Dead
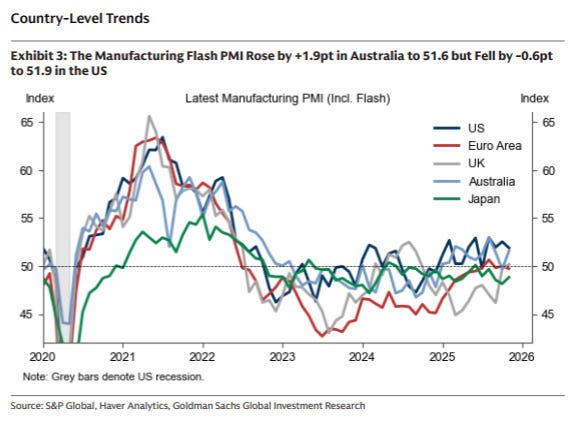
This PMI summary just highlights how dead the business cycle is. Since there is no cyclicality in government spending, neither will there be in the business cycle it mostly supports.
"Remember that US equities had one of its worst relative years in 2025, especially against Europe and Japan. It’s time to make up some ground." - after 15 years of a one way bet, are you really saying we only get one year of mean reversion, Peter?!?
Really enjoyed your thoughts on longer-end JGBs. I dunno if you follow the BoJ speakers, but they have flip flopped on Dec hike almost inversely with the Fed Dec cut premiums picking up this week. Today's Tokyo CPI ought to reinforce some hawkishness for BoJ.