

US equities are just about at their level pre-April 2, with global equities in some cases well above these levels.
US bond yields continue to track higher (with curves steeper), while Euro bonds are far lower in yield. Italy, earning an upgrade to BBB+ during the week) has reversed the entirety of the panic induced widening.

Credit hasn’t been so lucky however as it will remain elevated with other measures of equity volatility.
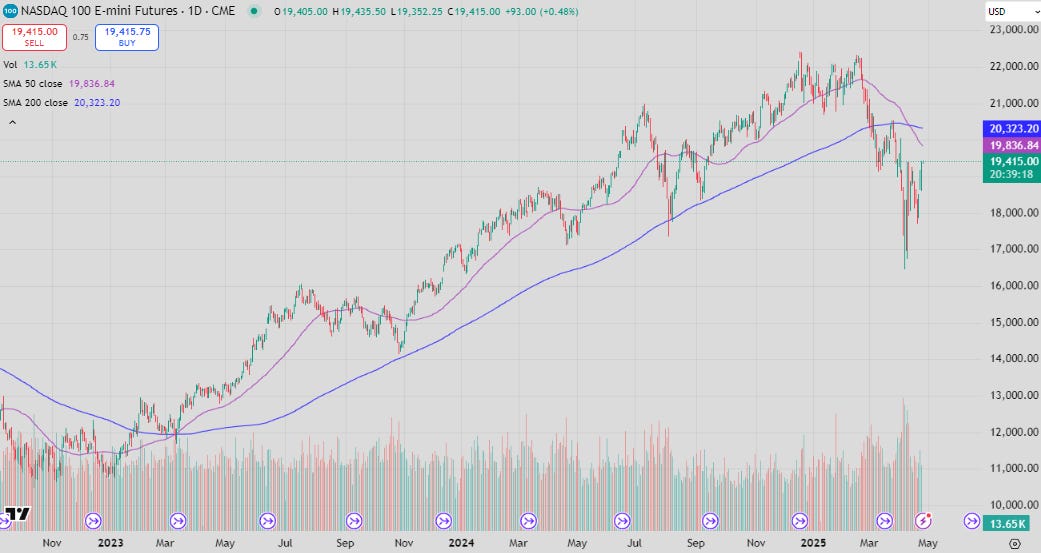
Despite the rally, the Nasdaq still sits below both the 50d and 200d SMA.

The DAX however faded the 200d and has rallied up back up to the 50d marker, post an ECB that seems to want to cut more in the short-term.
The twists and turns (or promise of twists and turns) in relation to tariff levels have weakened the market’s belief in the administrations resolve to cause recession to achieve a balancing of the twin deficits through recession has meant that leveraged money has continued to pile back in to areas where tariff impact isn’t expected to be as large.
At its extreme the market will look through to Q3 if it wants to buy equities, as any near-term tariff disruption (and reversal) will be likely to occur by then.
The tensions within the administration to achieve this are clearly visible. If it is all reversed, then the US will be left in a worse position than where it started - a large fiscal deficit (which is already tracking higher) and a China that will have the largest trade surplus in history that will only grow faster with the amount of stimulus they are now planning.
While China talks are in focus now, it makes little sense for China to give up anything given the position they’ve taken. They should be set on getting things back to how they were, and I don’t expect that to change. The pain has to go on a lot longer for them to change their stance.
The bearish story

The post above is worth a full read (click the image to access). Since 95% of all trade between China and the US is ocean-bound there will be a considerable lag in when the effects are felt.

This extends to the time lag of a full reversal of tariffs if that were to happen. A restart would extend well into Q2, if not Q3.
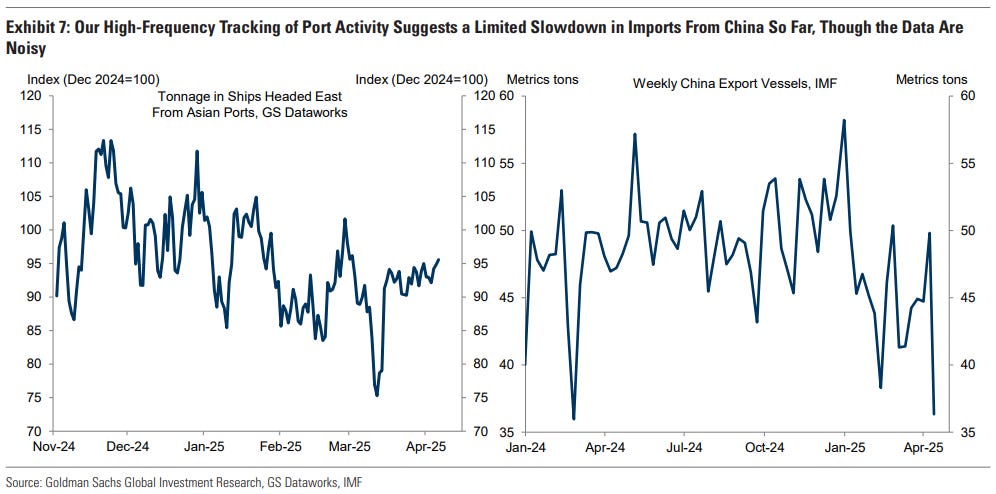
This effect would be the equivalent of a “sudden stop” in the same way the pandemic was, with equivalent supply-chain layoffs possible. Not much sign yet in port activity.

The war has far more room to get very dark if it goes that way.

The sell-off in Treasuries partially reflects the initial inflationary impact of tariffs but is also affected by a stalwart Fed and some element of discretionary capital outflow from the US (a bit on this later).


Both GS and Atlanta Fed are still around the zero-level for Q1 GDP growth.
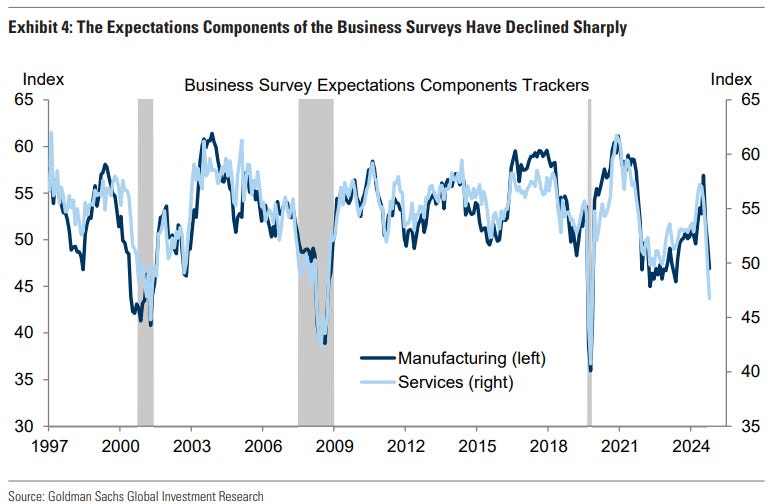
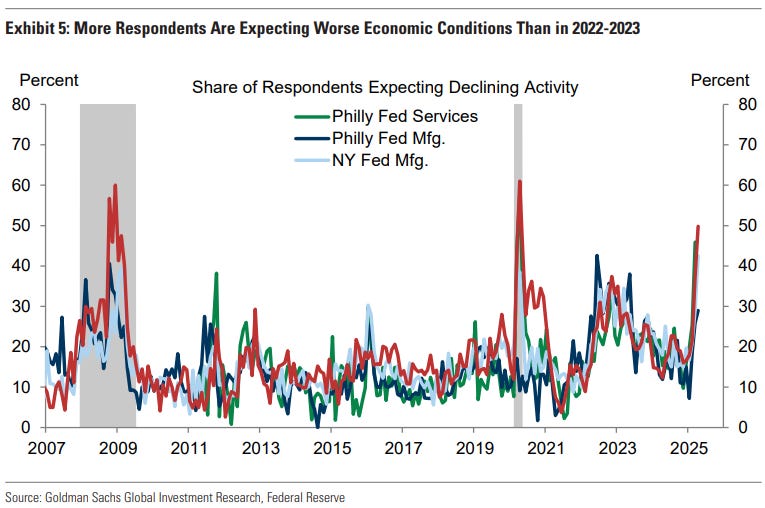
The expectations components of different surveys are all pointing towards a poor forward outcome; however, we saw something similar in 2022, and recession was avoided through a re-expansion in the budget deficit.

The chart above from GS tracks the average evolution of soft and hard data after a significant event, and on the right what it looks like right now.
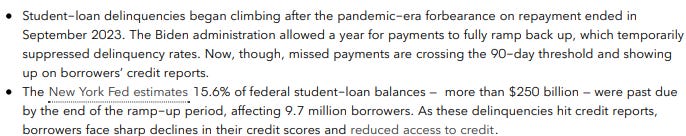
Bloomberg has highlighted the effect of the end of forbearance on student loans and highlighting the possible hit to consumer spending.
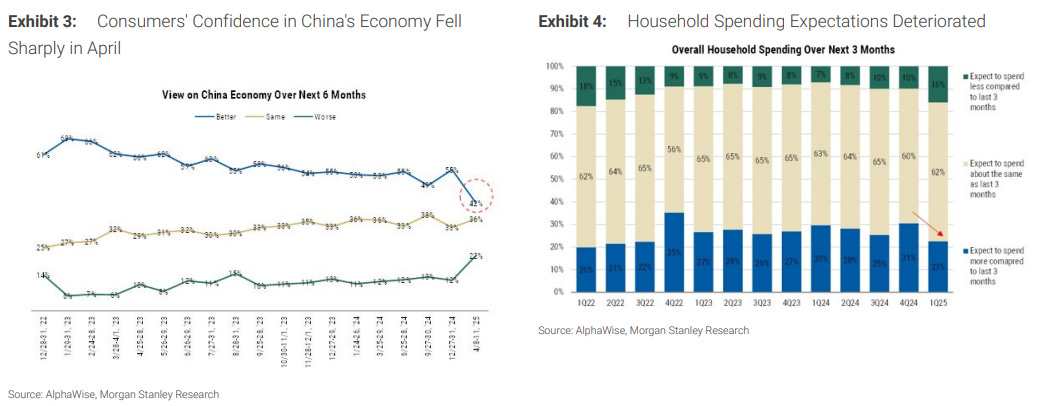
Away from the US, Chinese expectations are also decreasing, with a bumper Q1 (helped with subsidies) looking like it will be reversed. Despite China’s stable face, this shift in global trade may affect them more than the US.

For EM the story is similar…

…with some EM having enormous exposures to trade. If the US is hit, expect others to fall.
The hard data
The hard data this week has been good.

No sign of employment issues.

Redbook retail sales were the highlight of the week showing strength in a piece of data that is entirely post the tariff announcement.

Always worth keeping in the back of your mind that the deficit continues to track far higher than last year and 2022.

As mentioned last week, Chinese economic growth progresses well, with a recovery in the consumer at the end of last year (subsidies on durables helped with this).
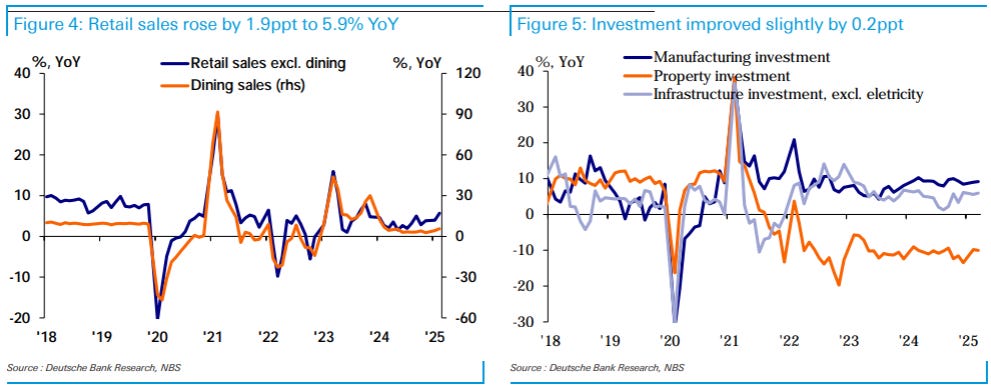
Measures of investment stabilised, with property investment (and property prices) slowing their fall significantly.
The US external position and bonds
Developed countries rarely face external funding issues because they can print the same currency that they borrow in. For an EM, the situation is different as a large part of their borrowing may be in a hard currency (like USD) and are thus at the mercy of their own currency devaluing against it.

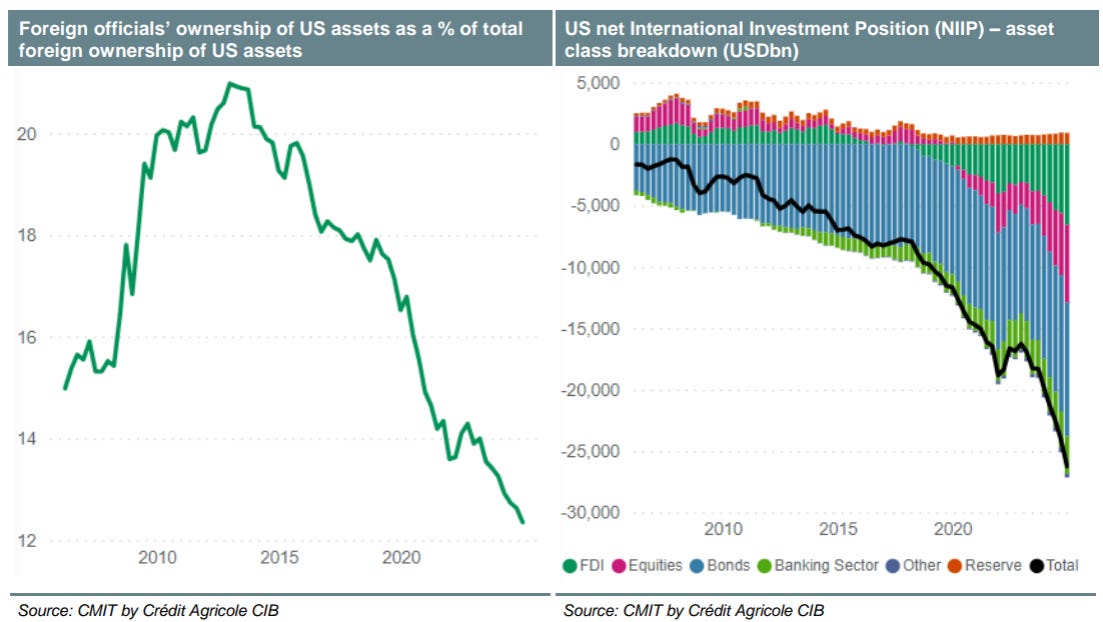
Both SocGen and DB this week have put out pieces suggesting the US is experiencing its own “balance of payments” crisis.

The divide between currency and bond performance is indicative of such a crisis, with a possible explanation being that the US is struggling to get the external financing that the trade deficit requires.
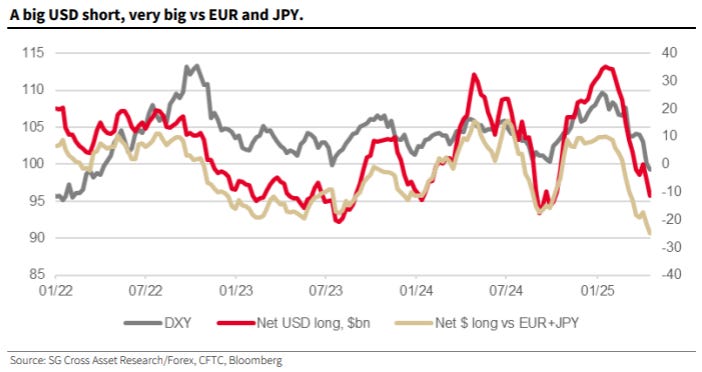
This has manifested itself in very short positioning against the USD for leveraged punters.
In my opinion this can’t continue forever, especially if the market is betting on the old world of a return of the US consuming the world’s output. The US isn’t just a small EM where people can optionally allocate to. They are 65% of the world’s consumption, and the globe remains leveraged to this. You cannot escape their weight.

JPM put out a timely piece this week (at the highs) on how gold gets to $4000/oz.
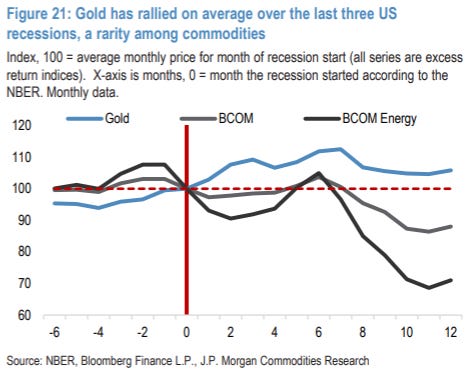
The above shouldn’t be a surprise, but here is a chart that illustrates gold’s role in a portfolio.
Thank you for the time you put into this, Mr. Farac. Honestly very helpful for any aspiring macro investor.
Best,
Valentino
This is very insightful- thank you for the work you obviously put into this excellent piece.