
Charts & Notes: Chinese economic stagnation
China's Q3 GDP reveal problems on multiple fronts that fiscal isn't patching

Inflation, oil & bond yields
While we await this week’s inflation print bond yields print new recent lows.
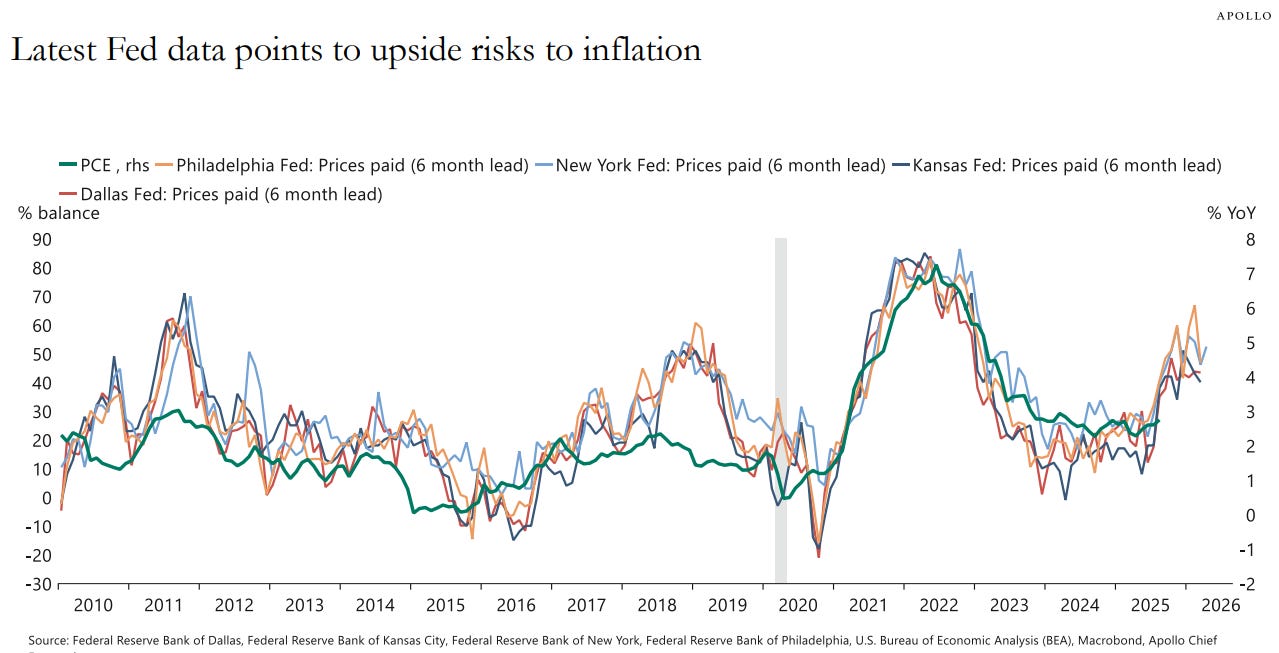
Apollo (and others) produces a chart which suggests that prices paid will lead to higher core CPI. Note that the same uplift happened in 2018 - the first lot of Trump tariffs. This should be ignored.
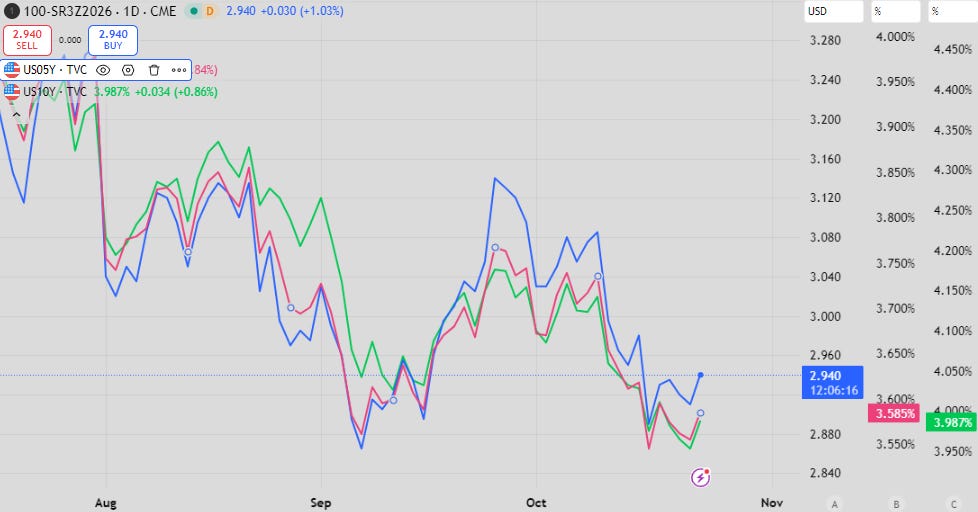
Bond yields definitely aren’t trading like this pickup in inflation is a risk. Longer maturities have fallen below September lows as the front-end regains ground from the fade of rate cut excitement.
This led to a decent flattening of the curve. The main driver has been oil, with a heightened equity volatility the secondary catalyst.
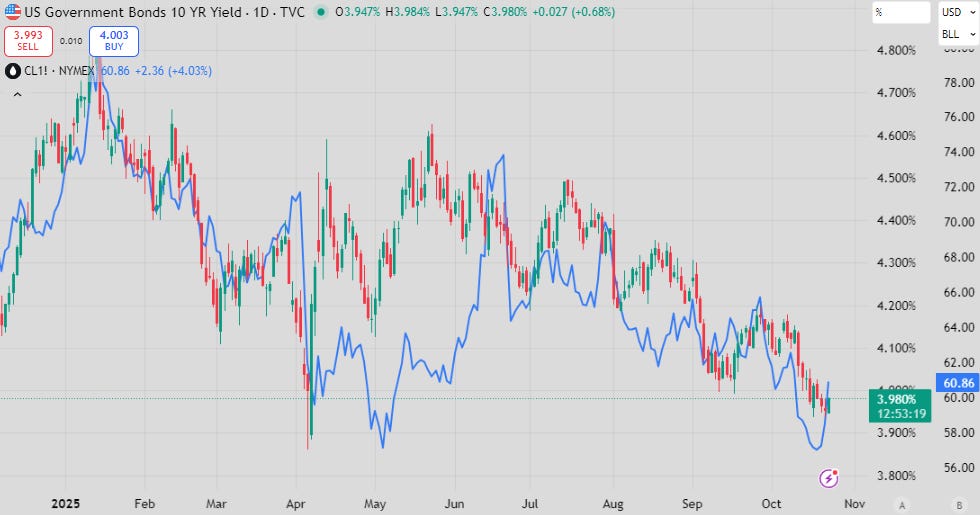
The correlation between bond yields and oil has been decent recently, but of course they are heavily related for fundamental reasons and are self-feeding.
The fall in oil prices this month were a combination of supply drivers (OPEC increased), while demand slowed (US gasoline consumption). Renewed chatter of Russian sanctions have recently rescued oil prices.
Lower oil can signal lower demand and thus lower economic growth. To complete the feedback loop, lower oil also means lower inflation which reduces breakeven inflation and thus nominal bond yields.
China growth update - fighting too many fires
I’ve highlighted the positive impulse from a big step-up in central government spending a number of times as a factor that is positive for global risk. China is (reluctantly) on that list.
The Chinese fiscal impulse firehose seems to be getting eaten up by a number of ongoing fires that seem to just be getting worse or require too much water to stabilise.
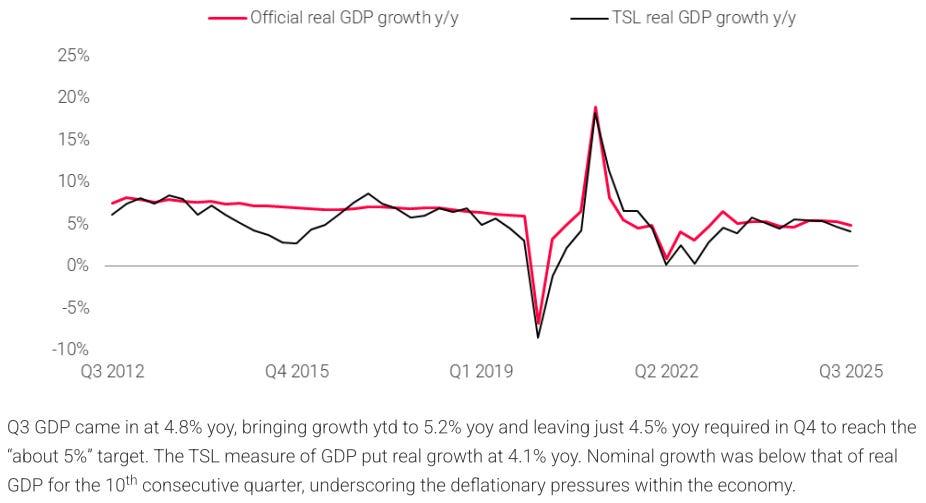
Q3 GDP and its partials don’t tell a good story. While growth will likely hit the “around 5%” marker with quarterly growth now estimated at around the 1% mark its unlikely we are seeing an acceleration. If anything, next year will be even more difficult.
This is all despite a big ramp in government spending and other demand-side initiatives.
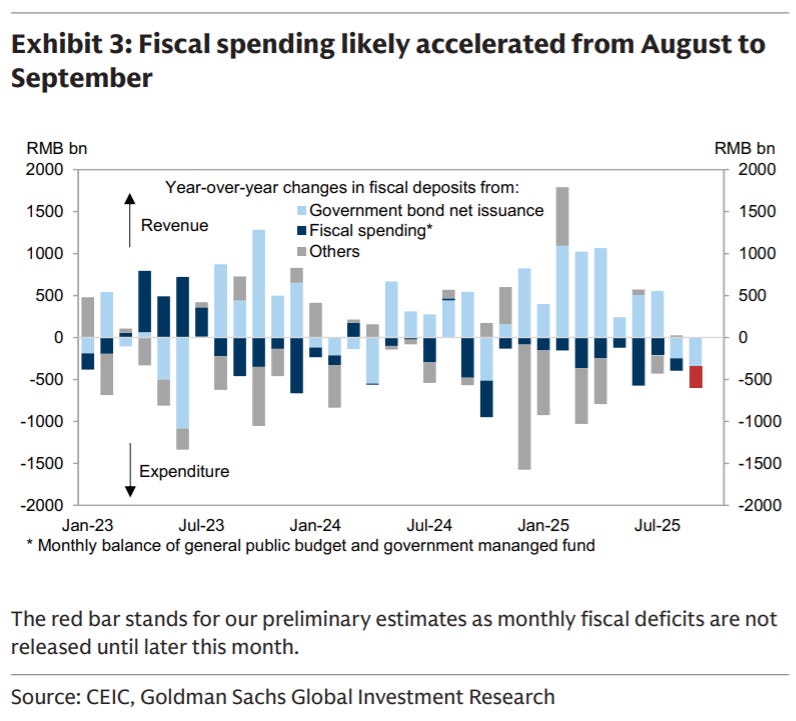
The main problem is that China’s engines for growth are still slowing, and the fiscal response seems to be barely sufficient to offset these effects.
Housing & fixed asset investment
The huge surprise from the Q3 GDP numbers was the fixed asset investment numbers which are showing a huge drop-off. While weather may have been a factor, headline FAI dropped by 0.5%, the lowest growth in a decade.
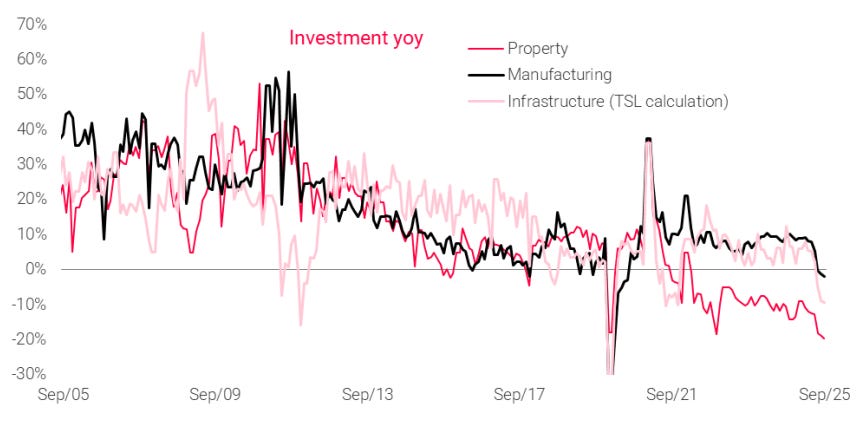
The anti-involution (please please don’t sell stuff below cost) drive is likely having some effect on slowing manufacturing investment here. Every slowdown in supply growth helps. Manufacturing investment, one of the highlights of the post-housing investment China, slowed to 4%.
Take out housing and FAI grew by 3% year-on-year.
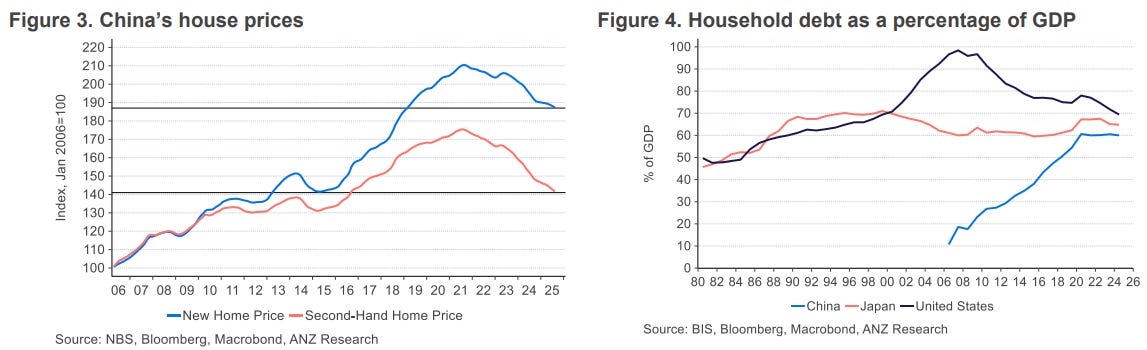
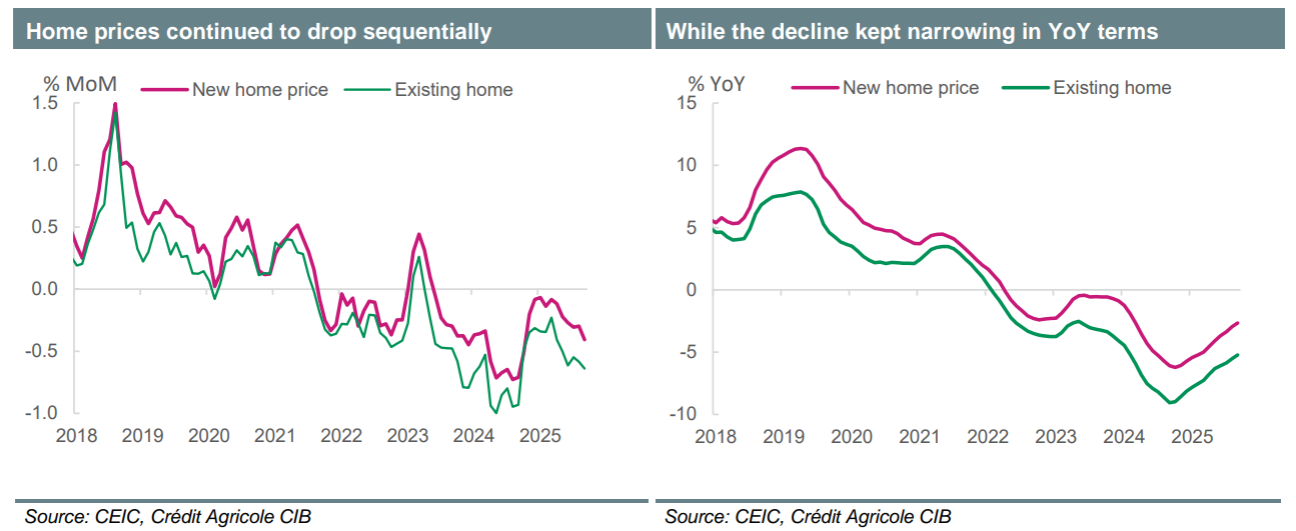
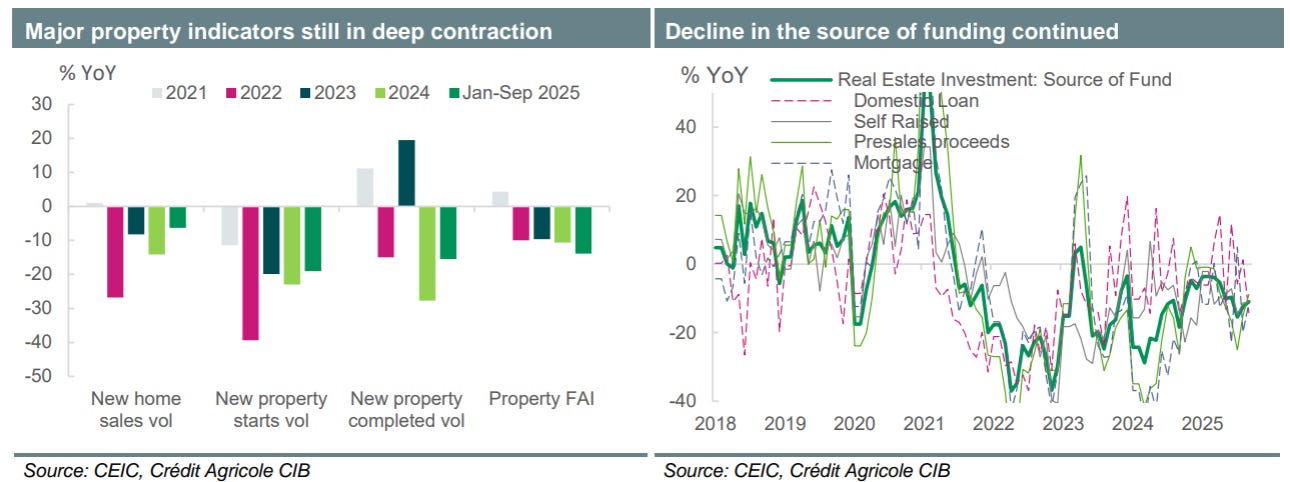
After some positivity at the turn of the year, monthly falls in housing prices seem to be increasing again. In year-on-year terms there is still improvement, the current path doesn’t look good.
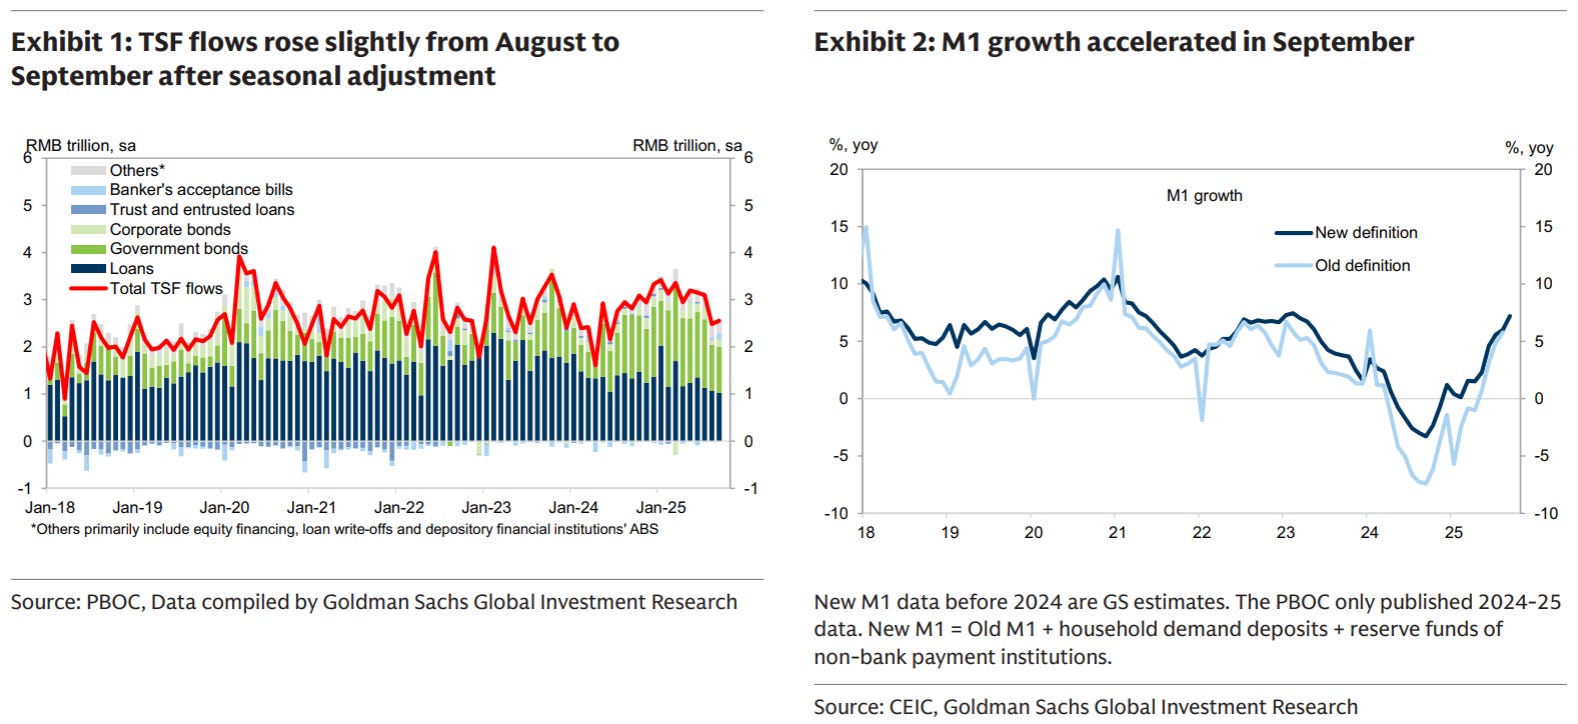
While debt growth from government is up, it is working against a slowing of loan growth elsewhere.
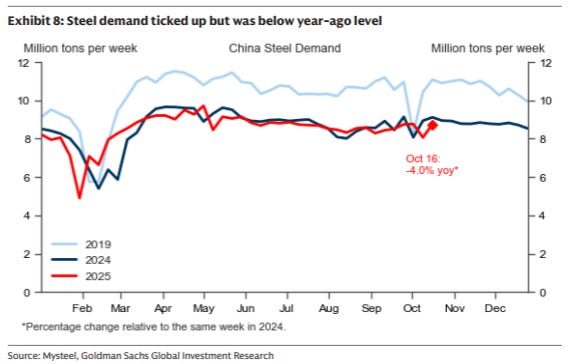
Steel demand is also slowing…
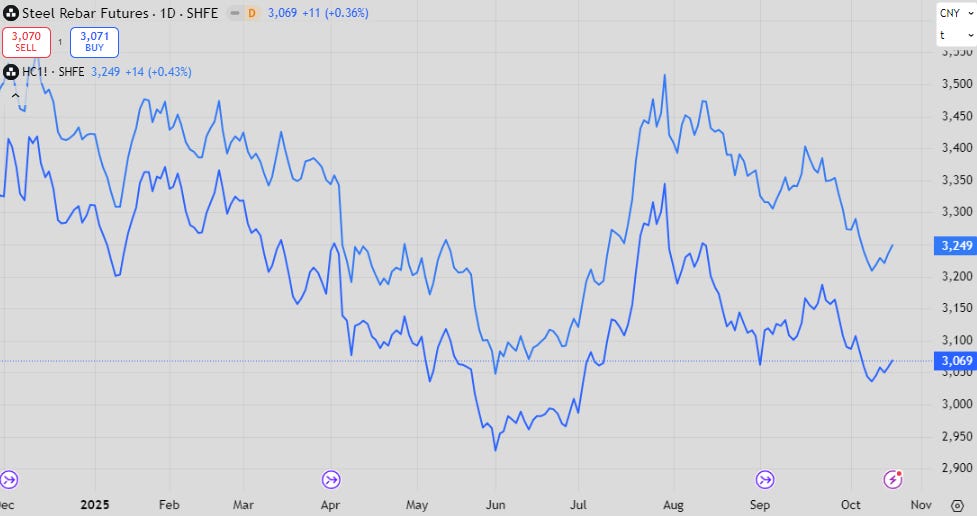
…which is reflected in steel prices (despite the fact that iron ore is still trading stronger).
Retail sales
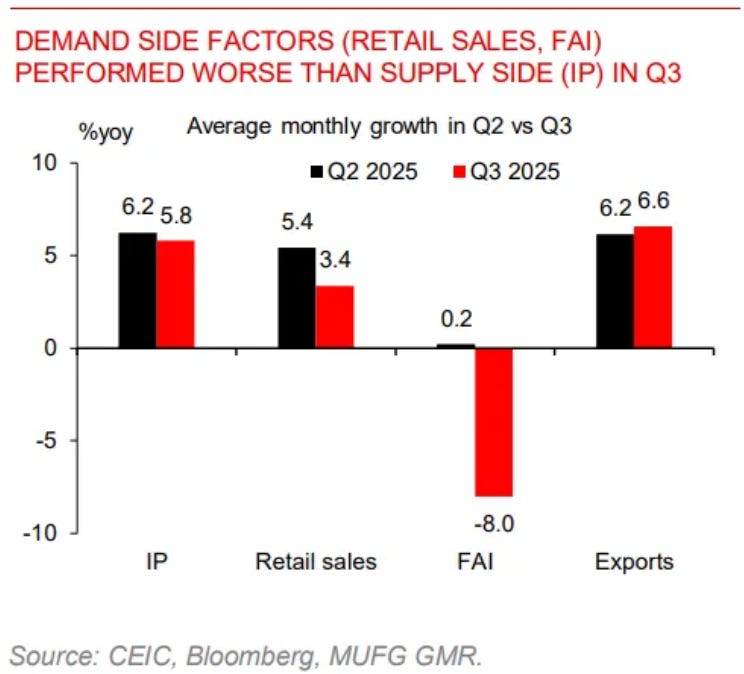
While industrial production is still a bright spot (see exports further on), retail continues to struggle and is slowing rapidly as demand-side incentives peter out.
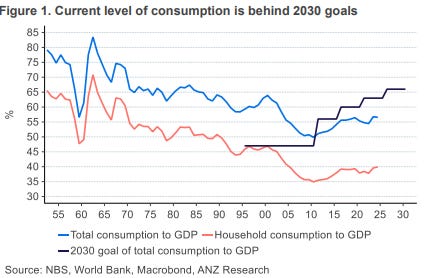
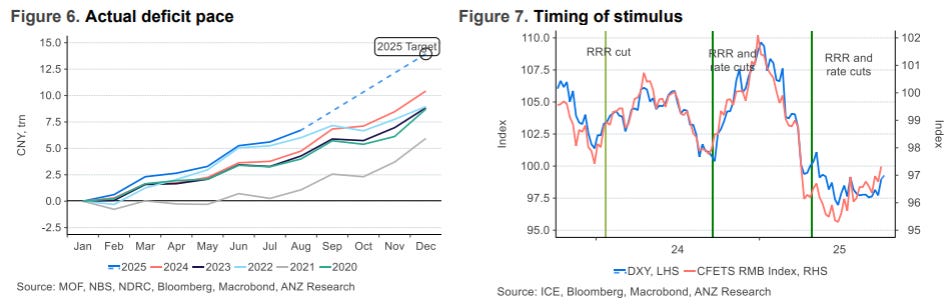
Consumption, a key 2030 goal, is lagging. Most of the improvement you see above is due to investment slowing, rather than consumption growth meaningfully increasing.
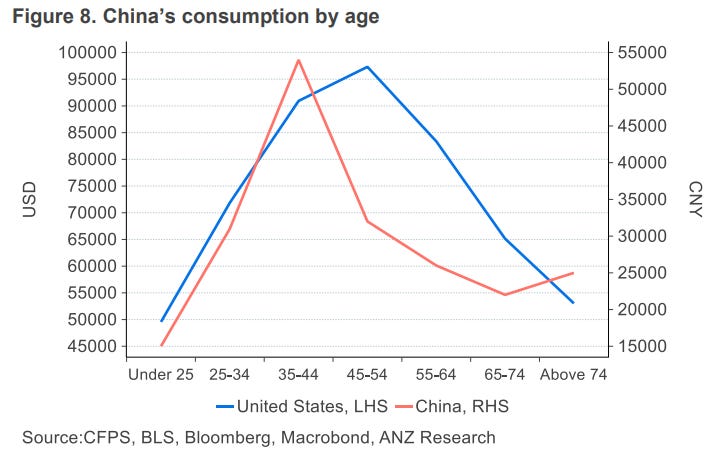
China realises that it can’t rely on investment forever. There just isn’t an endless supply of economically accretive projects you can dedicate capital to! At some point capital investment is suitable for your level of development (or in China’s case the demand for its exports).
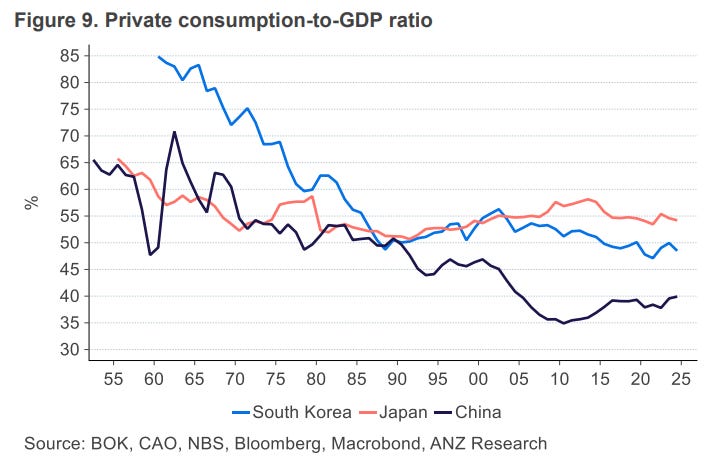
A helpful chart from ANZ above shows how far China lags behind its neighbours.
Inflation
One fire that has been tempered has been the deflationary problem.
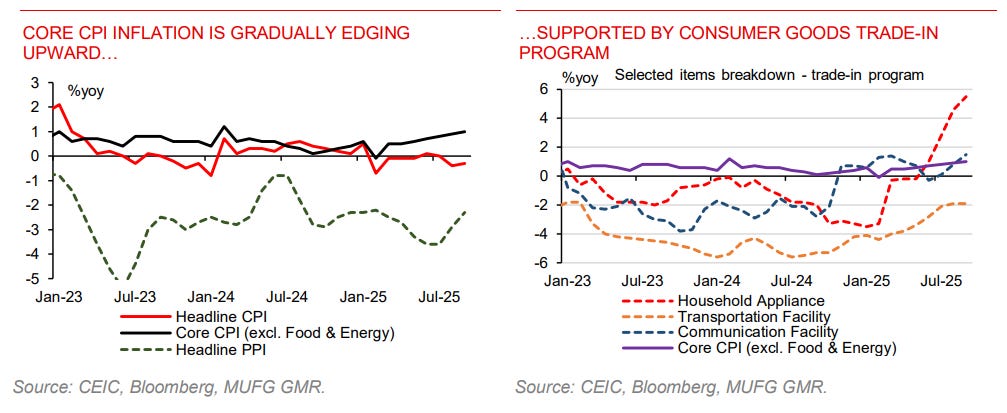
Core CPI is ever so slowly increasing, but this may also be partially tied into the consumer goods trade-in programme which has helped absorb supply. This effect is ending.
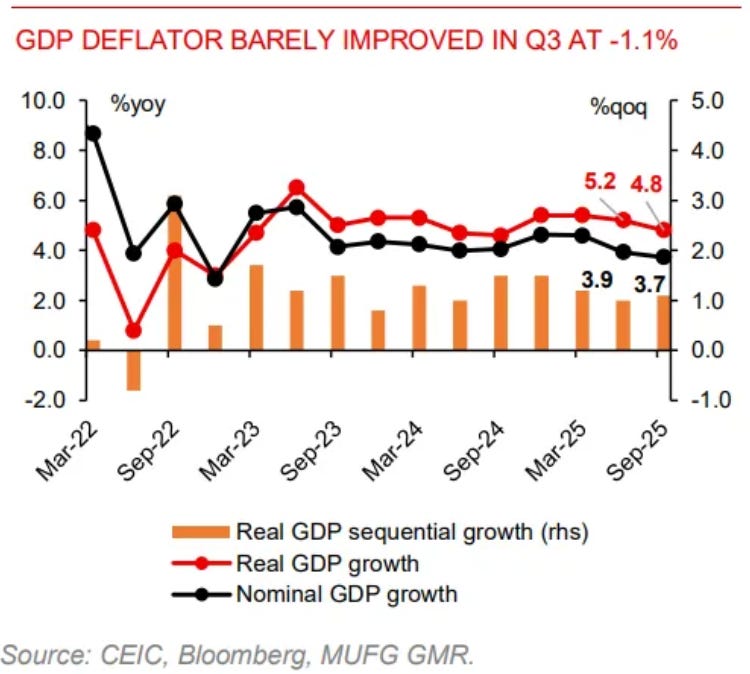
The GDP deflator (inflation implied in the GDP figures) is still negative. This puts nominal GDP growth in China well below the US. The days of projecting the nominal size of the Chinese economy to be greater than the US are long gone. These charts were a favourite of every macro commentator in the early 2010s.
Exports
Exports to the US have collapsed and haven’t recovered as I pointed out last week.
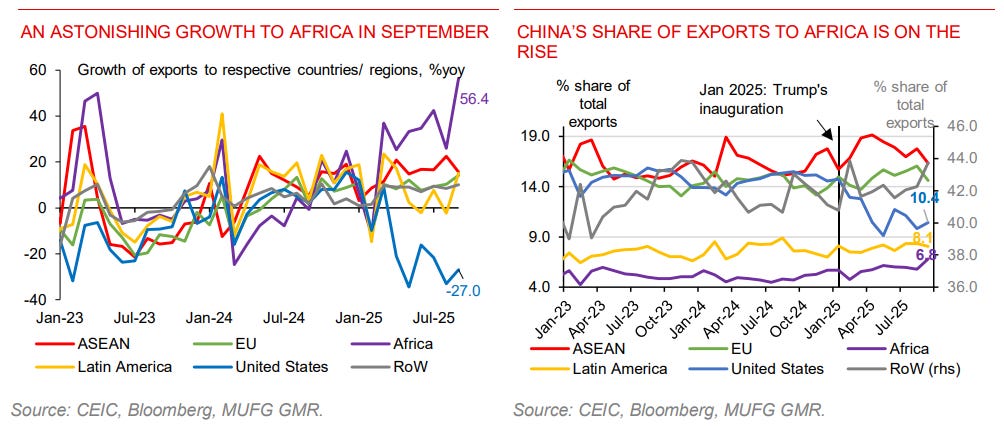
Where they have growth is to Africa. Chinese interests in Africa are ever increasing and are surely driving this trend. It remains to be seen how useful this will be for China in the long run.
Demographics are destiny, as they say.
Internal growth struggle seems like powerful leverage for the US during trade negotiations as exports remain the only avenue keeping things moving in China. Thanks, Peter.
Be patient. https://igreaterchina.substack.com/p/the-fiscal-architecture-of-chinese?utm_campaign=post-expanded-share&utm_medium=web