

Little by little the April 2nd dust settles.
The Japanese trade deal continues to show that China is the only country targeted for trade deficit reduction and others are only expected to donate some margin compression on exports to partially fund tariff take for (and show loyalty to) the US government. Allies get away with <20% tariffs, but it’s still to be seen where enemies end up.
The Japan deal makes life difficult for Europe who are stuck between a rock and a hard place as they start to realise that free trade with China might not be in their favour either. Europe will be discussed next week as a trade deal sharpens up, but this week it’s all about Japan and wider Asia on trade.
Japanese trade deal and elections
The 23 July Japan-US trade agreement came sooner than expected and is a significantly better outcome than the previously proposed 25% tariff.
The US reciprocal tariff rate for Japan will be set at 15%, and includes motor vehicles and auto parts, and Japan will further open its markets – including automobiles and agriculture – to US exporters.
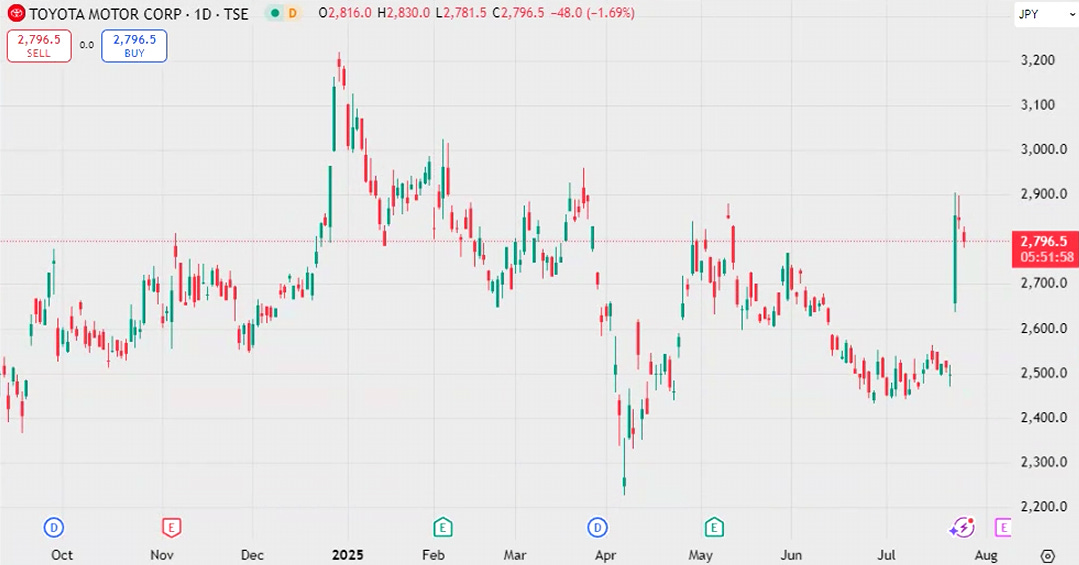
Toyota traded much higher on the news, rallying more than 14% on the day. Japan gains a nice 10% advantage on the Europeans and anyone else that takes their time to make a deal.
Japan is also to invest $550bn in the US. I’m not really sure what these numbers mean and how they can be achieved but there’s that (if the goal is to reduce the trade deficit with Japan, then they can’t possibly invest more than they do now). I suspect this part of the deal is purely for optics and it gives Trump a big number to talk about.
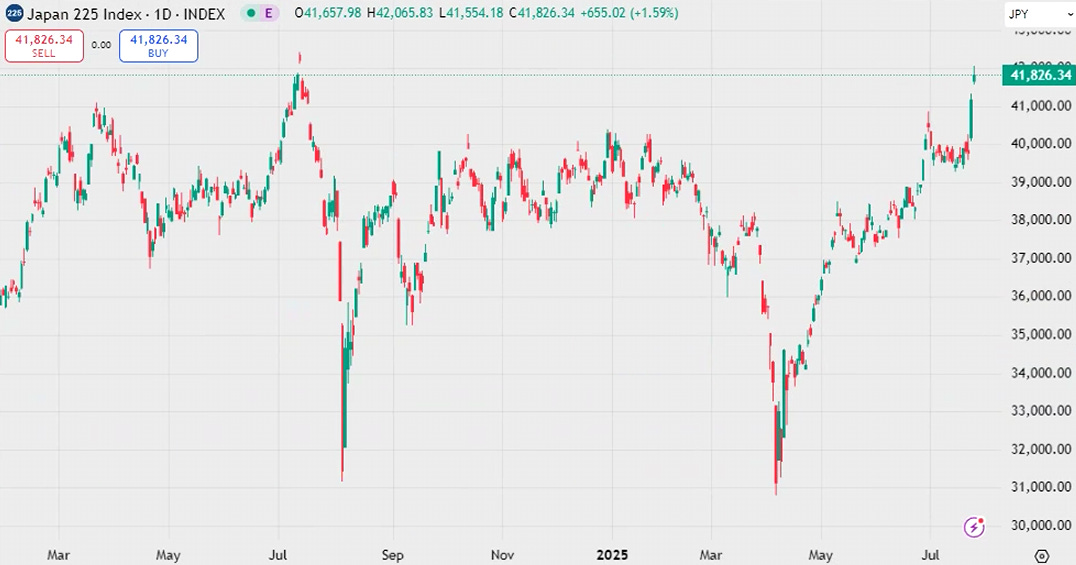
The Nikkei also rallied strongly on the news (3.7% on the day), despite election results over the weekend.
Over the weekend the LDP-K coalition lost its majority in the Upper House. This is the first time since its formation in 1955 that the Liberal Democratic Party has not had a majority in either the Upper or Lower House. We’ll have to see if PM Isihiba will resign. At the moment he has said he is staying on.
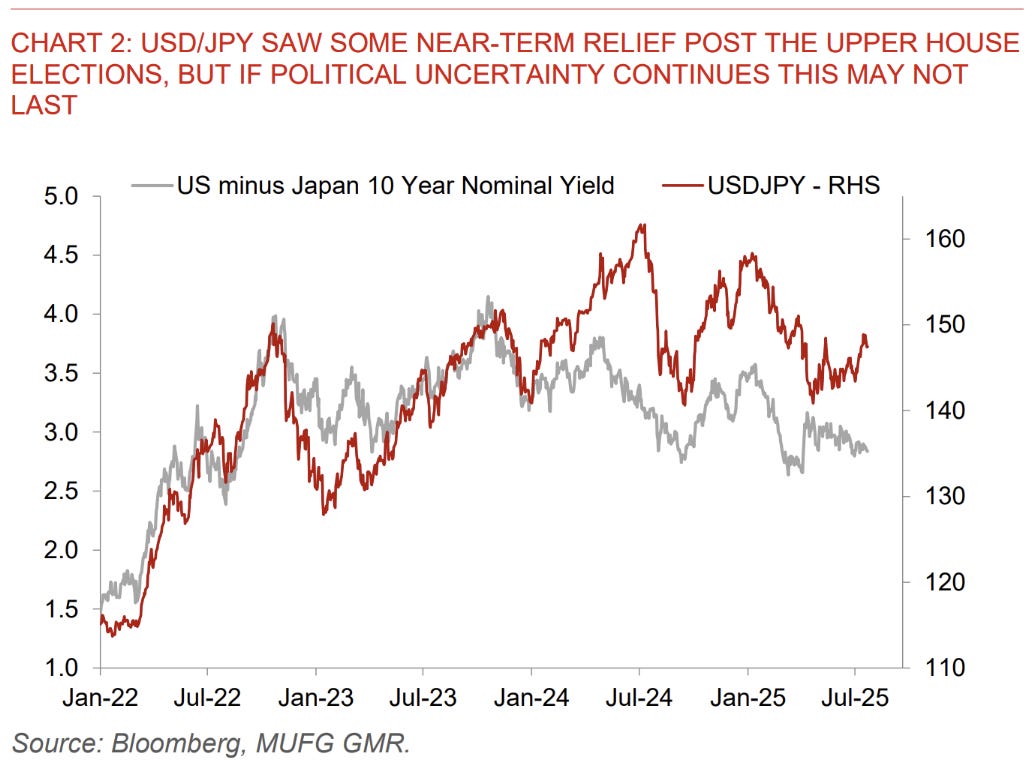
Regardless of Ishiba’s fate, if the LDP-K coalition is to continue to govern, it will need to become more dovish on both fiscal and monetary policy, given the campaign platforms of the major opposition parties which made strong gains in the recent elections. Specifically, the opposition parties focused on reducing the consumption tax and slowing the pace of rate normalisation from the BoJ.
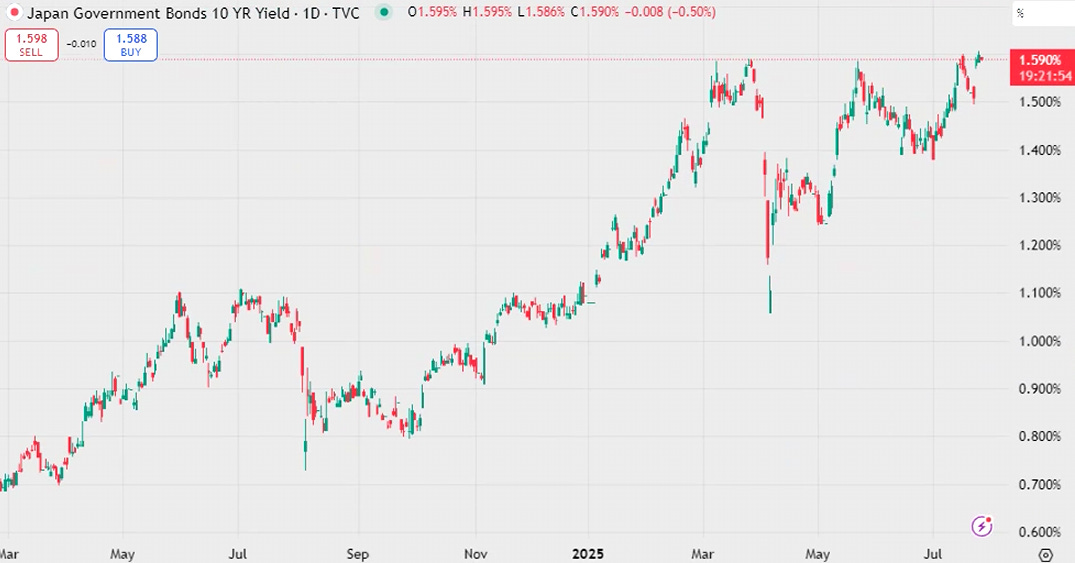
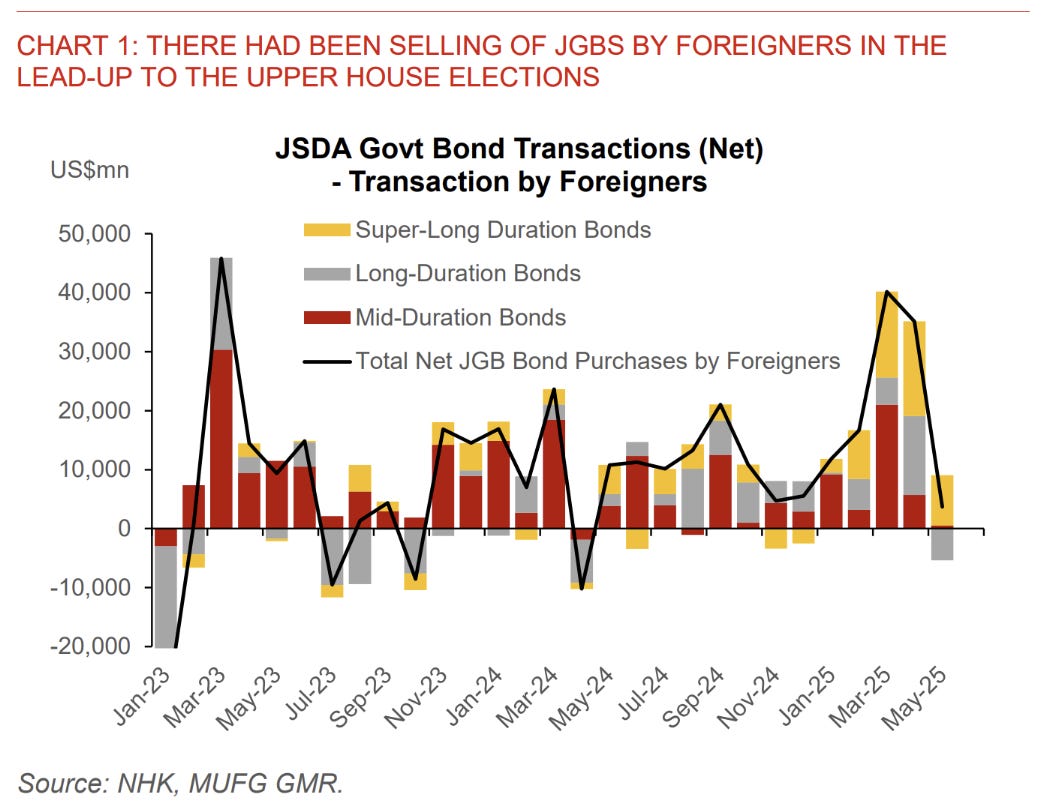
A more pro-growth stance will increase pressure on JGBs which have taken a breather from marching higher despite lower foreign buying this month. 10y JBGs (above) are teetering on the edge of breakout.
Offsetting this will be greater bill issuance as limits for longer issuance are unlikely to be raised.
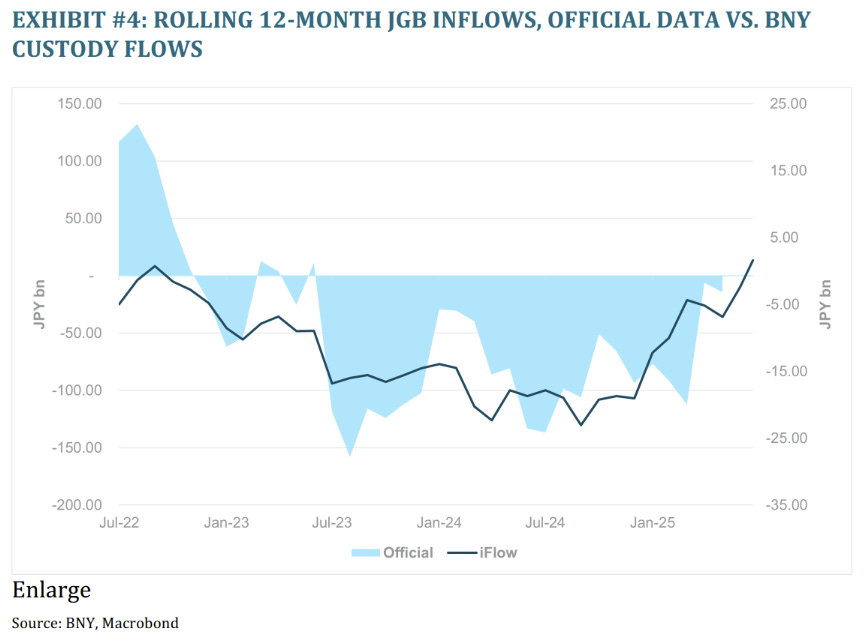
Inflows are still sensitive to yield developments, but apart from the last month are still improving.
Elsewhere in Asia…
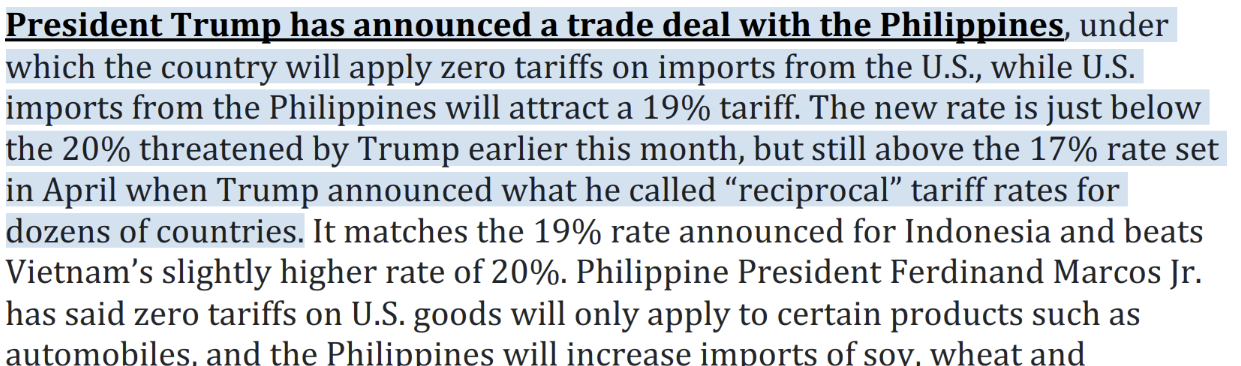
The Indonesian deal reduces the 32% “liberation day” tariff to 19%, with no tariff in the other direction.
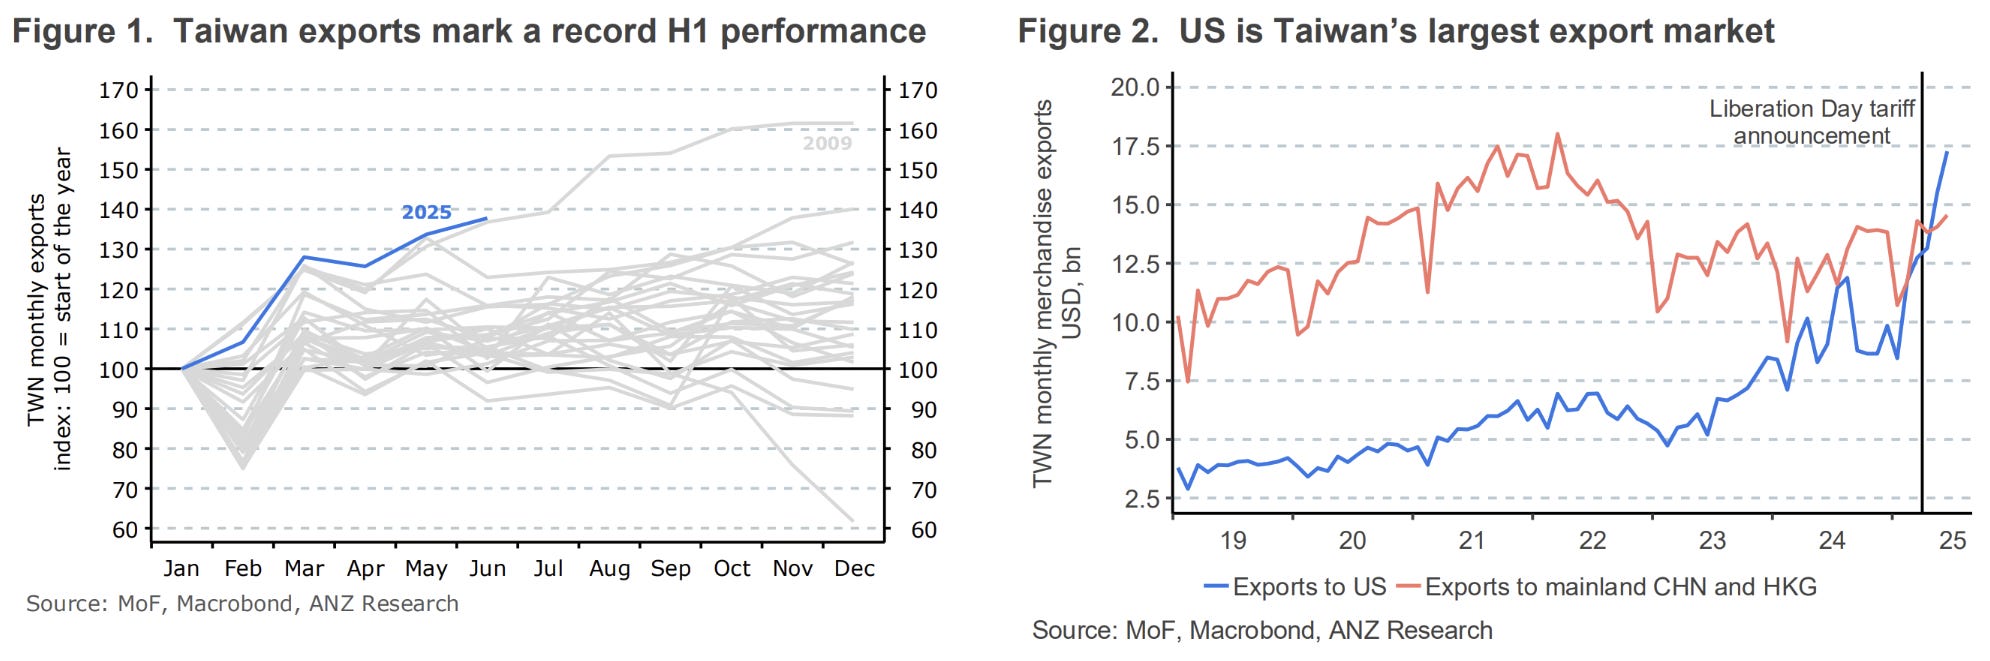
Taiwan is reporting very strong exports…
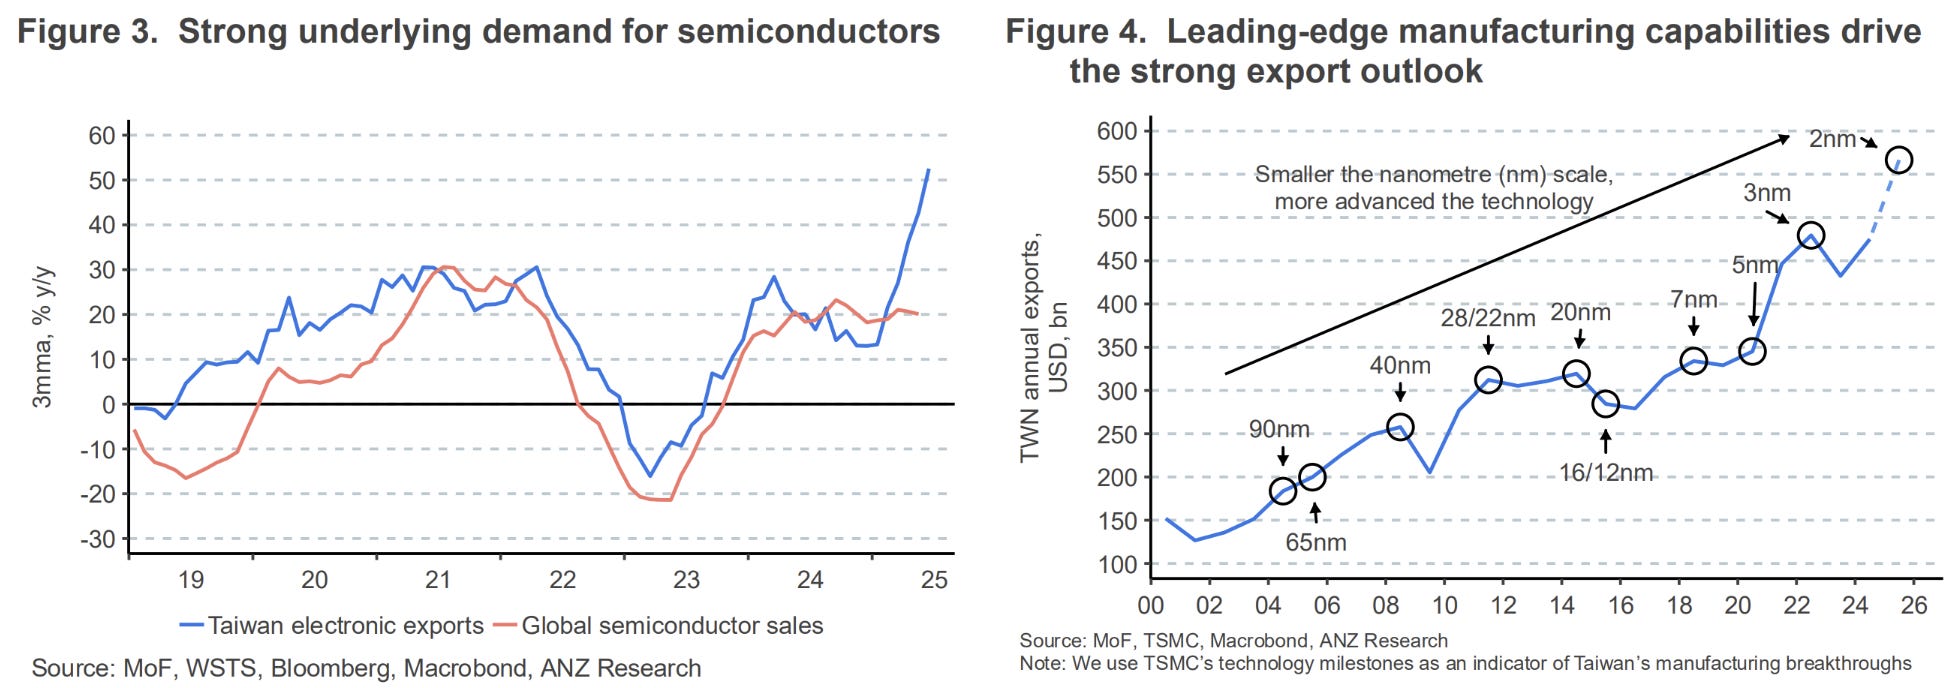
…but this is limited to semis demand.
The big news from China was the announcement of the building of the Yarlung Tsangpo dam project in Tibet.

The project, set to generate 3x the electricity of the 3 gorges dam, will cost around $170bn and lift Chinese GDP by 0.1% annually on its own. What an excellent way to consume excess capacity in cement and steel production!
Iron ore and related commodities have recovered quite a bit this month and continued the move on this news.
Markets
US bonds remain in a tight range, with the long end showing more momentum towards higher yields.
Yields higher is the easier narrative, but will be slow and difficult, while yields lower will be faster and all at once if something comes from the left field.
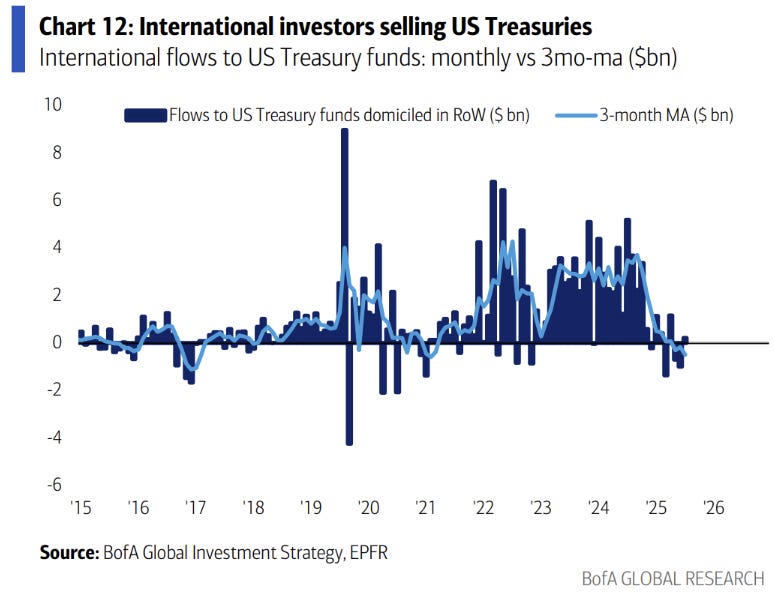
Foreigners tend to agree on the bias to yields being higher as flows dry up.
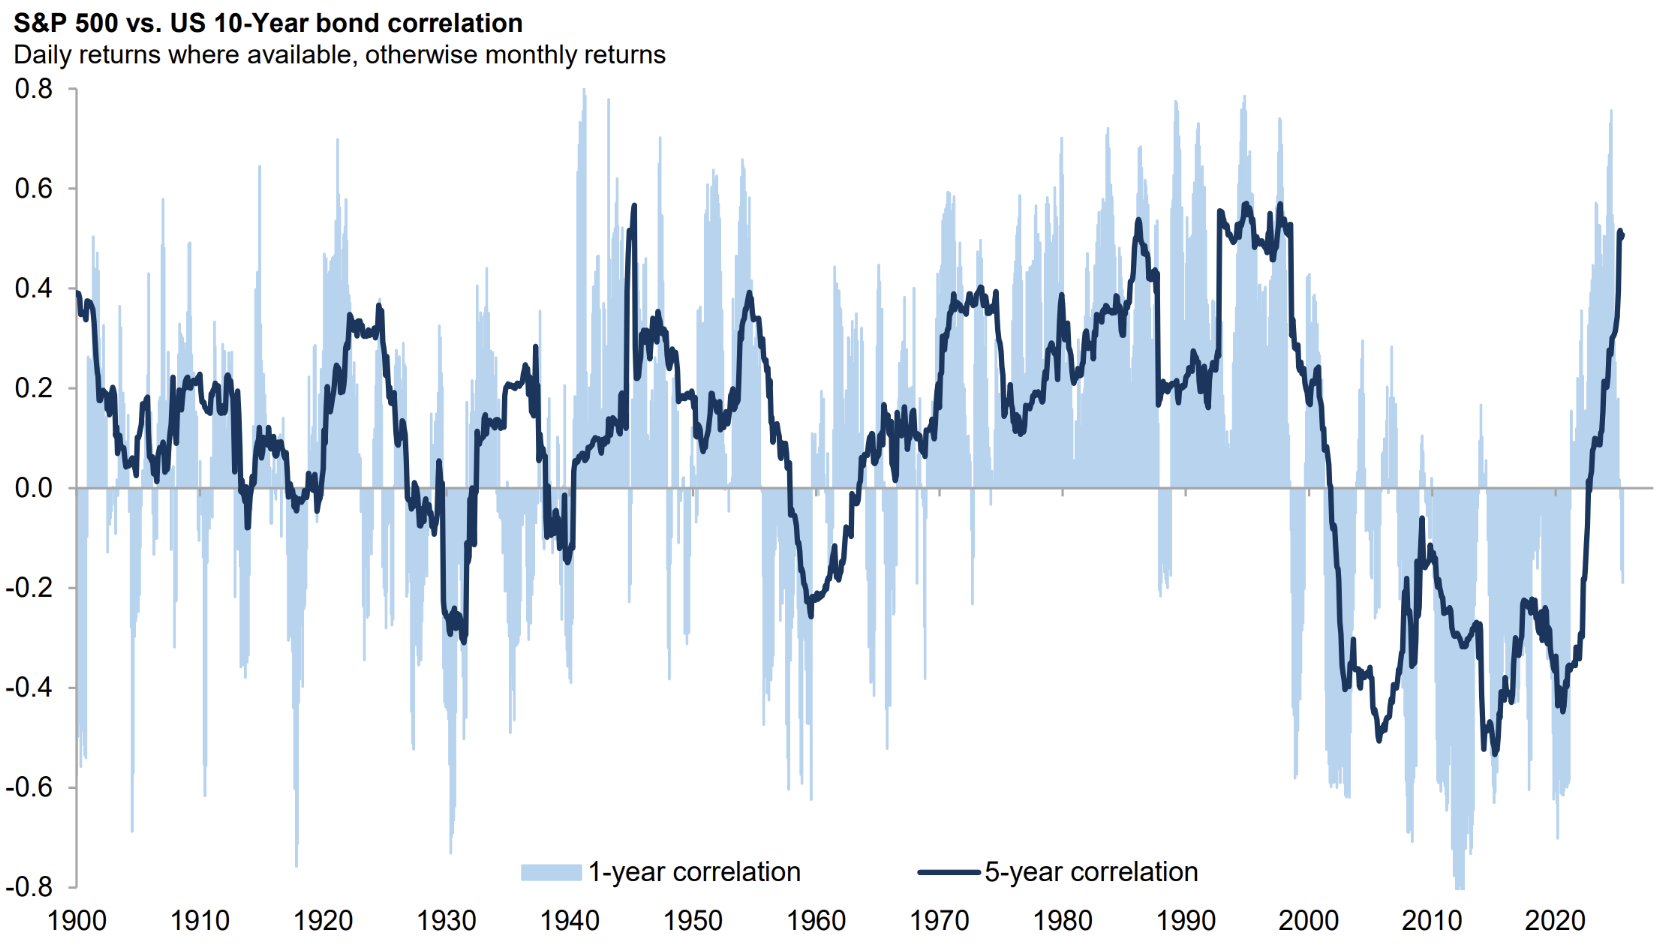
Longer-term correlations are still quite positive but shorter term is closer to no correlation (not a surprise if you watch equities and bonds daily).
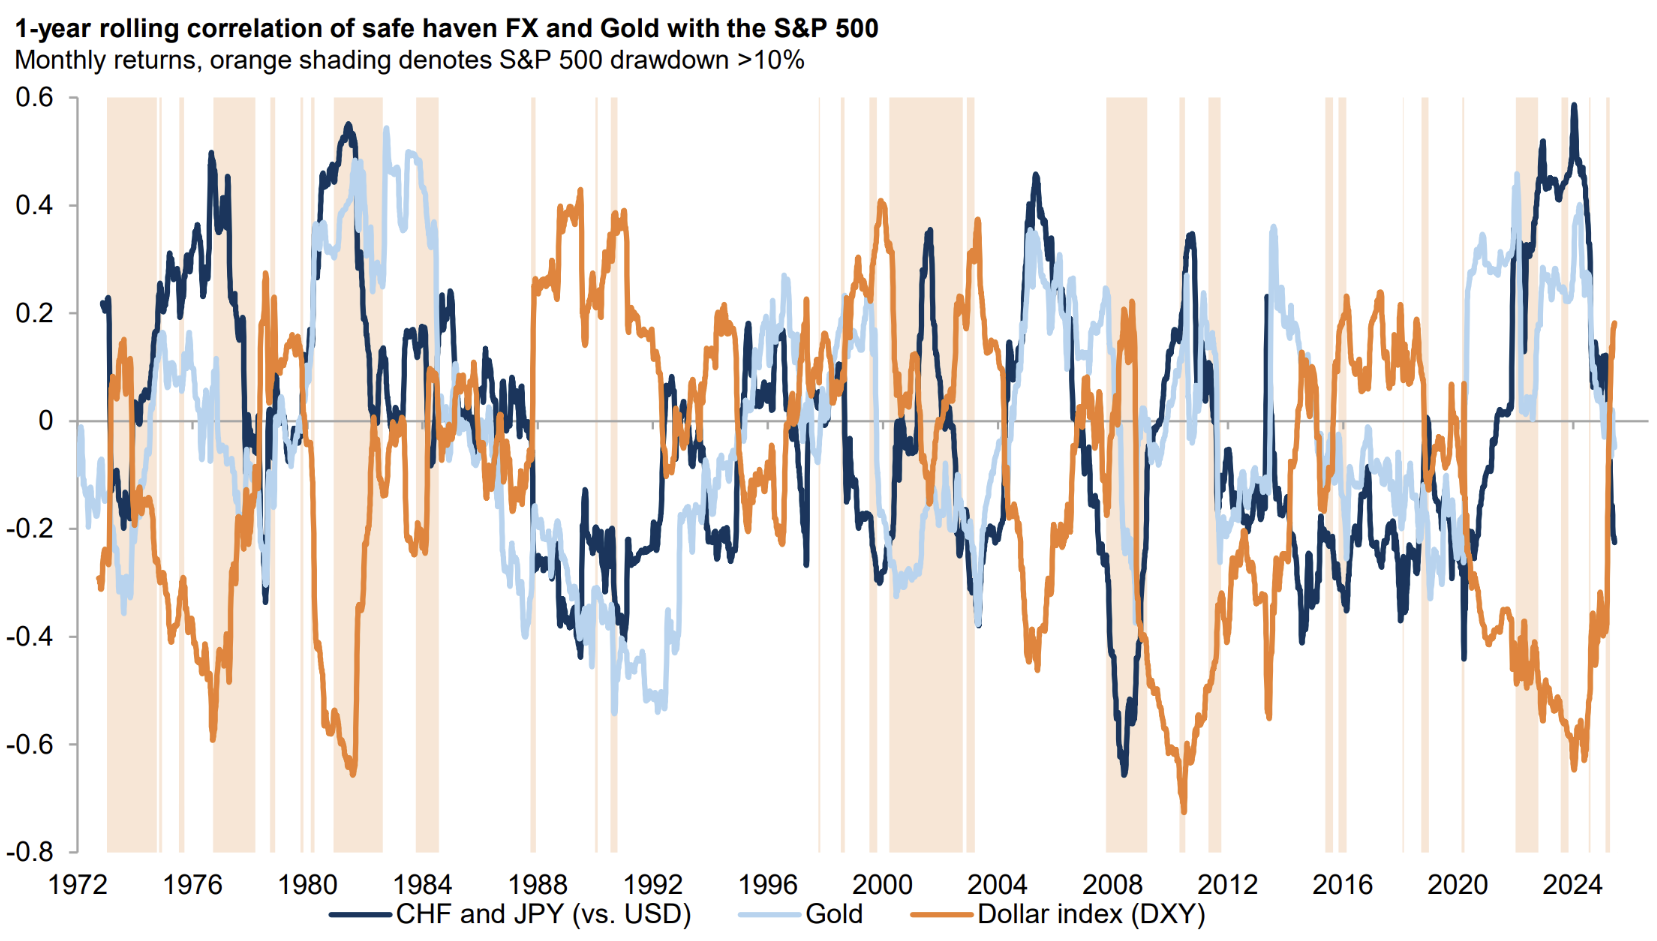
Gold’s correlation with equities is swinging towards a negative correlation away from positive, while the dollar does the opposite.

A popular chart this week has been the weakness in the equally weighted S&P500.
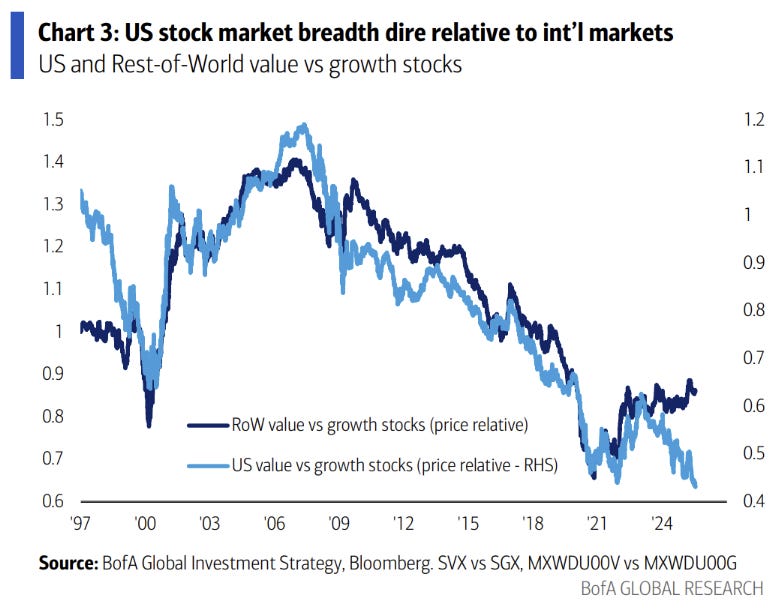
Similar is a breadth measure. The US stands on its own more recently in how much the big growth stocks are driving the index.
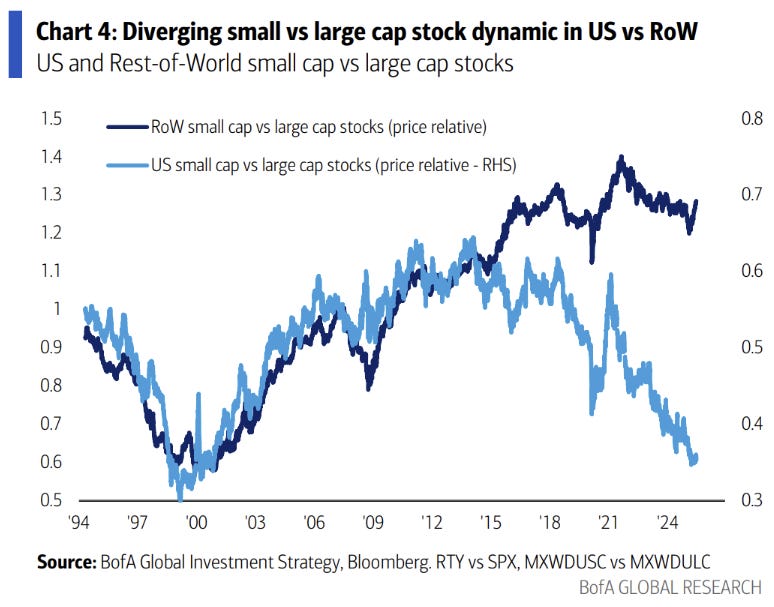
Even greater is the small cap v large cap divide.
Goldman Sachs had an interesting paper on the performance of new S&P500 index inclusions.
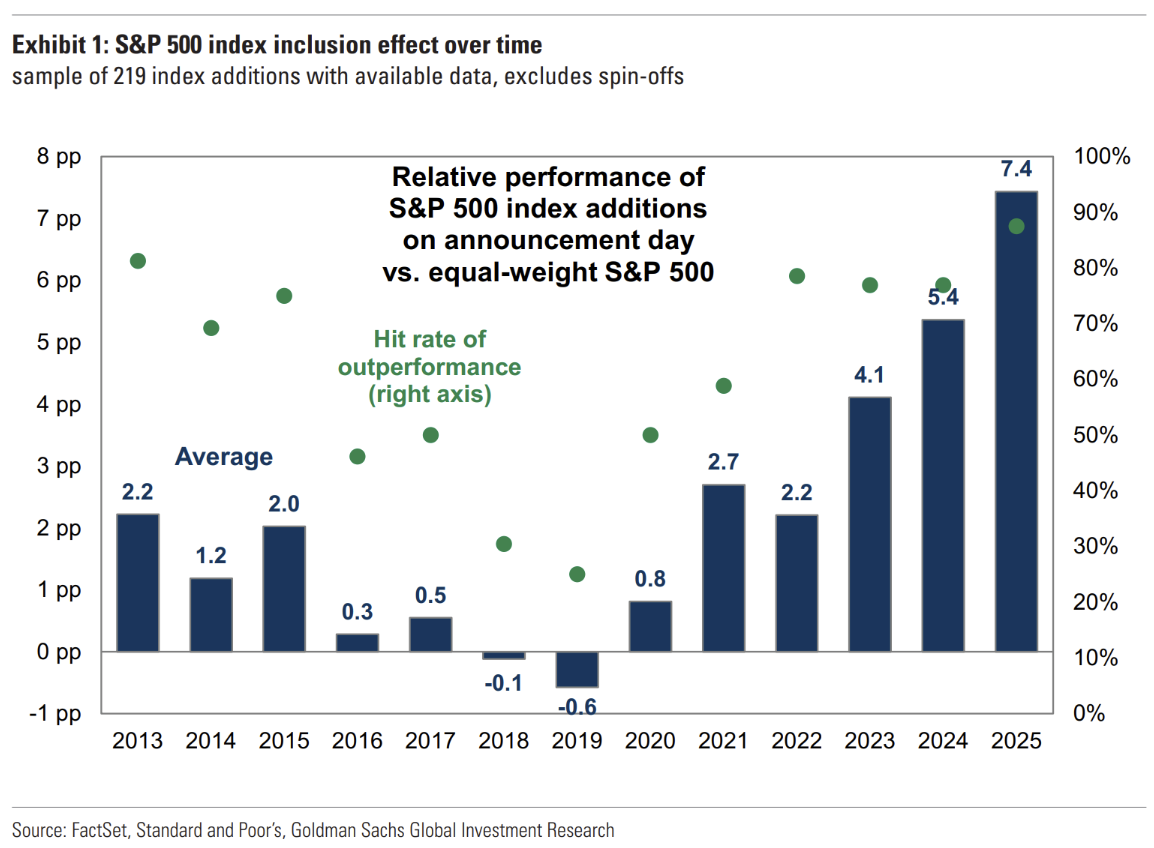
More recently the announcement of inclusion has driven considerable outperformance…
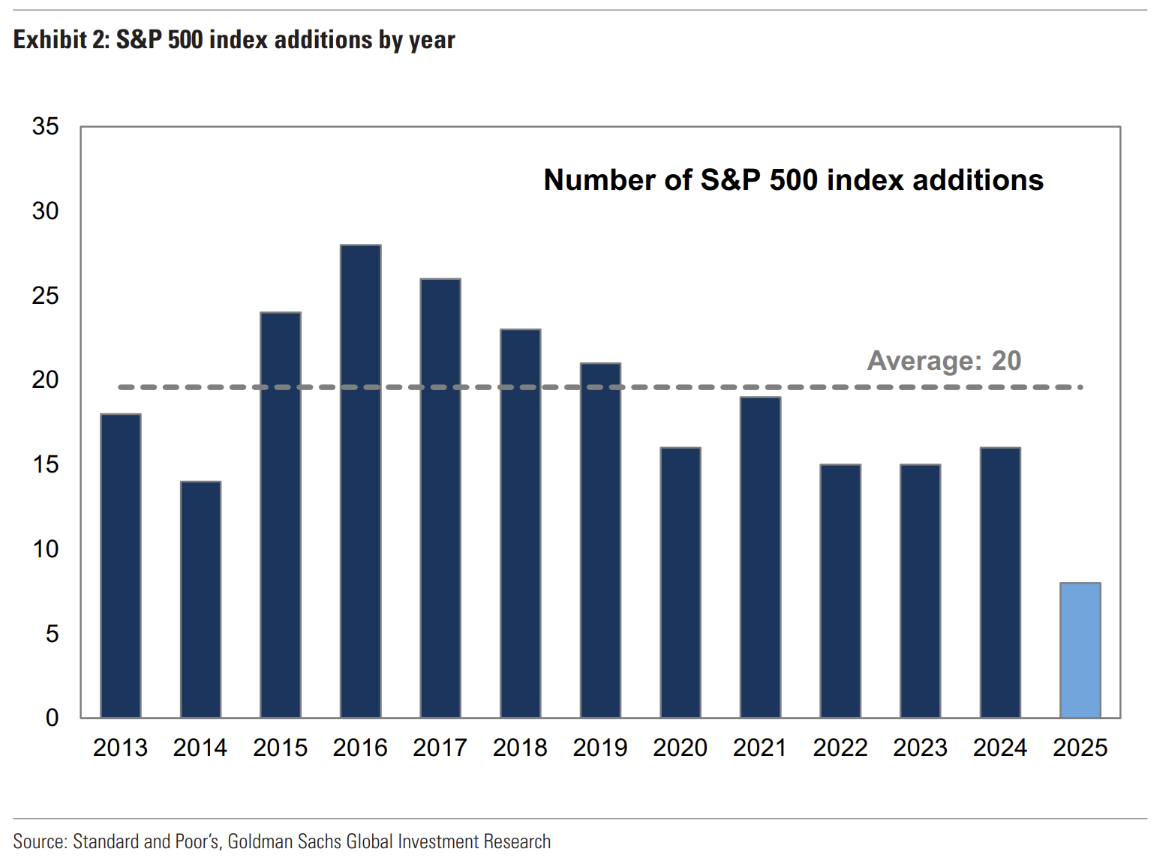
…which may be related to the fewer total inclusions.
Vegas as an indicator
You’ll regularly see commentators use Vegas traveller numbers as a broader indicator of the US economy. They’ve been poor for quite a while now. The video below shows why you should ignore them.
Essentially Vegas is experiencing the cost-of-living crisis but only in the way Vegas can - bigger and louder than everyone else.
I haven’t been there for a while but some of these changes floored me:
Triple-zero roulette and 6:5 blackjack???
$300 minimums to play the games with fair odds?
Lowest cost rooms are 3x what they were pre-pandemic
Out of control fees (we all know about resort fees, but what is a restaurant fee??)
The price gouging could be a result of the casinos suffering against online gambling, reducing subsidies from gambling on the rest of the business. Either way you should probably ignore anyone using Vegas patronage as a indicator of the broader economy.